


Abstract
The recent introduction of simultaneous whole-body PET/MR scanners has enabled new research taking advantage of the complementary information obtainable with PET and MRI. One such application is kinetic modeling, which requires high levels of PET quantitative stability. To accomplish the required PET stability levels, the PET subsystem must be sufficiently isolated from the effects of MR activity. Performance measurements have previously been published, demonstrating sufficient PET stability in the presence of MR pulsing for typical clinical use; however, PET stability during radiofrequency (RF)-intensive and gradient-intensive sequences has not previously been evaluated for a clinical whole-body scanner. In this work, PET stability of the GE SIGNA PET/MR was examined during simultaneous scanning of aggressive MR pulse sequences. Methods: PET performance tests were acquired with MR idle and during simultaneous MR pulsing. Recent system improvements mitigating RF interference and gain variation were used. A fast recovery fast spin echo MR sequence was selected for high RF power, and an echo planar imaging sequence was selected for its high heat-inducing gradients. Measurements were performed to determine PET stability under varying MR conditions using the following metrics: sensitivity, scatter fraction, contrast recovery, uniformity, count rate performance, and image quantitation. A final PET quantitative stability assessment for simultaneous PET scanning during functional MRI studies was performed with a spiral in-and-out gradient echo sequence. Results: Quantitation stability of a 68Ge flood phantom was demonstrated within 0.34%. Normalized sensitivity was stable during simultaneous scanning within 0.3%. Scatter fraction measured with a 68Ge line source in the scatter phantom was stable within the range of 40.4%–40.6%. Contrast recovery and uniformity were comparable for PET images acquired simultaneously with multiple MR conditions. Peak noise equivalent count rate was 224 kcps at an effective activity concentration of 18.6 kBq/mL, and the count rate curves and scatter fraction curve were consistent for the alternating MR pulsing states. A final test demonstrated quantitative stability during a spiral functional MRI sequence. Conclusion: PET stability metrics demonstrated that PET quantitation was not affected during simultaneous aggressive MRI. This stability enables demanding applications such as kinetic modeling.
The simultaneous nature of hybrid PET/MR offers unique advantages for a variety of imaging studies (1). Kinetic modeling has emerged as a significant research area that leverages the unique capabilities of PET/MR, allowing the investigation of dynamic processes in the body using complementary information from both modalities (2). For neurologic studies, functional MRI (fMRI) provides high spatiotemporal resolution for localizing brain activity, whereas PET provides neurochemical specificity (3).
Quantitative stability is critical for PET kinetic modeling (3–5) studies because the activity concentration is changing by small amounts. In dynamic imaging, both PET and MR acquisition generally begin at the same time. This means that the PET detector may undergo significant temperature increase during data acquisition. Furthermore, typical fMRI sequences are highly gradient-intensive and heat-producing, presenting data stability challenges for the PET detection system, which is highly sensitive to temperature changes. Any slowly varying temperature-induced gain change could affect PET quantitation in ways that distort the PET time–activity curve. PET sensitivity change resulting from radiofrequency (RF) interference could also affect the time–activity curves in a way that is related to the RF power of the simultaneously pulsing MR sequence (6).
The broad pursuit of achieving quantitative PET (7) also requires detector stability during MR pulsing. For example, longitudinal studies (8) and multicenter clinical trials (9) necessitate minimizing sources of quantitative variation. Additionally, RF-induced changes in event rates could reduce the effectiveness of data-driven gating methods that use coincidence (10) or singles (11) data to extract the biosignal waveforms.
However, the challenges of acquiring stable PET data simultaneously with MRI are well established (2,12–14). The multifaceted approach to isolating the PET subsystem in the initial release of the time-of-flight (TOF)–capable SIGNA PET/MR system (GE Healthcare) was addressed in a previous design overview (12). To summarize the methods, temperature sensitivity of the silicon photomultiplier (SiPM) devices was addressed by designing the PET detector to minimize eddy currents, coupling a cold plate to the PET detector electronics, and using liquid cooling at 18°C. To account for residual SiPM temperature changes, thermistor-based temperature compensation was used (15). Additionally, electrical isolation and RF shielding were used to minimize effects of RF pulsing.
The National Electrical Manufacturers Association (NEMA) NU 2-2012 standard (16) performance measurements of the SIGNA PET/MR were previously published (6); these demonstrated sufficient isolation of the PET subsystem for typical clinical applications. The measurements were made under the MR-idle and simultaneously MR-pulsing conditions, using a 2-point Dixon pulse sequence for all simultaneous measurements. Small but measurable discrepancies between the PET performance with MR-idle and simultaneous scanning were observed in that study. Sensitivity measurements declined on mean by 2% with simultaneous pulsing, primarily attributable to residual RF interference causing occasional random triggering of the detector front end, resulting in a small additional dead time. This loss of counts also contributed to a slightly degraded noise equivalent count rate (NECR) curve under the MR-pulsing condition. Scatter fraction at peak NECR changed from 43.6% with MR idle to 42.5% with simultaneous scanning, primarily due to residual gain error. The image quality measurements demonstrated slightly higher contrast recovery with MR pulsing, likely due to a mismatch between scatter measurement and scatter correction as a result of the gain shift. The discussion section of the referenced publication noted that higher-power RF sequences would lead to higher levels of sensitivity loss.
In this new work, PET stability during simultaneous MR pulsing was investigated in more detail with recent system improvements. The hypothesis of this report was that these recent improvements in both hardware (cables) and software (gain control loop) of the system would result in improved stability of PET quantitation in the presence of aggressive MR sequences. To this end, stability measurements were performed with more challenging pulse sequences than previous PET/MR performance publications (6,14), including a gradient-intensive and an RF-intensive pulse sequence. The NEMA framework was relied on for a portion of the quantitative performance tests, but an emphasis was placed on stability comparisons and relative performance measurements under multiple MR conditions, rather than absolute performance measurements.
MATERIALS AND METHODS
All measurements were performed on the SIGNA PET/MR system. Several improvements affecting PET data quality have been implemented on the system since the previous performance measurements publication (6). The 2 most relevant improvements used for the measurements within our work addressed residual gain instability and RF leakage from MR pulsing.
Previously reported low levels of gain variation (6) have been further mitigated by implementing a real-time gain stabilization system (17). This method works in parallel with the earlier thermal control (15) and uses spectral analysis of the singles events to maintain highly stable and rapidly updating gain. As a closed-loop control system, real-time gain stabilization effectively accounts for varying thermal behavior between individual SiPM devices and various modes of detector heating and cooling, including transient behavior of different MR pulse sequences.
Previously reported RF-induced sensitivity decrease (6) has been addressed with a recent redesign of the PET detector power cables. In-line filtering was added before the power enters the cable enclosure, which reduced RF leakage below the level at which it can affect operation of the PET detector.
The same 2 MR pulse sequences were used for all tests, with the exception of the final sequence. A gradient recalled echo–echo planar imaging (GRE-EPI) sequence (3-s repetition time, 35-ms echo time, 90° flip angle, 64 × 64 matrix, 30 slices with 4-mm slice thickness, and 24-cm field of view), typically used for fMRI studies, was selected for its heat-inducing gradients. A fast recovery fast spin echo accelerated (FRFSE-XL) sequence (5,443-ms repetition time, 110-ms echo time, 142° refocusing flip angle, 19 echo train length, 320 × 320 matrix, 25 slices with 4-mm slice thickness, and 24-cm field of view) was selected for its high RF power.
For the following 4 sections, PET data were acquired for a total of 120 min. The acquisition time was divided into 4 MR states, summarized in Table 1, for which each MR sequence was repeated continuously for 30 min. This approach provided 3 transient temperature states and varying RF conditions.
MR Acquisition Approach for First 4 Tests
The following methods were used to determine the PET detector stability.
Quantitation Stability with 68Ge Uniform Phantom
A 68Ge uniform flood phantom (20-cm diameter, 27-cm axial extent, 45 MBq at scan time) was centered in the PET field of view and acquired for 120 min, with varying MR conditions as listed in Table 1. The raw PET data were divided into 120 bins of 1-min duration to create a system count rate curve, normalized by the mean of the first MR idle state (assumed to be the ground truth). Mean PET detector thermistor measurements were also extracted at 1-min intervals. Iterative TOF image reconstruction processing with full corrections (18) was performed on 24 bins of 5-min duration, and the scatter fraction from the scatter estimation was calculated. A registered CT scan was used for attenuation correction (19,20). Normalized image quantitation was calculated on the basis of the sum of the central 41 slices (the default number of nonoverlap slices for a whole-body study) and normalized by the first MR-idle state. Reconstruction processing was also performed on 30-min bins, and the central 11 slices were summed for high-statistics difference images.
Sensitivity Stability with 68Ge Source
A sensitivity stability test was performed to investigate relative PET sensitivity differences for the varying MR conditions. In the same manner as the NEMA standard (16), a flexible line source with 70-cm activity was placed within aluminum tubes (model PET/NEMA-SEN/P; Data Spectrum) and supported with fixtures located outside the PET axial field of view. The source was centered transaxially along the central axis of the scanner. In contrast to the NEMA standard, a 68Ge line source (6.6 MBq) was used to maintain an approximately constant activity rate. Acquisition was performed only with 2 aluminum tubes (to ensure no positron escape with the larger 68Ge positron range), enabling long acquisitions with each of the multiple MR conditions. Data were acquired for 120 min under multiple MR conditions, as shown in Table 1, and unlisted into 40 bins of 3-min duration. For each bin, a randoms estimate was subtracted from the total number of coincidences (as outlined by the NEMA test document). This randoms-corrected coincidence count was normalized by its mean over the first 30 min (MR idle) of acquisition to determine relative sensitivity over time.
Scatter Fraction Stability with 68Ge Source
Similarly, the test for scatter fraction stability was modified from the NEMA standard to use a 68Ge flexible line source (6.4 MBq). The line source was inserted into the PET scatter phantom (model PET/NEMA-SCT/P; Data Spectrum) and positioned per the NEMA standard. Acquisition was performed for 120 min with simultaneous pulsing according to Table 1. Data were binned into 5-min frames and processed according to the NEMA standard to determine count rates (trues, scatter, and randoms) and scatter fraction.
Image Quality Phantom with 18F
The NEMA image quality phantom (model PET/IEC-BODY/P; Data Spectrum) was filled with 37 MBq (at scan start time) of 18F solution in the background region, with an 8:1 activity concentration ratio for the 4 smallest spheres (10-, 13-, 17-, and 22-mm diameters). The 2 largest spheres (28 and 37 mm) were filled with nonradioactive water. PET data were acquired for 120 min while following the MR acquisition approach in Table 1. PET reconstruction processing was performed for the 30-min time bin corresponding to each MR condition. Because of the focus of this current work on functional imaging, reconstruction settings were based on the default clinical brain reconstruction protocol (8 iterations with 28 subsets of TOF ordered-subsets expectation maximization reconstruction, point-spread function compensation (21), 3-mm transaxial gaussian in full width at half maximum smoothing, and a standard [1 4 1]/6 z-axis convolutional filter). Contrast recovery and background variability were computed per the NEMA analysis procedure, using the region-of-interest (ROI) placement shown in Supplemental Figure 1 (supplemental materials are available at http://jnm.snmjournals.org). The NEMA-based background variability was calculated as the mean of the SD for each of the 12 background ROIs, divided by the background mean (presented as a percentage). For a large-diameter ROI, repeatability at the same position is good; this means that the SD of the measurements across the phantom are a measure of uniformity. In contrast, the small-diameter ROIs are primarily a measure of image noise.
To understand more fully the statistical limitations on the contrast recovery and background variability measurements, the data were additionally unlisted into 12 bins of 10-min duration each and processed to determine contrast recovery and background variability metrics.
Count Losses and Scatter Fraction with 18F Source
The NECR test was performed with the scatter phantom per the NEMA standard, with the specified 18F source to generate NECR and scatter fraction curves over a range of activity levels. The total scan duration was 12 h. The first 4 h comprised 7.5-min frames with a 2.5-min delay between frames, and the final 8 h comprised 30-min frames with 15-min delay between frames. To investigate system stability at high count rates, the PET frames for the first 4 h of acquisition were collected under varying MR conditions, providing comparison data for activity concentrations of approximately half of peak NECR and above. Each of these PET frames corresponded to a single continuously pulsing MR condition, rotating among MR idle, GRE-EPI pulsing, and FRFSE-XL pulsing. The MR state was changed during the 2.5-min delay between PET frames. PET-only acquisition was performed for the remaining 8 h of the test. Low count rate stability was addressed with a 68Ge source in a previous test. Analysis per the NEMA standard was performed to determine count rates (trues, scatter, randoms, noise equivalent) and scatter fraction. A count rate curve was generated by applying spline-based interpolation using only the NECR sample points from the PET frames acquired in the MR-idle condition, and the NECR sample points from simultaneous scanning were compared with this interpolated curve to determine absolute and percentage difference metrics.
Quantitation Stability with 68Ge Uniform Phantom and Spiral fMRI Sequence
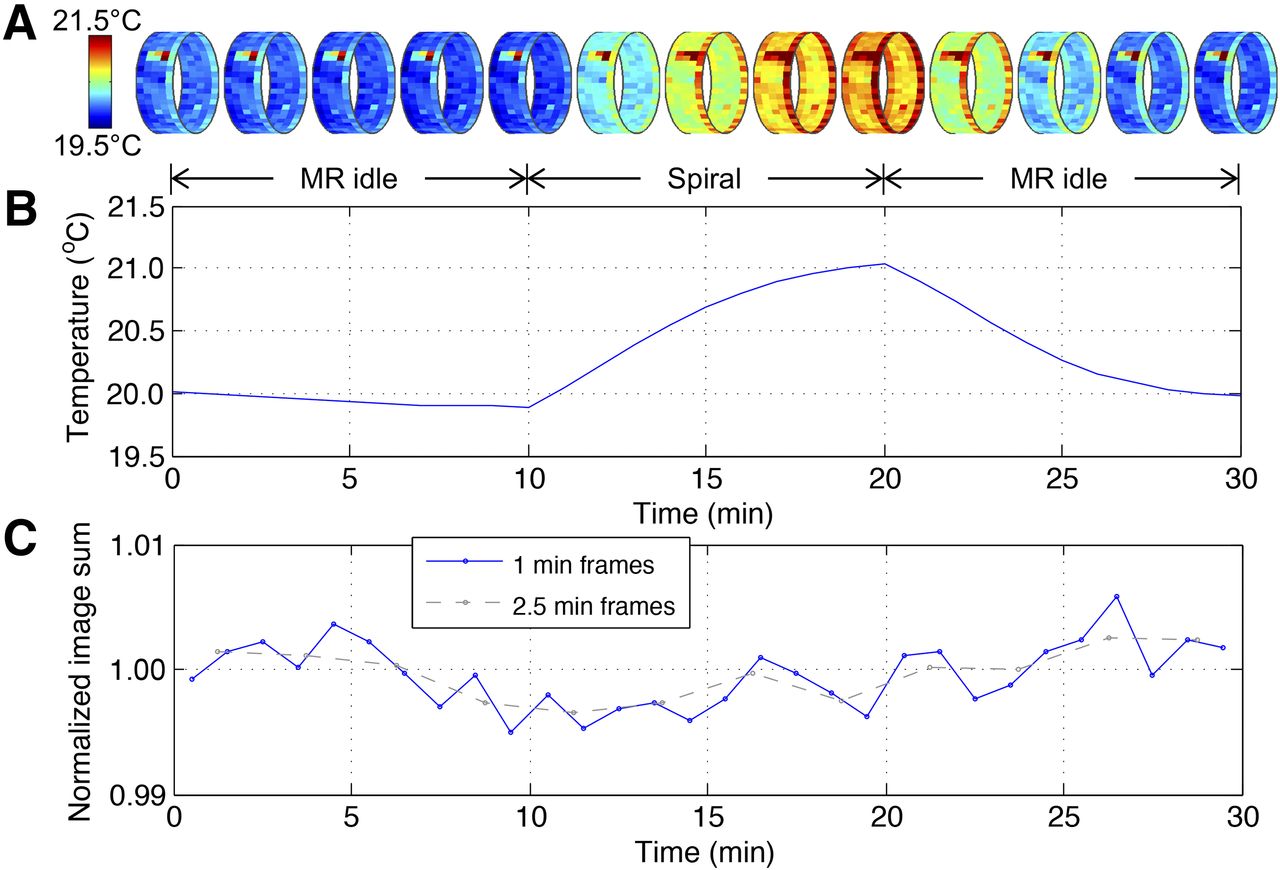
A final quantitation stability test was performed using an MR sequence with a high gradient heat-load. A spiral in-and-out GRE sequence (22) (repetition time, 2,400 ms; echo time, 30 ms; field of view, 24 cm; flip angle, 90°; matrix, 96 × 96; slices, 30; thickness, 5 mm; spacing, 0 mm; temporal phases, 150) was selected because of its aggressive gradients and ability to quickly heat the detector ring. A 68Ge uniform flood phantom (20-cm diameter, 27-cm axial extent, 40 MBq at scan time) was centered in the PET field of view. PET acquisition was performed continuously for 30 min with 3 MR phases: 10 min with MR idle, 10 min with continuous pulsing of the spiral GRE sequence, and 10 min with MR idle again. PET data were binned into 30 frames of 1-min duration each and additionally 12 frames of 2.5-min duration each (for reduced noise). Image reconstruction was performed with TOF ordered-subset expectation maximization with 2 iterations, 28 subsets, and full corrections. Quantitation stability for each dynamic image series was calculated on the basis of the sum of the central 71 slices (80% of the slices) to minimize statistical noise, and normalized by the mean of the first MR-idle state. Additionally, temperatures around the detector ring were recorded from thermistors on the PET detector ring during the scan.
RESULTS
Quantitation Stability with 68Ge Uniform Phantom
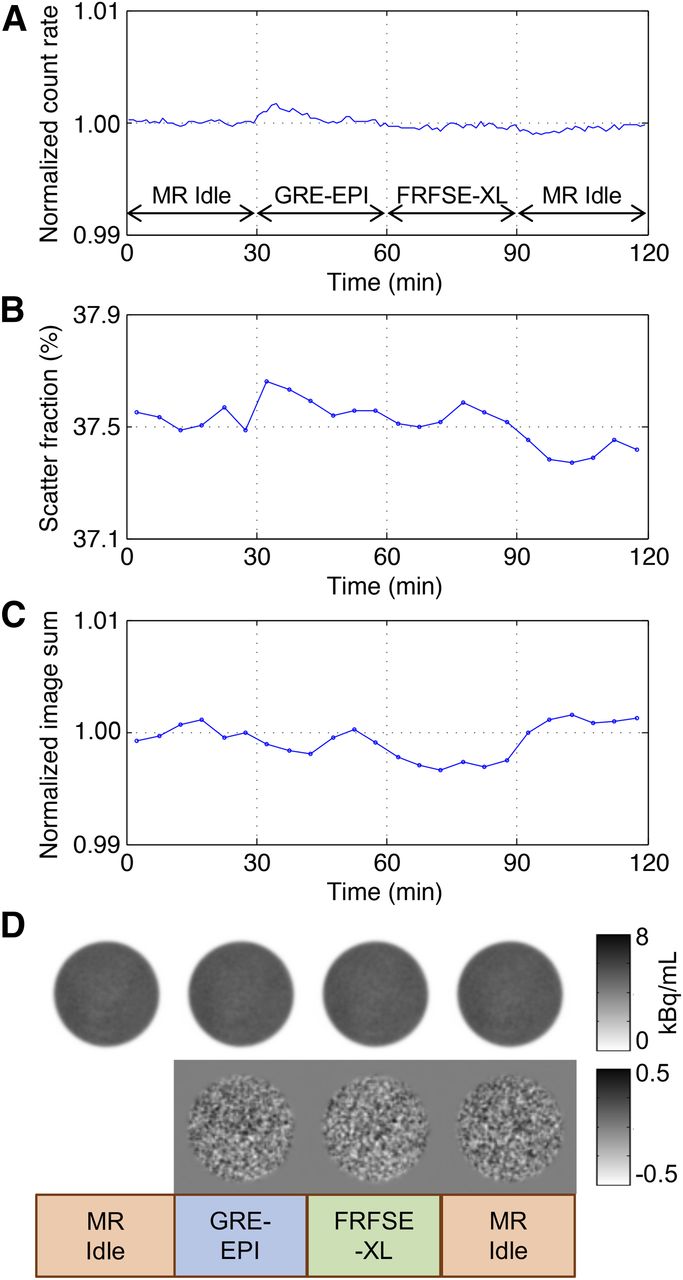
The mean detector temperature varied over the multiple MR states by 0.8°C, reaching its peak at the end of the gradient-intensive GRE-EPI sequence. A plot of detector temperature is shown in Supplemental Figure 2. For the 1-min bins, the normalized count rate was stable within 0.17% from the initial MR-idle baseline. The scatter fraction generated by reconstruction processing for all 5-min frames was stable within a narrow range of 37.4%–37.7%. Normalized image activity concentration demonstrated quantitation stability within 0.34% from the initial MR-idle baseline. Plots and difference images are shown in Figure 1.

Results of 68Ge uniform phantom test. (A) System count rate versus time, normalized by mean of first MR-idle state. (B) Scatter fraction versus time, as calculated by scatter-estimation algorithm used in image reconstruction. (C) Image quantitation stability check, calculated as sum of central 11 slices versus time and normalized by first MR-idle state. (D; top) Mean of central 5 slices for 30-min bins during each of the MR states. (D; bottom) Difference images compared with first MR-idle state demonstrate no structure or quantitative patterns.
Sensitivity Stability with 68Ge source
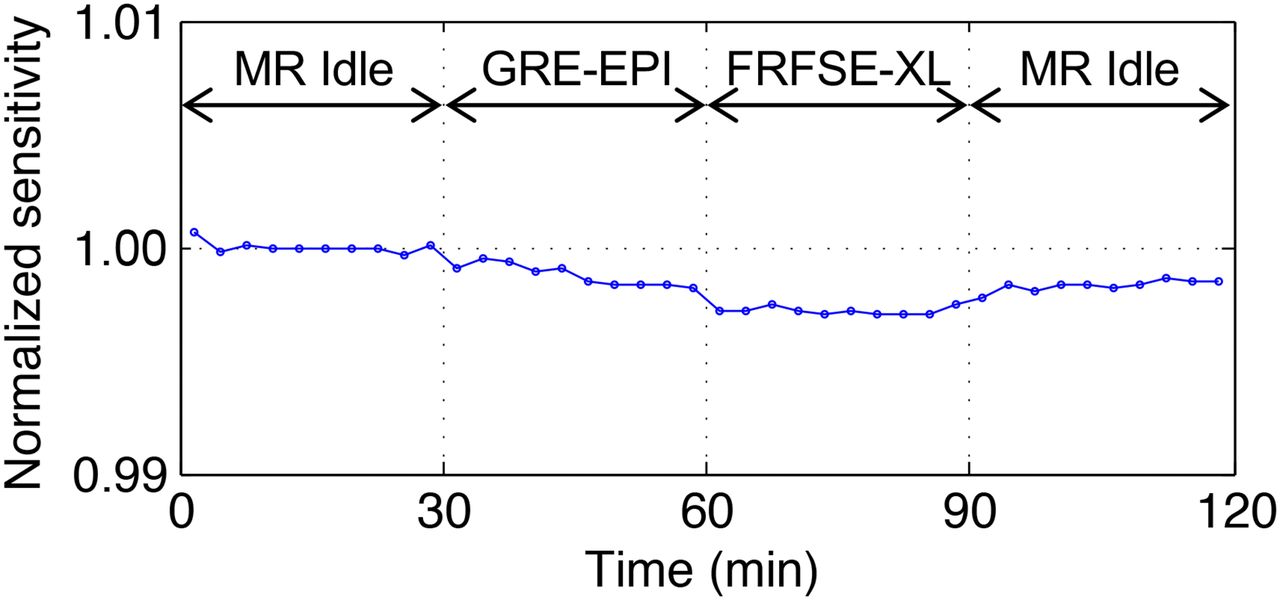
Normalized sensitivity versus time is shown in Figure 2. Sensitivity was stable over the scan duration within 0.3%, the maximum loss during the RF-intensive MR scanning.

Normalized PET sensitivity versus time for the 4 MR conditions.
Scatter Fraction Stability with 68Ge Source
The scatter fraction determined from NEMA-based processing was stable over all PET frames within the range of 40.4%–40.6%. Figure 3 shows the scatter fraction versus time.

Scatter fraction versus time for 68Ge scatter phantom using NEMA-based analysis.
Image Quality Phantom with 18F
A plot of contrast recovery versus sphere size for each MR state is shown in Figure 4A, demonstrating consistent results between the multiple MR states. Although the activity decayed during the full scan duration by approximately a half-life, contrast recovery is not significantly affected by this level of decay, allowing a reasonable comparison. The corresponding images are shown in Figure 4B for comparison, demonstrating visual similarity. The full set of contrast recovery and background variability results for both the 30-min binned images and the 10-min binned images are provided as Supplemental Table 1 and Supplemental Table 2, respectively.
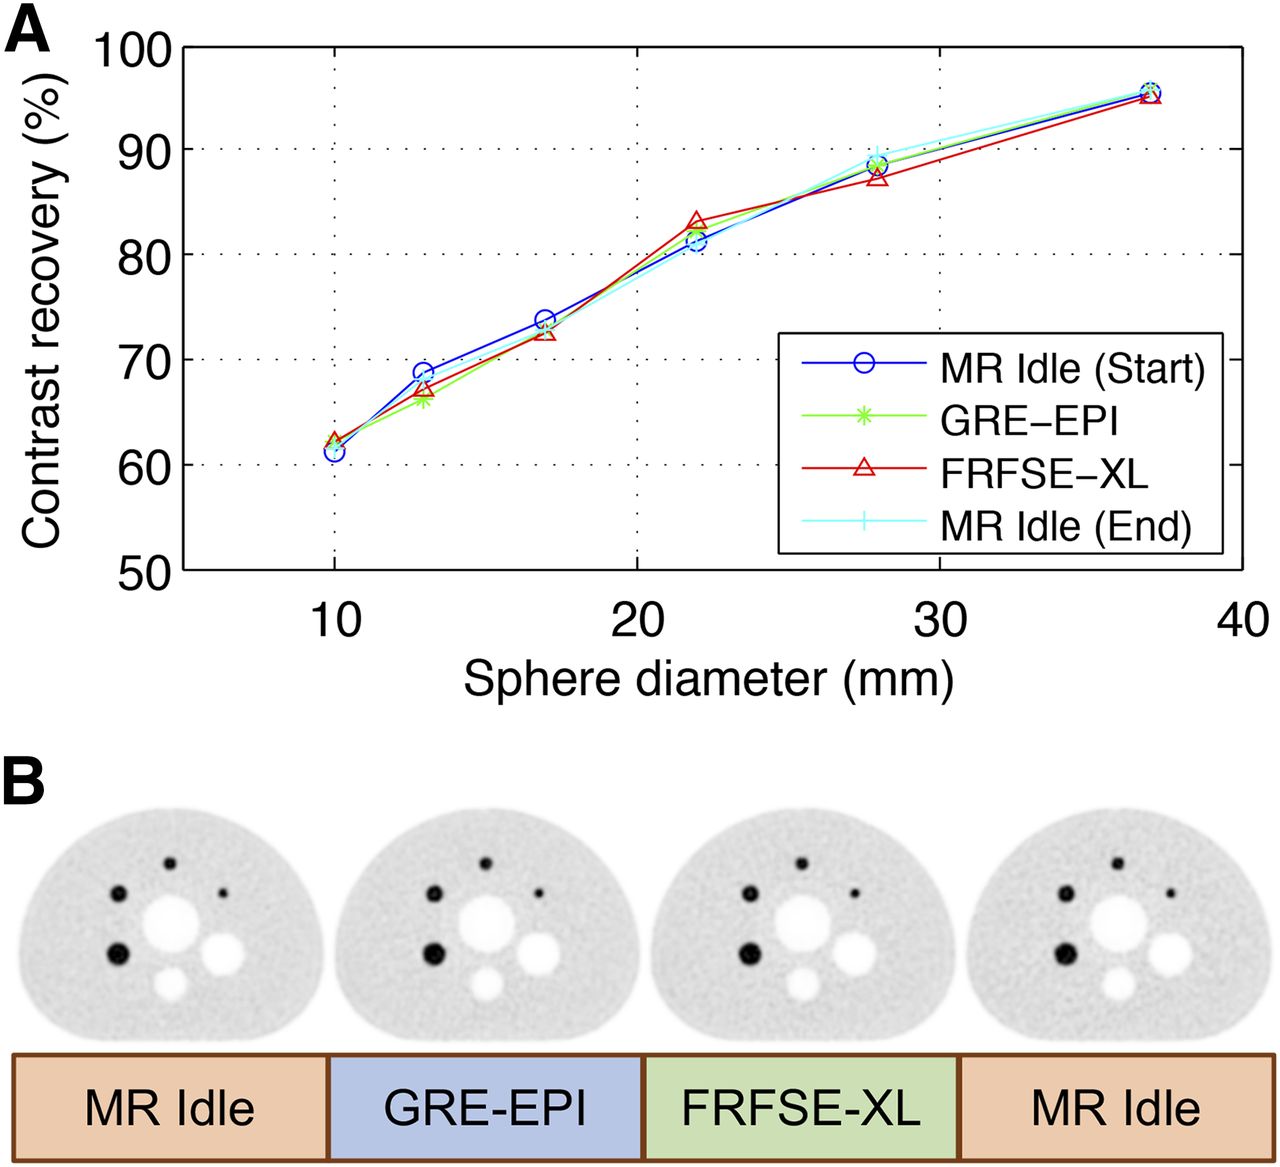
For each of the MR conditions: contrast recovery versus sphere diameter (A) and visual comparison of images (B).
The 37-mm background variability result was 1.7%, 1.6%, 1.7%, and 1.9% for the 4 30-min bins in order. This demonstrates comparable image uniformity for the PET images under the 4 MR states. To determine statistical significance, the measurements from the 10-min bins were processed with a 1-way ANOVA test on the 4 groups of 3 bins each. This showed a P value of 0.61, confirming that the difference in uniformity between the 4 segments was not statistically significant.
The 10-mm-diameter background variability result was 4.1%, 3.8%, 5.3%, and 4.7%. The 1-way ANOVA test once again determined that the variation observed was statistically insignificant (P = 0.11). Because of the influence of noise, the 18F decay most greatly affects the smaller-diameter background variability measurements.
Count Losses and Scatter Fraction with 18F Source
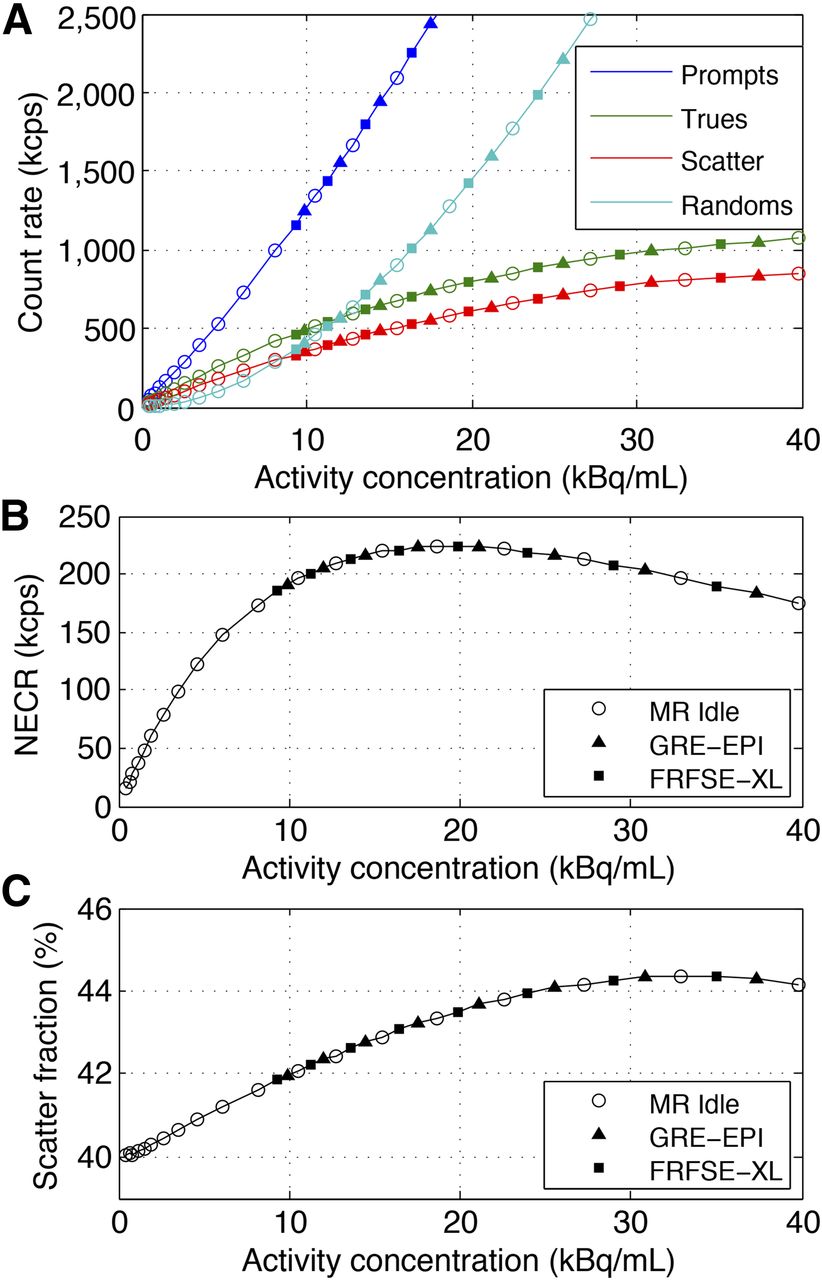
Peak NECR was 224 kcps at an effective activity concentration of 18.6 kBq/mL, and scatter fraction was 43.3% at peak NECR. Event rates, NECR, and scatter fraction plots are provided in Figure 5. Smooth curves were evident, demonstrating system stability for the multiple MR states.

Results of count losses and scatter fraction test, plotted against effective activity concentration. (A) Prompts, trues, scatter, and randoms count rate curves per NEMA analysis methods. (B) NECR curve. (C) Scatter fraction curve. For all subfigures, including A, PET frames collected with MR idle are represented by circle markers; triangles and squares represent PET frames acquired during continuous GRE-EPI and FRFSE-XL pulsing, respectively.
Supplemental Figure 3 zooms in near peak NECR, demonstrating minor performance variation between the MR states. The NECR and scatter fraction curves in this figure were formed with spline interpolation using only the MR-idle sample points. For each of the NECR sample points during MR activity, the absolute difference and percentage difference from the spline-interpolated curve are shown in Supplemental Table 3. The maximum difference over all of the sample points during MR activity was 0.31%.
Quantitation Stability with 68Ge Uniform Phantom and Spiral fMRI Sequence
Figure 6 presents detector temperature information and image quantitation normalized by the mean of the first MR-idle state. The spiral sequence heated the PET detectors on average by 1.1°C during the 10 min of pulsing. Image quantitation stability was demonstrated within 0.35% based on the 2.5-min frames.

Results from spiral fMRI test. (A) Three-dimensional PET detector temperature maps at 2.5-min sampling interval. (B) Mean detector temperature as function of time. (C) Image quantitation stability plots for 1- and 2.5-min frame durations, normalized by first MR-idle state.
DISCUSSION
The sensitivity stability test was designed to reveal count losses due to RF leakage. The phantom setup minimized scatter, leading to a narrow singles energy spectrum centered about 511 keV. Therefore, there were few detected events at the lower and upper energy thresholds, and gain shift (if it would have occurred) would not have significantly affected results. Sensitivity was preserved within 0.3%, even with the RF-intensive FRFSE-XL sequence. This result demonstrated considerable RF immunity improvement with the updated cables, as compared with a 2% sensitivity loss previously reported (6) with a less intensive MR sequence.
Gain stability was effectively investigated with the 68Ge scatter fraction stability test and the scatter fraction component of the 18F NECR test. The scatter phantom created considerable contributions to the energy spectrum at the lower energy threshold. A shift in gain would have been equivalent to a shift in the lower level discriminator, and this would have affected the amount of scatter admitted into the energy acceptance window. Therefore, these tests would have revealed gain instability through changes in scatter fraction. Scatter fraction measured with the 68Ge source in the scatter phantom was stable in a narrow range of 40.4%–40.6%. The scatter fraction curve from the 18F-based NECR test was smooth across varying MR states, demonstrating stable gain. Although scatter fraction generally increased with increasing activity concentration, this phenomenon was a product of low-energy event pile-up, rather than gain variation.
PET data consistency during simultaneous MR pulsing across a wide range of count rates was demonstrated through the NECR test. The trues, scatter, and randoms count rate curves and the NECR curve were smooth across the varying MR states.
Image analysis from the NEMA image quality phantom demonstrated consistent contrast recovery and image uniformity (from the 37-mm background variability metric) across the multiple MR states.
Quantitative tests examined multiple components of data consistency between the various MR states. Count loss due to RF leakage would have affected quantitation (unless perfectly addressed through dead-time correction). Unstable gain would have led to a varying number of scattered events accepted at the lower energy window, leading to errors in the scatter-correction algorithm. Because of the low-frequency spatial distribution of scatter, variation in scatter estimation would have affected quantitation throughout the image. The 68Ge flood phantom test demonstrated quantitative stability within 0.34%.
The final test was performed with a spiral fMRI sequence, the most heat-producing MR sequence known to the authors. The sequence rapidly increased the PET detector temperature by 1.1°C within 10 min. This test revealed quantitative stability within a narrow range, with a maximum error of 0.35%.
The results of this manuscript complement a previous study of MR performance before and after PET detector insertion (23) to demonstrate PET and MR subsystem isolation for even challenging PET/MR applications such as kinetic modeling.
CONCLUSION
PET detection and quantitation stability tests were performed with aggressive simultaneous MR pulse sequences, including an RF-intensive sequence and gradient-intensive sequences. The results demonstrated PET imaging stability within small error ranges. PET image quantitation stability was demonstrated even during simultaneous pulsing of fMRI sequences that deposit significant heat in the PET detector, enabling research applications such as neurologic kinetic modeling.
DISCLOSURE
Timothy Deller, Mohammad Mehdi Khalighi, and Floris Jansen are employees of GE Healthcare. No other potential conflict of interest relevant to this article was reported.
Acknowledgments
We thank Chad Bobb for his support in selecting clinical MR sequences and data collection, and we thank Mark Feilen and Mark Fries for their support in data collection. We thank Kristen Wangerin for her critical and useful suggestions to the manuscript text. In addition, we thank Gaspar Delso and David Goldhaber for helpful discussions.
Footnotes
Published online Jul. 26, 2017.
- © 2018 by the Society of Nuclear Medicine and Molecular Imaging.
REFERENCES
- Received for publication May 15, 2017.
- Accepted for publication July 5, 2017.


