


Abstract
Combined PET and MR imaging (PET/MR imaging) has progressed tremendously in recent years. The focus of current research has shifted from technologic challenges to the application of this new multimodal imaging technology in the areas of oncology, cardiology, neurology, and infectious diseases. This article reviews studies in preclinical and clinical translation. The common theme of these initial results is the complementary nature of combined PET/MR imaging that often provides additional insights into biologic systems that were not clearly feasible with just one modality alone. However, in vivo findings require ex vivo validation. Combined PET/MR imaging also triggers a multitude of new developments in image analysis that are aimed at merging and using multimodal information that ranges from better tumor characterization to analysis of metabolic brain networks. The combination of connectomics information that maps brain networks derived from multiparametric MR data with metabolic information from PET can even lead to the formation of a new research field that we would call cometomics that would map functional and metabolic brain networks. These new methodologic developments also call for more multidisciplinarity in the field of molecular imaging, in which close interaction and training among clinicians and a variety of scientists is needed.
Molecular imaging of small animals for biomedical research is an emerging field (1). It penetrates successfully into areas that are historically dominated by ex vivo molecular biology methods and therefore bears an enormous potential. Exploiting the full range of options of noninvasive visualization and quantification of metabolism, disease-specific dysfunction, therapy response, and cell trafficking requires that specific biomarkers yield information about molecular and functional processes as well as morphologic details. Single-modality imaging, such as stand-alone PET, SPECT, MR imaging, CT, or ultrasound, is often unable to provide the desired comprehensive information. Dedicated small-animal PET/CT and SPECT/CT scanners have been well received in the biomedical imaging sciences and have set the stage for a new combined imaging modality, PET/MR imaging, which has been introduced and successfully applied in biomedical studies (2,3). PET and MR imaging are both distinct modalities offering great versatility for advanced imaging applications in various fields of biomedicine. The combination of these two modalities into a single device merges functional and morphologic information from MR imaging with molecular PET data. The strength of PET lies in its high detection sensitivity and accurate quantification, but PET lacks good spatial resolution and tissue contrast. MR imaging, however, enables high-resolution imaging of morphology with good soft-tissue contrast, detects endogenous metabolite distributions using spectroscopy, and allows dynamic acquisition of tissue perfusion and additional functional parameters (4).
Thus, PET/MR imaging paves the way for noninvasive imaging to be used in a wide range of applications in biomedicine. First, in vivo preclinical and clinical studies impressively show the power of this new imaging device, which without doubt will cause a paradigm shift in the realm of imaging science (2,3,5–9).
This article provides a comprehensive overview of the potential and the challenges of PET/MR imaging in preclinical research and its translation into clinical practice.
PRECLINICAL PET/MR IMAGING IN ONCOLOGY
PET/MR imaging was first applied in oncology (5) and neurology (3,7,10). With the recent arrival of integrated human PET/MR imaging scanners, clinical scientists are establishing new protocols for imaging, pushing PET/MR imaging to the forefront of advanced nuclear medicine, radiologic diagnostics, and staging (11). Although many existing clinical PET/MR imaging systems are mainly being used as research devices, it is certain that these systems will migrate into routine oncologic settings. Many preclinical imaging sites around the world perform PET/MR imaging studies, but only a small number are simultaneous or from integrated systems. Until now, preclinical PET/MR imaging has mainly operated at a proof-of-concept level (2,12,13), but first studies showing the value of combined acquisitions have been published (7,9).
PET/MR Imaging in Preclinical Oncology
Despite considerable limitations, the Response Evaluation Criteria in Solid Tumors are still an applicable set of clinical guidelines for evaluating tumor response to therapy. Tumor volumes are best measured clinically using CT or MR imaging. In contrast, subcutaneous tumor xenografts are often quite accessible for direct measurement using calipers. However, more translationally relevant orthotopic or metastatic cancer models require imaging for size and volume assessments (14).
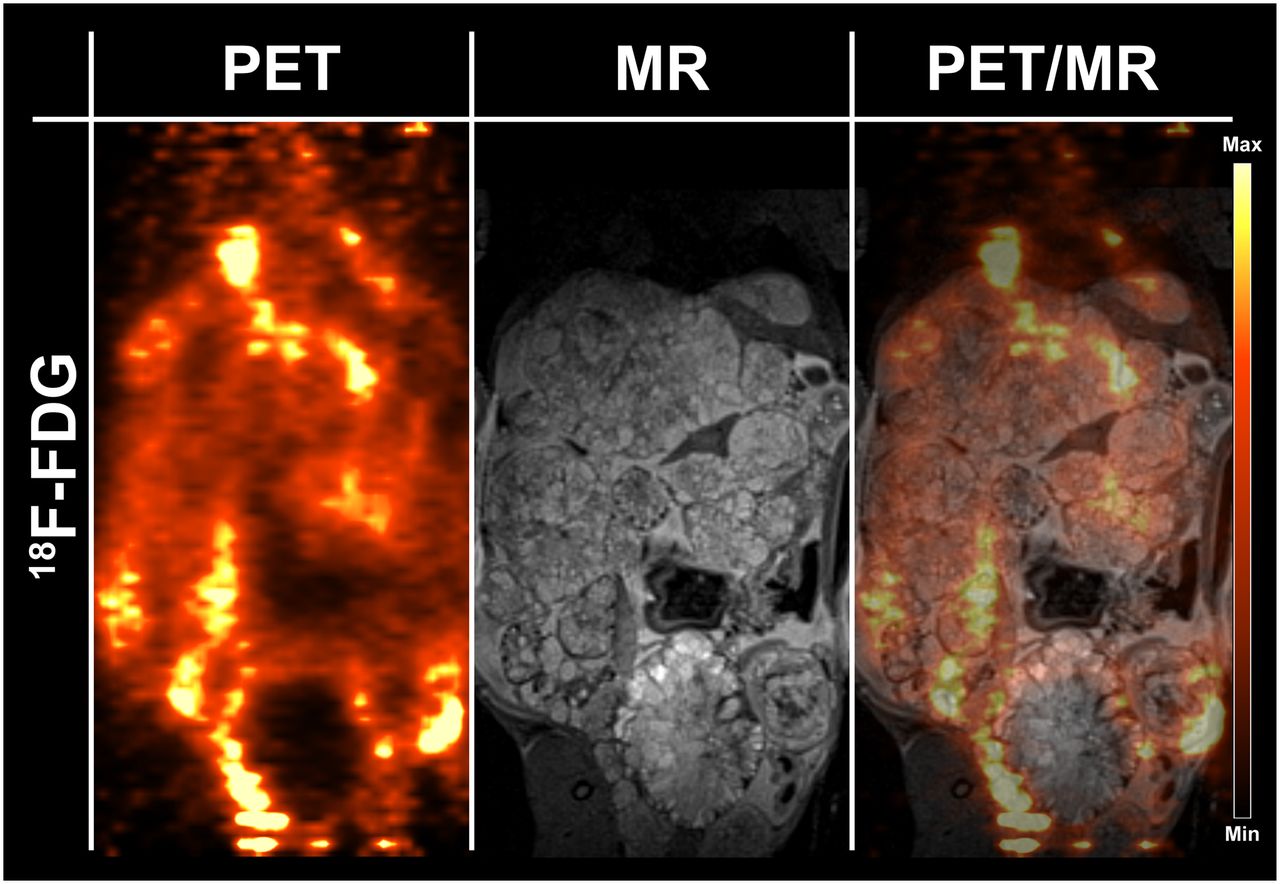
Zieker et al. (15) have shown that the excellent soft-tissue contrast of MR imaging permits the delineation of cancerous tissue within normal tissue; they emphasized the importance of such assessments for the quantification of PET tracer uptake in a metastatic mouse model mimicking human gastric cancer. For instance, identifying the tumor component of anatomic masses is important to quantify 18F-FDG uptake in intestinal and hepatic lesions, where low lesion-to-background activity ratios are expected.
Furthermore, Braren et al. (16) have thoroughly illustrated how the inclusion of functional MR imaging techniques—specifically, measurements of water diffusion with apparent diffusion coefficient and dynamic contrast-enhanced imaging—aid in multivariate analysis. Using linear regression in their multiparametric imaging approach, those authors identified measured parameters that significantly correlated with the amount of viable tumor or fibrotic and inflammatory tissue in a rat model of hepatocellular carcinoma. That study illustrated that orthotopic tumor models resemble more closely human cancers that are composed of various tumor compartments surrounded by healthy tissue. Moreover, anatomic MR imaging registration was critically important to accurately analyze 18F-FDG tumor activity because liver background was a confounding factor after transarterial tumor embolization.
Wehrl et al. (9) used PET/MR imaging to compare 11C-choline uptake with MR spectroscopy chemical shift imaging of choline metabolism in a murine orthotopic glioma model. Imaging findings were validated by ex vivo immunohistology and also by ex vivo secondary ion mass spectrometry imaging. Different measurements revealed different aspects of the tumor, thus showing tumor heterogeneity. The anatomic information was required for precise tumor delineation, which was not possible by simple thresholding of functional or molecular information. The negative correlations between total choline, measured by MR spectroscopy chemical shift imaging, and 11C-choline uptake, assessed by PET, indicate a complex biologic interplay that may guide therapeutic interventions.
Mathematic Modeling in Oncology Using PET/MR Imaging
Quantitative PET parameters derived from compartmental model analysis may provide prognostic information and insights into tumor heterogeneity (17). However, deriving the arterial input function is difficult because of partial-volume effects, the lack of metabolite corrections, and motion artifacts. Recently, Poulin et al. (18) have suggested methods to adapt a gadolinium-based MR imaging contrast agent to estimate the 18F-FDG arterial input function. Thus, the strengths of each modality can be used synergistically to formulate a mathematic model. Deterministic models of tumor growth that use PET and MR imaging data as direct inputs to provide a model of tumor growth (19,20) have been proposed. Some authors (21) hypothesized that normalized apparent diffusion coefficient values derived from two or more independent tumor measurements can be used to establish tumor proliferation rates, considering that apparent diffusion coefficient is inversely proportional to tissue density, which has been shown to work reasonably well in clinical studies (22). Conversely, the metabolic flux of 3′-deoxy-3′-18F-fluorothymidine (18F-FLT), obtained from modeling dynamic 18F-FLT measurements (23), could be used to estimate the proliferation rate in a voxelwise manner.
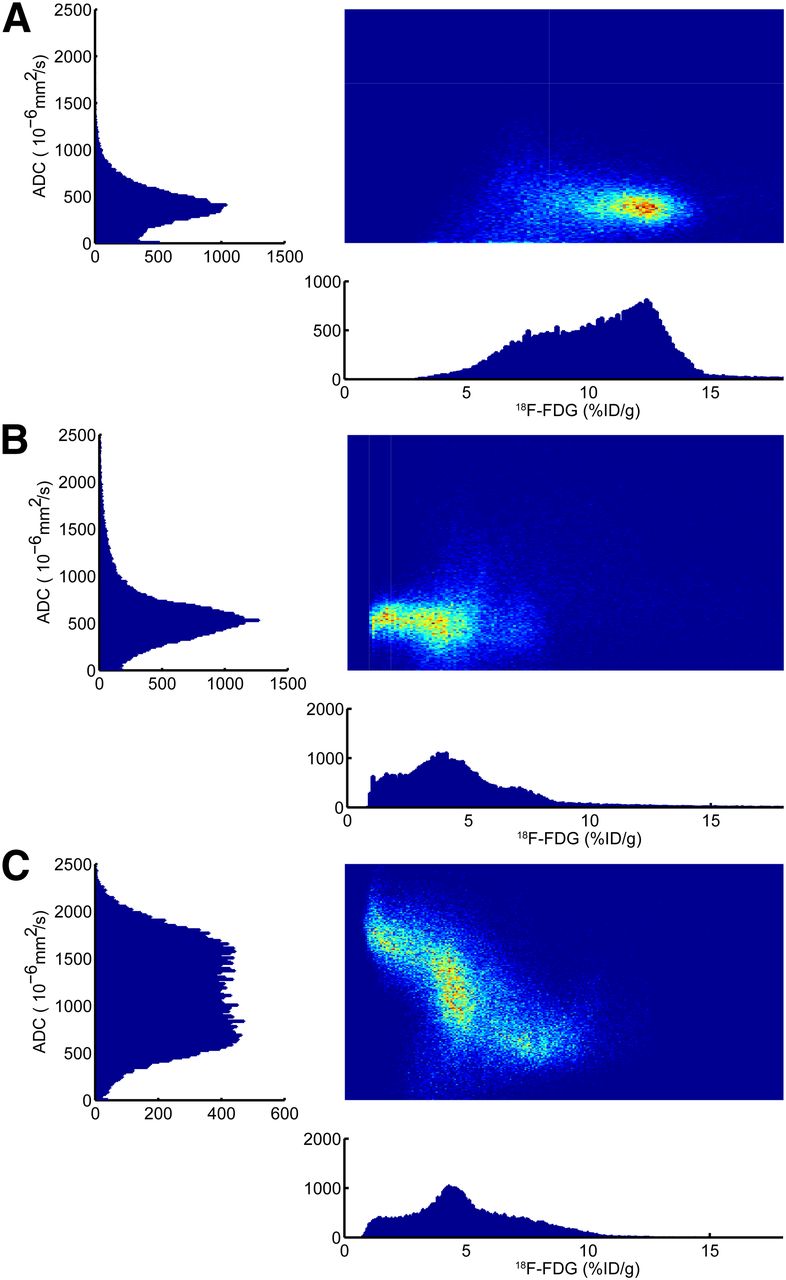
Figure 1 depicts a density scatterplot of combined apparent diffusion coefficient and 18F-FDG measurements and corresponding histograms. This figure illustrates the dynamic relationship of these parameters in a xenograft tumor model of non–small cell lung carcinoma. The temporal changes of these two parameters cannot be assessed simply by measuring their mean values. Increasing the number of parameters by incorporating dynamic contrast-enhanced MR imaging and oxygen saturation from blood oxygen level–dependent (BOLD) MR imaging measurements could lead to an improved ability to distinguish specific biologic tumor compartments, potentially leading to more-informed therapy decisions.

Density scatterplots with corresponding histograms of 18F-FDG on x-axes and apparent diffusion coefficient (ADC) on y-axes. This representation emphasizes the gain of information from simultaneous imaging compared with individual measurements. (A) Baseline measurement depicts relatively high 18F-FDG uptake compared with later measurements, and apparent diffusion coefficient is tightly centered at approximately 500 × 10−6 mm2/s, representing aggressive tumor with high cellular density. (B) After initiation of therapy, 18F-FDG signal decreases dramatically, reflecting metabolic breakdown of glucose consumption. Interestingly, average apparent diffusion coefficient value changes only slightly, reflecting that cellular density in tumor remains stable. By final, late measurement time point, the tumor is well differentiated, depicting areas of high cellularity with two populations of glucose metabolism and two areas of low cellularity with low and medium glucose uptake. %ID = percentage injected dose.
Taken together, these multiparametric studies are a significant step toward the use of PET/MR imaging as a tool for basic oncologic in vivo research with direct translational potential. To reveal the clinical relevance of these complex and complementary parameters, ex vivo validation studies using histology, proteomics, or metabolomics are required.
CARDIAC PET/MR IMAGING
Current State of Cardiac PET/MR Imaging
Preclinical PET/MR imaging hardware for small-animal studies has advanced (2–4,12,22,24–40). Although most preclinical PET/MR imaging systems are designed for imaging mice, there is significant interest in cardiac research using rats, especially the spontaneously hypertensive rat model of hypertensive left ventricle hypertrophy. However, technology development for rat imaging has been more challenging. To overcome these challenges, a novel imaging system has been designed at the University of Tuebingen (3,4,27,35). This system offers potential for further cardiac research in preclinical studies.
An early study (30) performed simultaneous 18F-FDG PET and MR imaging in mice and was able to differentiate between scar, border-zone, and normal tissue. More recently, postinfarction inflammation was studied in a mouse model of coronary ligation using 18F-FDG PET and gadolinium-DTPA–enhanced MR imaging (37). The gadolinium-enhancing infarcts showed high 18F-FDG uptake on day 5 after myocardial infarction, which was explained by a higher number of monocytes and macrophages in ischemic compared with noninjured tissue. In another study, gadolinium-DTPA–enhanced MR imaging and a PET study using 64Cu-labeled nanoparticles targeting macrophages were performed simultaneously (38). When imaging mice 3 d after myocardial infarction, delayed enhancement of gadolinium-DTPA delineated the infarcted myocardium, whereas PET images of the 64Cu-labeled nanoparticles delineated inflammatory cells. These studies suggest that PET/MR imaging can be used to differentiate between infarcted and inflammatory tissue in the setting of acute myocardial infarctions.
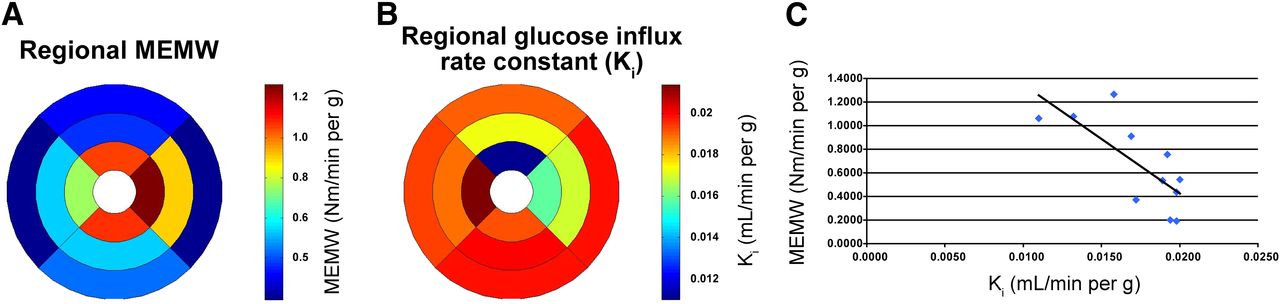
Recent work at the University of Tuebingen and the Lawrence Berkeley National Laboratory shows the usefulness of PET/MR technology for imaging cardiac efficiency ([cardiac tissue work]/[oxygen use]). Simultaneous dynamic 18F-FDG and tagged MR imaging for strain measurements were performed. That study showed a significant correlation between the 18F-FDG influx rate constant and cardiac work. Healthy Lewis rats were imaged using a 7-T small-animal MR imaging scanner with a PET insert that had been previously used in neurologic studies (3). The myocardial external minute work (MEMW) was determined by first obtaining an estimate of the myocardial end-systolic stress through the analysis of a subject-specific finite element model (41). These results were then combined with tagged MR strain analysis to obtain an estimate of the MEMW (Nm/min/g of tissue) (42). The PET images were reconstructed as a dynamic sequence of 3-dimensional images to obtain time–activity curves for blood input sampled from the left ventricular blood pool (∼40 mm3) and for the left ventricular myocardium (∼250 mm3). The time–activity curves were used to estimate the influx rate constants Ki for 18F-FDG using the Patlak graphical analysis approach (43). In implementing this method, the last 10 time frames (10–60 min) were used to determine Ki via linear regression. Figure 2 shows regional Ki values correlated with regional MEMW. Thus, simultaneous PET/MR imaging showed that cardiac work and the influx rate constant of glucose are inversely correlated. This finding suggests a metabolic switch from glucose to fatty acids as cardiac work increases.

(A) MEMW calculated using strain and stress calculations and displayed as polar plot. Units for MEMW are in Newton meters/minutes/gram of tissue. (B) 18F-FDG metabolic rate Ki, displayed as polar plot, using PET simultaneously with tagged MR imaging that was used for MEMW assessment. (C) Correlation of regional metabolic rate of 18F-FDG with MEMW. Regression analysis shows negative correlation (R = 0.75) between MEMW and influx constant for 18F-FDG, suggesting that metabolites other than glucose are preferred at rest. This correlation was significantly different from zero (P = 0.0322). Heart prefers substrates that maximize efficiency, such as fatty acids, which provide 38 kJ/g compared with 17 kJ/g for glucose. Figure shows strength of PET/MR imaging in cardiac imaging insofar as it combines mechanical information derived from high-resolution MR imaging with metabolic information derived from PET.
Benefits of Cardiac PET/MR Imaging
Animal models can be used to study various physiologic processes and their perturbations simultaneously. Longitudinal studies (44) in spontaneously hypertensive rats investigated the consequences of hypertensive hypertrophy on glucose and fatty acid metabolism, myocardial perfusion and innervation, and bone structure using postmortem micro-CT, diastolic and systolic function using finite element strain analysis, and fiber structure using postmortem diffusion tensor MR imaging. Using PET/MR imaging provides good spatial and temporal image coregistration. Performing studies simultaneously ascertains consistent physiologic states, reduces anesthesia times, and provides more reliable correlative results using all information available from both modalities. PET provides accurate measurements of perfusion, metabolism, inflammation, innervation, and ligand binding. MR imaging provides high-resolution structural data, soft-tissue contrast, and parameters of mechanical structure (e.g., deformation, strain, fiber structure, viability, and fibrosis).
Potential of PET/MR Imaging in Cardiology
PET/MR imaging has great potential for studying mechanisms underlying or associated with cardiac disease. One translational cardiac PET/MR imaging application is the study of left ventricular remodeling, especially in the border zone of infarcted myocardium, during the development of hypertensive hypertrophy or in the aging heart. Changes in structure, glucose and fatty acid metabolism, innervations, and tissue efficiency can be assessed. The decrease in contractile efficiency represents an imbalance between left ventricular performance and myocardial energy consumption and may signal early deterioration in cardiac function (42). The development of PET/MR imaging hardware and appropriate animal models are important for studying left ventricular remodeling and the impact of early therapeutic interventions.
PET/MR IMAGING IN NEUROLOGY
PET/MR Imaging in Basic Research and Clinical Differential Diagnosis of Neurodegenerative Disorders
Alzheimer disease accounts for most dementia cases worldwide (45,46). Emerging noninvasive imaging strategies include amyloid-targeting probes for PET, such as florbetaben (47), flutemetamol (48), and florbetapir (49) (recently accepted by the Food and Drug Administration) (50). Information from these tracers is now correlated with the well-studied amyloid ligand 11C-Pittsburgh compound B (11C-PiB) (51,52). However, volumetric MR imaging assessments of hippocampal volumes and measurements of cerebral glucose metabolism using 18F-FDG PET can also aid the diagnosis of Alzheimer disease. These measurements correlate with neuropsychologic markers of cognitive decline, such as mini-mental status examination scores (45).
Large multicenter trials are under way to assess the role of imaging and cerebrospinal fluid biomarkers as predictors for the rate of cognitive decline (Alzheimer’s Disease Neuroimaging Initiative) in conjunction with the Australian Imaging, Biomarkers & Lifestyle Flagship Study of Ageing, and the Dominantly Inherited Alzheimer Network (45,53,54). Villain et al. (53), in a voxel-based analysis of 11C-PiB uptake, showed a linear increase in amyloid deposition over time; in contrast, Bateman et al. (54) showed that cerebral amyloid deposition measured by 11C-PiB initially increased linearly after plaque burden stabilization toward a plateau. The sigmoidal progression of amyloid deposition had been proposed previously (55) and was recently refined (56). As an important observation (53–56), cerebral amyloid deposition starts decades before the manifestation of clinical symptoms, whereas changes in cerebral glucose metabolism appear to be altered in the later stage of Alzheimer disease. This finding highlights the importance of new, noninvasive neuroimaging approaches for the early diagnosis of Alzheimer disease. PET/MR imaging appears to be ideally suited to accomplish this task because it allows the simultaneous assessment of the amyloid burden, hippocampal atrophy, and changes in functional parameters, such as regional cerebral blood flow and blood oxygenation, by BOLD functional MR (fMR) imaging.
PET/MR Imaging as a Research Tool in Neurology
Animal research benefits from the combination of PET and MR imaging (4) because there is often a need for a cross-calibration of methods for functional imaging. For instance, arterial spin labeling MR imaging and 15O-H2O PET still lack cross-validation. The gold standard for the assessment of cerebral blood flow is 15O-H2O PET (57). The value of arterial spin labeling MR imaging is controversial (58). PET plays a key role in measuring the cerebral metabolic rate of oxygen using radioactive gases (59). However, because of the short half-life of 15O, the 15O technique requires an elaborate experimental setup with an on-site cyclotron. Moreover, the handling of radioactive gases requires special attention to reduce radiation exposure. Methods such as calibrated BOLD MR imaging, which applies different breathing gas paradigms to estimate the cerebral metabolic rate of oxygen, have been applied to small animals (60) and humans (61). However, a cross-calibration of both PET- and MR imaging–based cerebral metabolic rate of oxygen methods using simultaneous imaging has not been published (62). Measurements of oxygen metabolism are not limited to studies of the brain; they can also be applied to assess tumor oxygenation status, an important parameter for radiation therapy.
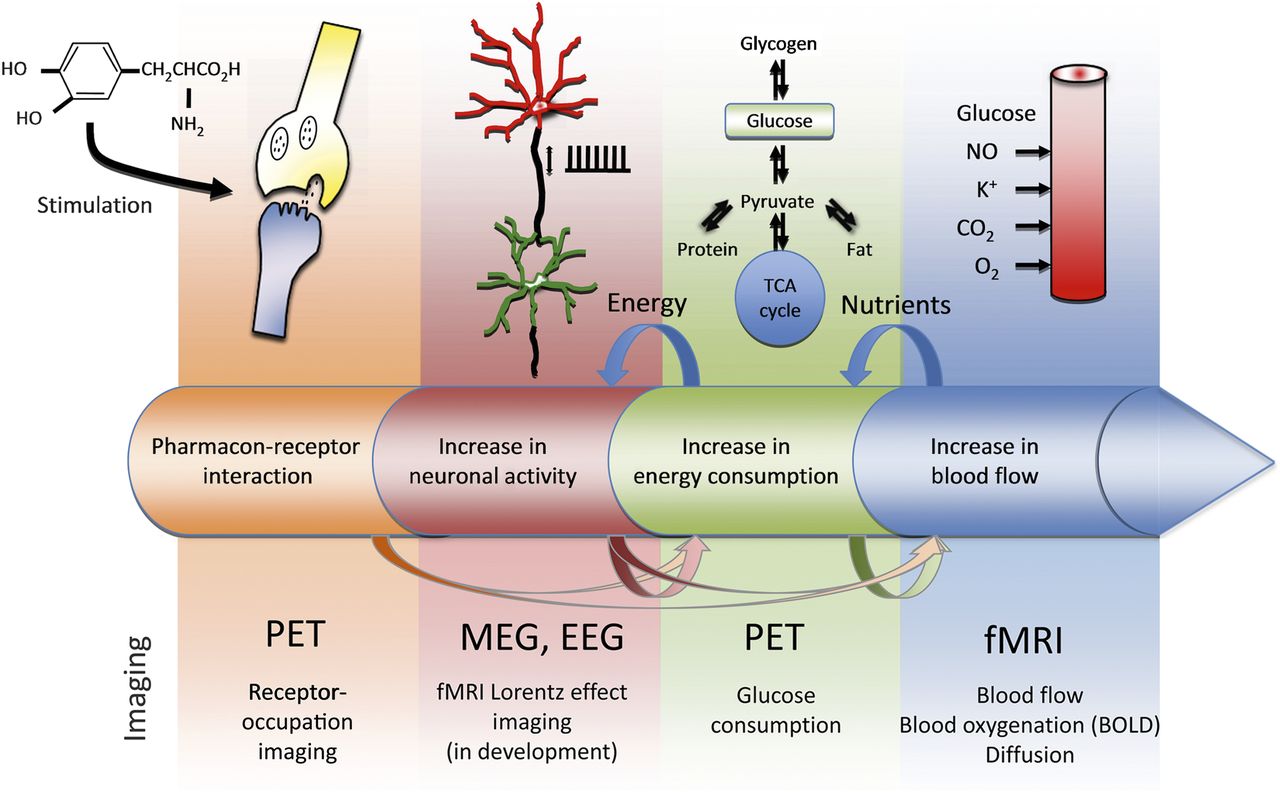
The future of PET/MR neuroimaging research also lies in monitoring different metabolic states (Fig. 3). Brain activation usually involves multiple events, including changes in receptor occupation that lead to changes in brain activity. These changes often cause an increased energy demand, which is met by an increase in glucose metabolism and, finally, an increased delivery of nutrients to the site of activity. PET and MR imaging methods are available to monitor multiple processes simultaneously. Sander et al. (7) used simultaneous PET/MR imaging in two rhesus macaques to study D2/D3 receptor occupancy using 11C-raclopride PET while simultaneously monitoring cerebral blood volume changes using MR imaging. The interplay between BOLD fMR imaging and 18F-FDG PET during whisker stimulation in rats was studied by Wehrl et al. (Fig. 4) (3). BOLD fMR imaging and glucose metabolic changes by PET were discordant in some brain regions. These findings suggest an uncoupling of oxygen from glucose metabolism that is detectable by simultaneous PET/MR imaging. A general mismatch between oxygen and glucose metabolism was previously observed using dedicated PET imaging studies (63). Future PET/MR imaging studies will help to elucidate these phenomena.

Metabolic cascade of brain function and available imaging technologies. In this example, pharmacologic stimulus triggers entire cascade of processes in brain. Pharmacoreceptor interaction, which can be monitored by PET, leads to increase in neuronal activity and spiking rates. This increase in neuronal activity is met by increase in energy consumption, which is domain of glucose PET. Finally, nutrients need to be delivered to site of activity, which leads not only to increases in blood flow and blood volume but also to changes in blood oxygenation and other parameters. Both fMR imaging and PET techniques exist to monitor these changes. As indicated by arrows, possibility exists for shortcuts and decoupling between metabolic steps. PET/MR imaging is excellent tool with which to monitor these multiple stages of metabolism simultaneously because it allows combination of high-sensitivity PET techniques and advanced MR methods, such as BOLD imaging. (Modified and reproduced with permission of (77).)

Simultaneous PET/MR imaging during whisker stimulation in small animals. Simultaneous BOLD fMR imaging and 18F-FDG PET depict activated areas in brain. Main activation focus, contralateral barrel field cortex (S1BF), is seen in both modalities, albeit with different statistical significance and spatial extents. However, 18F-FDG PET reveals additional activated areas, such as insular cortex (GI/DI) and amygdala (Amyg), which were not present in BOLD imaging. In some areas of brain, BOLD signal change may be too small or too slow to be picked up by fMR imaging. This figure shows complementary nature of PET/MR imaging in brain research. RSGB = retrosplenial granular cortex; Cg = cingulate cortex; M1 = primary motor cortex; S1ULp = primary somatosensory cortex, upper-lip region; CA = cornu ammonis areas (areas of the hippocampus); Tha = thalamus; CPu = caudate putamen; VPL = ventral posterolateral nucleus; VPM = ventral posteromedial nucleus; Ect = ectorhinal cortex; PRh = perirhinal cortex; Z = represents the anterior (positive) or posterior (negative) position of the displayed slice relative to the bregma. (Reprinted with permission of (3)).
A default mode of brain networks has been described on the basis of PET imaging data (64). Certain brain regions exhibit similarities in their resting state fluctuations (65). Resting state fMR imaging techniques are now used in a wide variety of applications ranging from normal aging (66) to Alzheimer disease (67). The term resting state should be replaced by functional connectivity (fc) because a resting state of the brain is difficult to define. Recent studies suggest that fc-PET provides information that is similar to that derived from fc-fMR imaging (3). This finding indicates that detailed information about functional and metabolic networks is coded in dynamic and static PET data. In support of this notion, human PET data suggest that similar networks can be observed using PET (68,69). The metabolic basis of the fc-fMR imaging signal is still under investigation (70); thus, the exact role of fc-PET imaging also needs further investigation. Nevertheless, it is appropriate to hypothesize that several dedicated PET tracers could depict and quantify metabolic and functional networks in the brain. At the current stage, even an exact name for this PET technique is not fully established, and discussions range from fc-PET and metabolic connectivity to covariant networks. The quantitative capabilities of PET imaging are another advantage over BOLD fMR imaging methods, which often suffer from a lack of clearly defined baseline signals (71). Here, simultaneous PET/MR imaging is a key tool for further investigation because it allows a comparison of the fc-PET networks with the derived fc-fMR imaging networks—for example, from BOLD or cerebral blood flow data. Ultimately, the usefulness of fc-PET needs to be proven, but its applications can possibly range from activation versus baseline studies in the normal brain to a dedicated assessment of brain diseases and their treatment responses. This combination of anatomy, diffusion, fc-fMR imaging, fc-PET, and dedicated analysis merges connectomics with metabolomics and will lead to a new research field that we will coin cometomics. Thus, PET/MR imaging also serves as the ideal tool for the validation of novel imaging strategies and biomarkers using simultaneous acquisitions (2,3,29).
PET/MR IMAGING IN INFECTIOUS DISEASES
Arguably, the major limit to the imaging of infectious microorganisms is the lack of availability of pathogen-specific markers. Most of the available radiopharmaceuticals detect nonspecific inflammation sites but do not accumulate in microorganisms. The clinical standard PET tracer 18F-FDG for imaging malignancies has proven valuable for the imaging of infectious diseases or their inflammation processes (72), but it is largely constrained to visualizing the accumulation of glucose-consuming immune cells with enhanced metabolic activity in inflamed tissues (73). In the field of preclinical imaging, an increasing number of biomarkers, including monoclonal antibodies or their fragments, peptides, and small molecules for infectious disease imaging, have started to emerge. With combined imaging techniques, parasite–host interactions can be monitored in vivo over time without the need for animal dissection or ex vivo methods.
In Figure 5, an Echinococcus multilocularis–infected Mongolian gerbil (Meriones unguiculatus) was imaged simultaneously with PET/MR imaging using 18F-FDG. The disadvantage of the PET tracer 18F-FDG, as previously discussed, is its nonspecific uptake in inflamed tissue surrounding the parasite. The parasite tissue itself is not detected by the glucose PET tracer, and small E. multilocularis lesions cannot be detected with 18F-FDG. In combination with the superior soft-tissue contrast of MR imaging and a potential specific biomarker for PET, simultaneous PET/MR imaging could serve as an emerging tool for unambiguously identifying and diagnosing alveolar echinococcosis disease and excluding it from other cystic liver diseases.
Simultaneous small-animal PET/MR imaging using 18F-FDG as PET tracer for detection of Echinococcus multilocularis in infected Mongolian gerbil. Images were acquired 1 h after injection of 10 MBq of 18F-FDG. Surrounding inflamed tissue is highlighted by the glucose PET tracer, but parasite tissue is not highlighted, depicting the need for disease-specific PET tracer.
The advantages of simultaneous PET/MR imaging in infectious diseases compared with PET/CT systems are also reviewed by Glaudemans et al. (74), highlighting the identical position of the patient in both modalities during acquisition, the functional information of MR imaging complementing the molecular information of PET, the outstanding localization of the PET signal in the soft tissue, and the absence of a radiation burden resulting from the MR imaging system.
TRANSLATION ASPECTS OF PET/MR IMAGING
With the introduction of combined PET/MR imaging scanners, first for head and neck imaging (75) and recently for whole-body imaging (76) in humans, PET/MR imaging has been successfully translated to clinical practice. Numerous applications have been proposed for the clinical use of PET/MR imaging, especially for oncologic but also for cardiac and central nervous system imaging. To date, clinical studies assessing the feasibility and diagnostic performance of simultaneous PET/MR imaging for specific clinical questions are still rare (11). This supplement includes separate articles on oncology, neurology, and cardiac studies using combined PET/MR imaging.
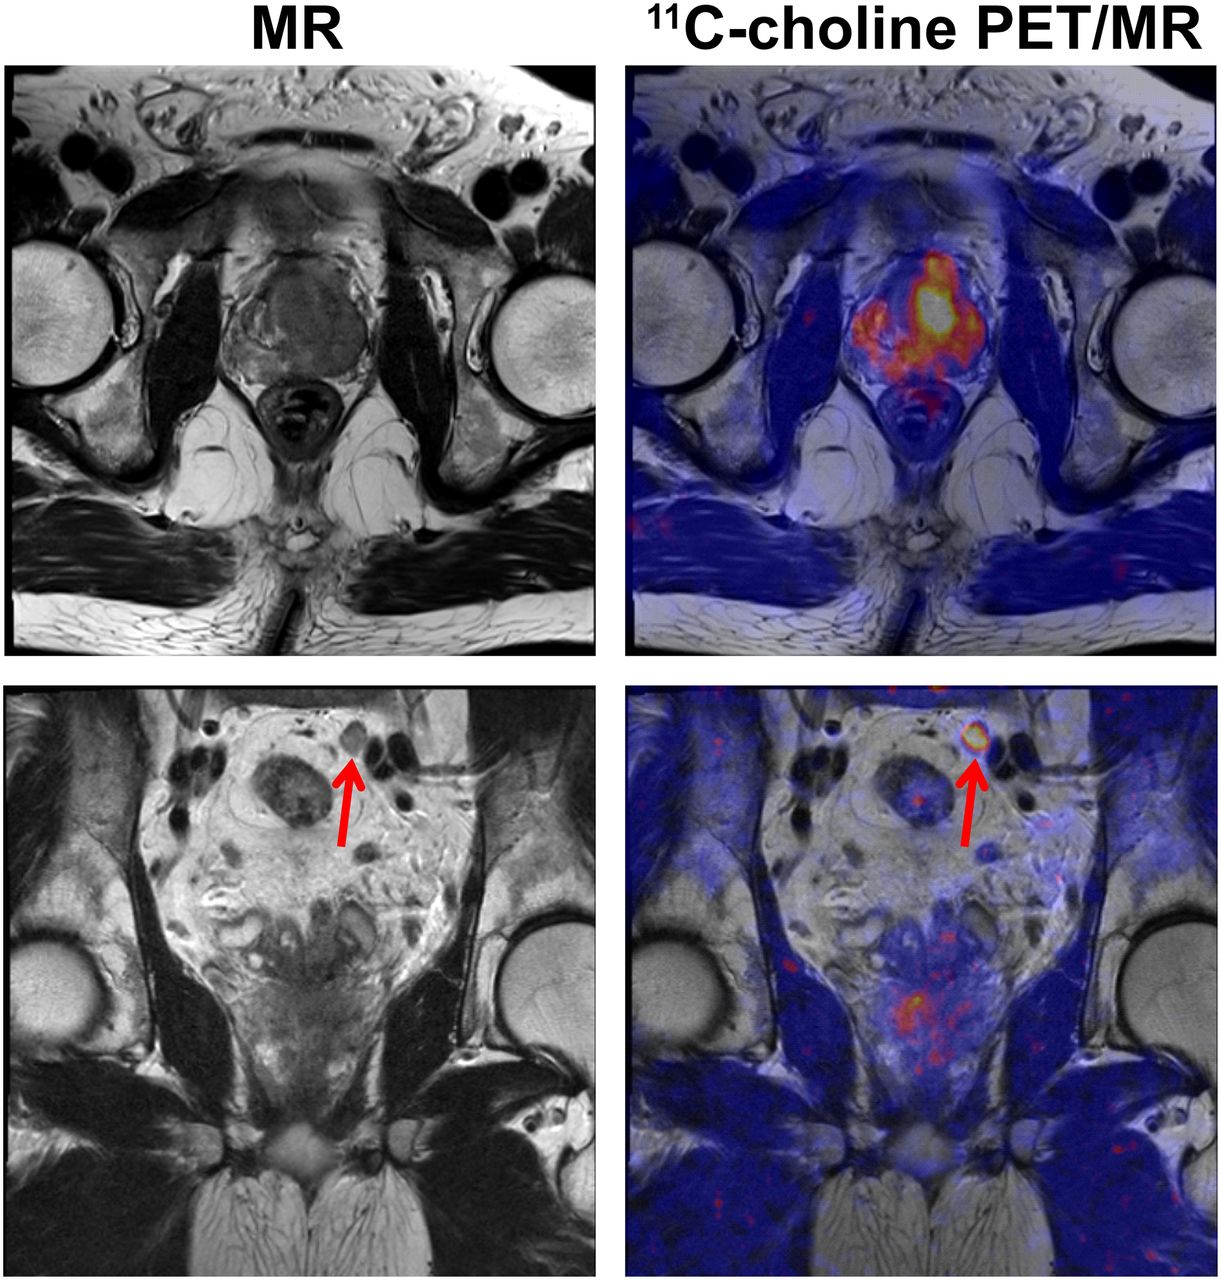
The largest field of clinical applications for combined PET/MR imaging is certainly oncologic imaging. Figure 6 shows how the high contrast resolution of MR imaging together with information from 11C-choline PET enables the assessment of local tumor stage as well as the detection of lymph node metastases.

58-y-old man with prostate cancer. 11C-choline PET/MR image shows primary cancer in prostate gland (upper row) as well as pelvic lymph node metastasis (bottom row, arrow). This example emphasizes value of PET/MR imaging in oncologic diagnostics because high-resolution MR imaging can be combined with specific PET tracers.
CONCLUSION
This article shows how PET/MR imaging has gained tremendous momentum in the areas of preclinical research and translational imaging. Currently, PET/MR imaging is likely the most strongly emerging research platform in imaging science, and over the next few years, it will show its potential for providing new options in clinical diagnosis. Preclinical studies in oncology, cardiology, neurology, and infectious diseases clearly point to the complementary nature of the PET and MR imaging modalities. More and more, PET/MR imaging studies use the functional imaging capabilities offered by both modalities instead of using the MR information as a mere anatomic landmark that is amended by functional information from PET. The translation of these preclinical research findings into clinical practice is still an ongoing process. Currently, most clinical examinations are still comparing PET/MR imaging results with PET/CT in terms of sensitivity and specificity in certain disease indications. However, the potential of PET/MR imaging is also on the verge of being unlocked through future studies that will use the potential of PET and MR imaging and also through the synergy arising from their combination. It is foreseeable that closer cooperation between nuclear medicine and radiology departments is needed in the future. Although this is already the practice in many small-animal laboratories, where PET and MR people work closely together to develop new methodologies, this process also needs to be translated into clinical practice. Combined curricula for the training of nuclear medicine and radiology scientists and clinicians will merely be a starting point. Therefore, the combination of PET and MR imaging into integrated hardware is only one of the challenges posed by this new modality; another challenge will be the close integration and cooperation between nuclear medicine and radiology that is needed to unravel the full potential of this new technology.
DISCLOSURE
This work was supported by grants from the German Research Foundation (DFG PI 771-1, DFG PI 771-3, DFG WI 3777/1-1), Germany Ministry for Education and Research (BMBF), Werner Siemens Foundation, Wilhelm Schuler Foundation, Tuebingen IZKF junior research group program (Functional and Metabolic Brain Imaging), EU grant FP 7 MATHIAS project, and the National Institutes of Health (R01 EB07219). No other potential conflict of interest relevant to this article was reported.
Acknowledgments
We appreciate the help of Andrew M. Hernandez from the Lawrence Berkeley National Laboratory, Berkeley, CA, and Alexander I. Veress from the Department of Mechanical Engineering, University of Washington, Seattle, WA, in processing the cardiac PET/MR imaging data.
Footnotes
Published online May 15, 2014.
- © 2014 by the Society of Nuclear Medicine and Molecular Imaging, Inc.
REFERENCES
- Received for publication March 19, 2014.
- Accepted for publication April 24, 2014.


Jump to section
Related Articles
Cited By...
- Imaging of red-shifted photons from bioluminescent tumours using fluorescence by unbound excitation from luminescence
- Impact of the Arterial Input Function Recording Method on Kinetic Parameters in Small-Animal PET
- Comparison of the Accuracy of FMT/CT and PET/MRI for the Assessment of Antibody Biodistribution in Squamous Cell Carcinoma Xenografts
- In Vivo Imaging of Tumor Metabolism and Acidosis by Combining PET and MRI-CEST pH Imaging
- ImmunoPET/MR imaging allows specific detection of Aspergillus fumigatus lung infection in vivo
- Alzheimer Disease: Approaches to Early Diagnosis and High-Accuracy Imaging
- Combined PET/MR: A Technology Becomes Mature
- Introduction