


Abstract
We evaluated the performance characteristics of the eXplore VISTA dual-ring small-animal PET scanner, a stationary, ring-type, depth-of-interaction (DOI) correcting system designed to simultaneously maximize sensitivity, resolution, and resolution uniformity over a field of view sufficient to image rodent-sized animals. Methods: We measured the intrinsic spatial resolution response of the VISTA detector modules, spatial and volume resolution throughout a representative portion of the field of view, and imaged several common resolution phantoms to provide a qualitative picture of resolution performance. We obtained an axial sensitivity profile and measured central point source sensitivity, scatter fractions and noise equivalent count (NEC) rates for rat- and mouse-sized objects using different energy windows, and count rate linearity. In addition, we measured the energy and timing resolution of both of the crystal layers (cerium-doped gadolinium orthosilicate and cerium-doped lutetium–yttrium orthosilicate) that give VISTA machines a DOI compensation capability. We examined the effectiveness of this DOI compensation by comparing spatial resolution measurements with and without the DOI correction enabled. Finally, several animal studies were included to illustrate system performance in the field. Results: Spatial and volume resolutions averaged approximately 1.4 mm and 2.9 mm3, respectively (with 3-dimensional Fourier rebinning and 2-dimensional filtered backprojection image reconstructions and an energy window of 250–700 keV), along the central axis of the scanner, and the spatial resolution was better than 1.7 mm and 2.1 mm at 1 and 2 cm off the central axis, respectively. Central point source sensitivity measured approximately 4% with peak NEC rates of 126.8 kcps at 455 kBq/mL and 77.1 kcps at 141 kBq/mL for mouse- and rat-sized uniform, cylindric phantoms, respectively. The radial spatial resolution at 2.8 cm off axis with DOI compensation was 2.5 mm but degraded (by 56%) to 3.9 mm without DOI compensation (as would be the case with a geometrically identical scanner without DOI correction capability). Conclusion: These results indicate that the VISTA small-animal PET scanner is well suited to imaging rodent-sized animals. The combination of high spatial resolution, resolution uniformity, sensitivity, and count rate performance, made possible in part by the novel use of phoswich detector modules, confers significant technical advantages over machines with similar geometry but without DOI correction capability.
Small-animal imaging technologies (1,2), including PET, are being used increasingly to study the consequences of therapeutic interventions in animal models of human disease, to provide proof of principle in the development of new imaging probes, thereby hastening drug development, and in a host of other applications (1,3,4). During the past several years, a number of dedicated commercial small-animal PET systems have become available (5–14). If such systems are to be used to greatest effect, their performance must be known, both for the purpose of protocol design and, secondarily, for comparison with other systems. Accordingly, this study was undertaken to evaluate the GE Healthcare eXplore VISTA small-animal PET scanner (dual-ring version). Because no published testing standards for small-animal PET scanners now exist, we synthesized for this study a testing protocol based in part on earlier literature articles reporting small-animal PET scanner performance (6,8,10–16).
MATERIALS AND METHODS
The eXplore VISTA dual-ring scanner (shortened to “VISTA” hereafter) is one of the latest commercially available small-animal PET scanners. The system, described in Table 1, was installed at the Johns Hopkins Medical Institutions in May 2005.
VISTA System
A notable feature of VISTA is its depth-of-interaction (DOI) or parallax-correcting capability, implemented by dual-scintillator phosphor sandwich (phoswich) detector modules (17–22). These modules comprise densely packed, square arrays of small-cross-section phoswich elements, each element created by optically joining together end to end two different scintillators. In VISTA, this crystal pair is cerium-doped lutetium–yttrium orthosilicate (LYSO) in the front crystal layer and cerium-doped gadolinium orthosilicate (GSO) in the rear layer. The GSO layer is optically coupled to a position-sensitive photomultiplier tube to create the VISTA detector module.
These phoswich elements play the role of the usual single scintillation crystal in other types of small-animal PET scanners. Scintillation light from a phoswich element, each optically isolated from its neighbors, decays with the characteristic light decay time (LYSO, 40 ns; GSO, 60 ns) of the scintillator in which the annihilation γ-ray from the target interacted. Thus, if the light decay time of the event can be determined for every event, then the interaction site can be assigned to one or the other phoswich scintillator, front or back. This knowledge, in turn, locates the interaction site to the center of either scintillator and provides a two-valued estimate of the (radial) DOI of the event. Knowledge of this depth, in turn, allows for partial compensation of the DOI effect (or parallax error) that progressively degrades radial spatial resolution with increasing radial position in all PET scanners with cylindric geometry. Thus, a DOI correcting system can use crystal elements of greater (combined) depth to improve sensitivity while at the same time suppressing resolution and resolution uniformity degradation with increasing radial position—effects that otherwise occur in machines with identical geometry but without this capability.
Here we describe the methods used to obtain the following data: intrinsic spatial resolution response of VISTA detector modules, spatial and volume resolutions, resolution phantom images, axial sensitivity profile, central point source sensitivity, scatter fractions for mouse- and rat-sized objects, noise equivalent count (NEC) rates, count rate linearity, energy and timing resolution of VISTA detector modules, accuracy of assignment of scintillation events to the correct scintillator of interaction, effectiveness of DOI compensation, and animal images.
Results were extracted from image sequences reconstructed by first applying the Fourier rebinning (FORE) algorithm to the (3-dimensional [3D]) data acquired by VISTA to produce sixty-one 2-dimensional (2D) sinograms (175 spatial locations × 128 angles) spanning the axial field of view. Unless otherwise noted, the FORE maximum ring difference (Dmax) was set to 16, the recommended (default) value for VISTA, and the span was set to 3. In most cases, the 2D FORE sinograms were reconstructed with the 2D filtered backprojection (FBP) algorithm using a ramp filter cutoff at the Nyquist frequency. Unless otherwise noted, no scatter or attenuation corrections were applied to these image data, and studies were performed with an energy window of 250–700 keV. Reconstructed pixel sizes were 0.3875 mm and 0.775 mm in the transverse and axial directions, respectively. The dimensions of the reconstructed images were 175 × 175 in each of the 61 transverse slices.
Intrinsic Spatial Resolution Response of VISTA Detector Modules
To quantify intrinsic spatial resolution, a 0.5-mm-diameter, 1.85-MBq (50-μCi) 22Na point source (Isotope Products Laboratories, Valencia, CA) was taped to the imaging bed and scanned along the central axis of the imaging aperture in small increments (0.5 mm), and data were collected at each step. During this process, coincidences were recorded from individual pairs of exactly opposed phoswich elements for a total of 13 such pairs (the axial width of one ring of VISTA detector modules). A plot of count rate versus point source position for each such pair yields 13 consecutive gaussianlike profiles. The average full width at half maximum (FWHM) of these profiles was taken to be the intrinsic spatial resolution of the VISTA detector module.
Spatial and Volume Resolutions
The 22Na source described previously was scanned in small increments along the entire axial field of view (4.8 cm) at two different radial offsets (r = 0 mm and off center at 10 mm) and in the radial direction at two fixed axial locations (slice 31, the central transverse slice, and slice 44, 10 mm away from the central slice in the axial direction). At each position, data were acquired for 30 s. The count rate profiles of the reconstructed point sources across the voxel having the maximum gray value were plotted in the radial, tangential, and axial directions, and the FWHM and full width at 10th maximum (FWTM) were determined as described elsewhere (23). The product of the three FWHM values was defined as the volume resolution at that source point.
Qualitative resolution performance in the transverse plane was evaluated with two hot and one cold rod resolution phantoms (Data Spectrum Corp., Hillsborough, NC), and resolution uniformity in the axial direction was evaluated with a micro-Defrise phantom (Data Spectrum Corp., Hillsborough, NC). The diameters of the resolution elements (hot or cold rods) in the microresolution phantoms ranged from 1.2 to 4.8 mm, with center-to-center distances twice these values. An ultradeluxe microresolution phantom, which has hot rods as small as 0.75 mm, was also imaged. The micro-Defrise phantom was imaged to qualitatively portray the axial resolution response of the system. The width of each active slab in this phantom, and the separation between slabs, is 4 mm.
All of these resolution phantoms were filled with a uniform fluid distribution of 18F with total activities of 7.4–11.1 MBq (200–300 μCi) at the start of imaging. Because the intent of these imaging studies was to portray the resolving power of the scanner independently of its sensitivity, imaging was performed for periods of up to 120 min to reduce statistical fluctuations in the resulting images. The data were reconstructed into images as previously described.
Axial Sensitivity Profile
A point source of 18F (1.11 MBq [30 μCi]) was created by drawing a small fluid column (<3 mm long) into the tip of a 1.1-mm (inside)-diameter capillary tube; taping this tube to the VISTA scanning bed perpendicular to, and on, the axis of the scanner; and imaging this source as the bed was stepped in small increments along the central axis. The prompt coincidence count rate from this low-activity source was measured for 30 s at each bed position and plotted as a function of axial position along the full axial field of view.
Absolute Central Point Source Sensitivity (ACS)
Because of the difficulty in creating a true physical “point” source of radioactive material, central point source sensitivity was estimated with an 18F-filled (2.96 MBq [80 μCi], 1.1-mm inner diameter, 1.5-mm outer diameter) glass capillary tube surrounded by a metal sleeve (0.4-mm wall thickness, copper), exactly centered along the scanner axis, and running the length of the entire axial field of view. It is not difficult to show that if the measured total coincidence count rate from the line is R and the amount of activity in the line within the axial field of view is A, then ACS is just 2R/A after correcting the measured count rate for random coincidences, system dead time, and the branching ratio of the radionuclide for positron emissions (0.97 in the case of 18F). With this apparatus in place, count rates from the line were determined for each of three different energy windows, 100–700, 250–700, and 400–700 keV.
Scatter Fractions
Two solid plastic cylindric phantoms conceptually similar to those defined by the National Electrical Manufacturers Association NU 2-2001 standard (23) were fabricated; one of the phantoms was approximately the size of a mouse, and one was approximately the size of a rat. The mouse phantom had a diameter of 3.2 cm and a length of 7.5 cm, and the rat phantom had a diameter of 5.7 cm and a length of 15 cm. Two parallel holes (1.5-mm diameter) were drilled through the length of each cylinder, with one hole on the cylinder axis and the other offset from the cylinder axis. The offset holes were located 11 mm off axis for the mouse phantom and 20 mm off axis for the rat phantom. Glass capillary tube line sources (1.1-mm inner diameter, 1.5-mm outer diameter) containing a uniform, 7-cm-long fluid column of 18F were inserted into the holes (at separate times) and centered along the axial length of each hole. Each cylinder was then centered in the transverse direction and in the axial direction such that the line source activity extended 1.1 cm beyond each end of the axial field of view of the scanner (4.8 cm). Image data were then collected for 20 minutes, and the line source was moved to the other hole and again imaged 20 minutes. The data were then sorted into 2D sinograms with the 3D FORE algorithm.
For the off-axis line sources, the sinograms were shifted in the transaxial direction for each angular view so that the peak of the line source was aligned with the center of the field of view. The sinogram dataset was then summed along both the length of the line source (61 slices) and the angular direction of the rebinned data (128 points), resulting in a 1-dimensional (175 × 1) count profile along the transaxial direction. This count profile was then fit with the sum of three functions, two gaussians and a constant offset. One of the gaussians was taken to represent unscattered events, and the other was taken to represent scattered events; the constant background was taken to represent true coincidence events arising from the radioactive decay of 176Lu, a naturally occurring, long-lived (30 × 109 y) β- and γ-emitting radioactive isotope of lutetium present (2.6% abundance) in the LYSO crystals of the scanner. True coincidence events occur when a γ-ray from a 176Lu decay in one detector module escapes that module and crosses the detector ring to be absorbed in an opposed detector module. This absorption, combined with trapping of the other coincident emissions from the same decay in the first module, produces an apparent true coincidence rate when no external sources are present, that is, a true background coincidence rate.
If T and S are the total counts under the unscattered and scattered gaussian distributions, respectively, then the final scatter fraction (SF) for each phantom can be calculated (based on A.2.4 (23)) as follows: where A is the average activity in the line source during the acquisition. The weighting factor K was calculated by separating the cylinder cross section into an outside annular region and an inside circular region defined by a circle with a radius equal to one half the radius of the mouse or the rat phantom, whichever was in use. As a result, each region would contain a line source and K would be equal to 3 (the area ratio between the outside annular and inside circular regions) for both phantoms.
NEC Rate and Count Rate Linearity
Hollow cylinders 3.2 cm in diameter × 7.5 cm long and 5.0 cm in diameter × 15.0 cm long were used to measure NEC rates for mouse- and rat-sized objects, respectively. Both phantoms were filled with a uniform solution of 18F, accurately measured in amount and concentration, such that the total amount of 18F activity exceeded the estimated upper count rate limit of the scanner by about a factor of two (∼37 MBq [1 mCi] for the mouse phantom and 74 MBq [2 mCi] for the rat phantom). On separate occasions, these phantoms were placed on the imaging bed and centered in the scanner field of view in both the axial and the transverse directions. A continuous sequence of 10-min data acquisitions was then initiated for 24 h. As the activity decayed over this period, the prompt coincidence rate and the random coincidence rate were recorded as a function of time.
These data served two purposes. First, combined with the scatter fraction measurements described in the previous section, NEC rates over the measured activity range for the mouse and rat phantoms were computed from the record of prompt and random coincidence rates according to the formula: where T is the true coincidence rate, P is the prompt coincidence rate, R is the random coincidence rate, SF is the scatter fraction, and k is the diameter of the phantom divided by the diameter of the effective field of view, that is, 0.47 for the mouse and 0.75 for the rat. The peak NEC rate and the activity concentration at which this rate occurred were then read from these curves for both phantoms. Note that the random coincidence rate is not measured as delayed coincidence (24–27) by VISTA but is instead computed from the measured singles rates on the two crystals that define the end points of each line of response and the known width of the coincidence timing window that applies to these two crystals (see section on timing resolution). That is, if r1 is the singles rate on crystal 1, r2 the singles rate on crystal 2, and τ the coincidence timing window width for that crystal pair, then the estimated random coincidence rate for that line of response at that moment is given by:
 and this amount is subtracted from the total coincidence rate recorded for that line at that time. This correction is similarly applied to all other lines of response.
Second, to establish the linear count rate range of the system, the mouse cylinder data were reconstructed into images automatically corrected by the system for random coincidences, system dead time, and radioactive decay. A time–activity curve spanning the full 24-h data collection period was then generated from a region of interest defined within the boundary of the phantom. After these corrections, such a curve should appear flat if the corrections are perfect but will depart from flatness if the corrections begin to fail. Accordingly, after the time axis was converted to the phantom activity concentration, this curve was inspected to establish the width of this flat (or linear response) concentration range.
Energy Resolution
A 16.7-MBq (450-μCi) 68Ge annulus (Isotope Products Laboratories, Valencia, CA, the VISTA radionuclide transmission imaging and calibration source) was used to obtain the energy spectra of each crystal in the detector array for both the front crystal layer (LYSO) and the back layer (GSO). After a 30-min acquisition with the annulus centered in the axial field of view, the energy resolution of each crystal was calculated as the FWHM of the 511-keV energy peak divided by the energy peak value expressed as a percentage. The average energy resolution and its variation for both the LYSO layer and the GSO layer were then calculated.
Timing Resolution
Event start and stop times were recorded for each event within a coarse 20-ns-wide coincidence timing window as a function of scintillator type when the scanner was being driven at a moderate prompt count rate, ∼200 k/s. These data were transformed into frequency distributions with a 0.25-ns bin width. The FWHM and the FWTM of all four possible coincidence combinations, that is, LYSO–LYSO, LYSO–GSO, GSO–GSO, and GSO–LYSO, were calculated from these distributions.
In addition, the ability to distinguish annihilation photon interactions in GSO from those in LYSO was determined by plotting event frequency as a function of estimated light decay time for each scintillation event, as determined by the delayed charge integration method (20). This distribution would be expected to contain two distinct, well-separated peaks, one for each scintillator, with a clear minimum between peaks. The location of this minimum occurs at a particular light decay time, tmin, and this time was used to discriminate between the two event types; if the measured light decay time of an event was less than tmin, the event was assigned to the “faster” scintillator in the phoswich element, LYSO, and if greater, the event was assigned to the “slower” scintillator in the phoswich element, GSO. These tmin times were determined and stored for each phoswich element in the system at the time of system calibration. Analysis of these distribution data and corresponding timing thresholds allowed the accuracy of event assignment to be determined. Accuracy was defined as the fraction of all events assigned to the correct scintillator.
Effectiveness of Parallax Compensation
In normal operation, VISTA locates the end point of a line of response to either the center of an LYSO crystal of interaction or the center of a GSO crystal of interaction, and this information is used during reconstruction with either of the reconstruction methods provided with the system (FBP or 2D ordered-subset expectation maximization [OSEM]). When this DOI information is used, it is expected that radial resolution will degrade more slowly with increasing radial source position than in a machine with identical geometry but without this capability.
To determine the effectiveness of this correction, the 22Na point source described earlier was moved incrementally off the axis of VISTA in the radial direction and imaged at each point. These image data were then reconstructed in two different ways: first, by assigning the end point of a line of response to the center of either the LYSO or the GSO crystal in which the event occurred (the normal parallax correction), and then again by assigning the end point of the same event to the center of the phoswich element in which the event occurred (a fixed DOI of 7.5 mm). A comparison of these methods allows the degree of parallax compensation to be estimated as a function of radial position.
Animal Imaging Studies
Mouse images are presented to illustrate and compare image quality in studies with high (18F-fluoride) and low (18F-FDG) biologic contrast when statistical fluctuations are minimal. These data were reconstructed with the standard VISTA algorithms (FBP and 2D OSEM) and with a 3D OSEM algorithm tailored to the VISTA scanner (available as an option). These whole-body studies were performed using two bed positions (step and shoot). The data from different bed positions were automatically “stitched” together by VISTA software after reconstruction. In addition, a dynamic mouse study is presented that illustrates use of the system under more typical experimental conditions where quantification is required by the experimental paradigm.
RESULTS
Intrinsic Spatial Resolution of VISTA Detector Modules
The average FWHM of the 13 gaussianlike profiles obtained by scanning a point source past 13 pairs of opposed phoswich elements in time coincidence was 1.26 mm.
Spatial and Volume Resolutions
Radial, tangential, and axial resolutions (FWHM and FWTM) are plotted in Figure 1 as a function of radial position in the central transverse slice of VISTA (Fig. 1A, slice 31) and 1 cm away from slice 31 in the axial direction (Fig. 1B, slice 44). Spatial resolution within the central 4-cm diameter of the field of view was better than 2.1 mm in all directions (FWHM) and better than 1.7 mm in the central 2-cm-diameter field of view.

Variation of spatial resolution in radial (A and B) and axial (C and D) directions. Radial spatial resolution variation is measured in center transverse slice 31 in A and in off-center transverse slice 44 in B, 1 cm away from center slice in axial direction. Axial spatial resolution variation is measured in central axial slice (r = 0 cm) in C and in axial slice 1 cm off axis (r = 1.0 cm) in D.
The three resolution measures are plotted against position along the scanner axis and 1 cm off the central axis in Figures 1C and 1D, respectively. Resolution averaged approximately 1.4 mm when the source was on the scanner axis and approximately 1.6 mm when the source was 1 cm off the scanner axis.
Volume resolution, the product of the radial, tangential, and axial resolutions at a given point, was better than 7.0 mm3 within the central 4-cm-diameter transverse field of view and better than 3.0 mm3 at the center. Volume resolution varied with axial position between approximately 2.9 mm3 (on the scanner axis) and 4.7 mm3 (1 cm off the scanner axis).
Cold-rod and hot-rod microresolution phantoms (rod pitch = 2 × rod diameter) are shown in Figures 2A and 2B. The 1.6-mm hot rods are resolved at the FWHM level in Figure 2B, and the 1.2-mm rods are detectable as separate but were not (quite) resolved at the FWHM level.
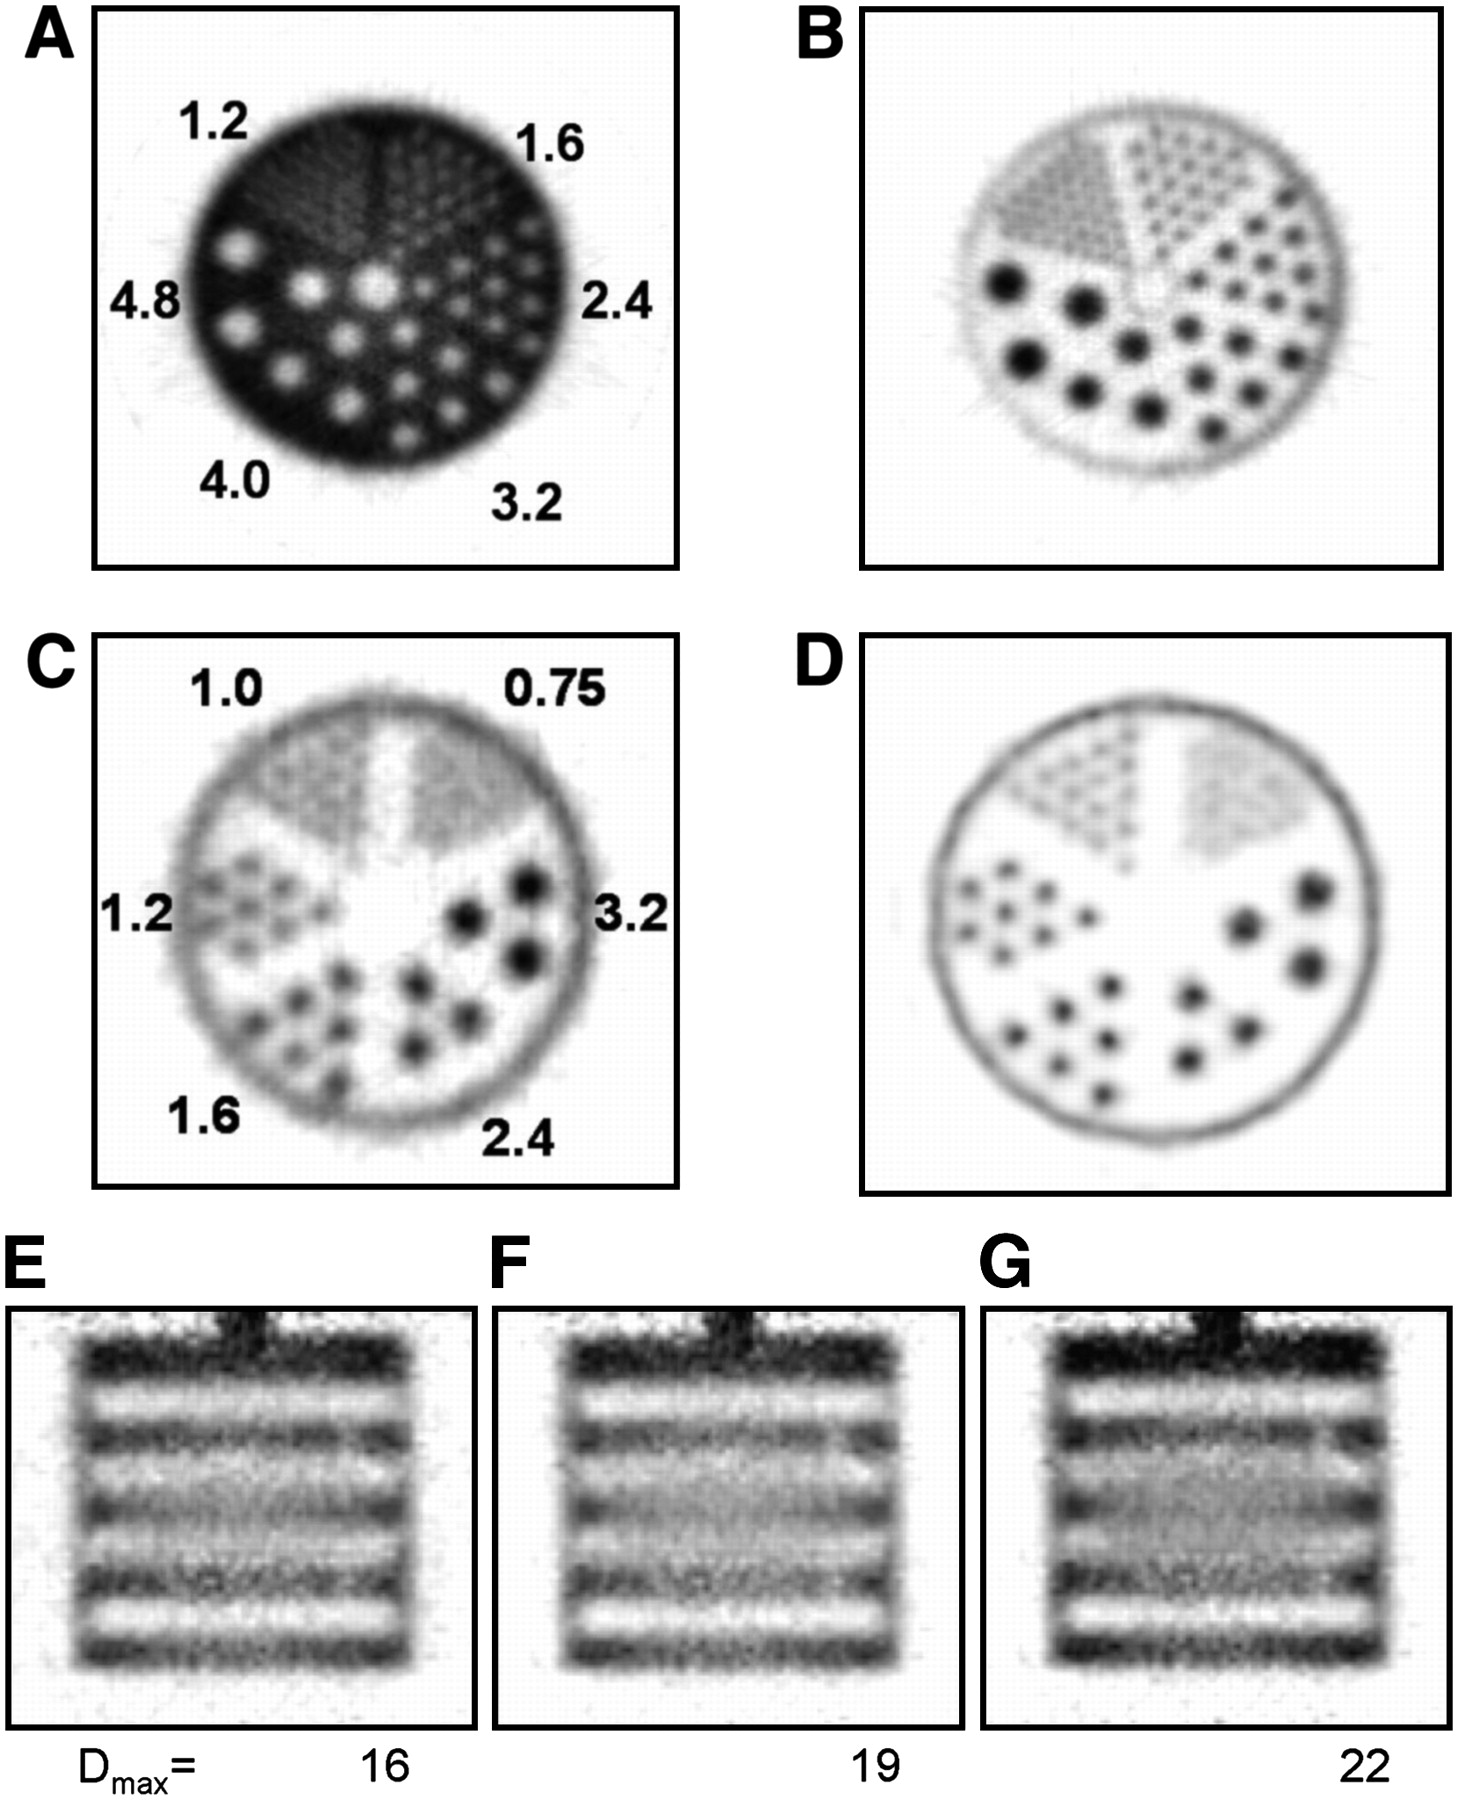
Transverse images of cold-rod (A) and hot-rod (B) microresolution phantoms reconstructed with FORE/FBP and ramp filter. Ultradeluxe microresolution hot-rod phantom images reconstructed with FORE/FBP (C) and with 3D OSEM (D). Coronal images of micro-Defrise phantom reconstructed with FORE/FBP with Dmax values of 16 (E), 19 (F), and 22 (G). Rod center-to-center spacing in A and B is twice the rod diameters shown in A, and rod center-to-center spacing in C and D is twice the rod diameters shown in C.
Images of the ultradeluxe microresolution hot-rod phantom reconstructed from the same dataset in two different ways are shown in Figures 2C and 2D. The image shown in Figure 2C was obtained by FBP with a ramp filter and a Nyquist cutoff, and the image shown in Figure 2D was reconstructed by 3D OSEM tailored to the geometry of VISTA and offered (with an external computer cluster) as an option by the manufacturer. This algorithm contains a detailed mathematic model of the resolution response of VISTA throughout the imaging field of view and is thus capable of resolution recovery or enhancement. A comparison of Figure 2D with Figure 2C suggests that this improvement is significant, because the 1.0-mm rods are now separated at the FWHM level whereas they are not in the image reconstructed with FBP. These data suggest qualitatively that the 3D OSEM algorithm with resolution recovery improves resolution by an amount on the order of 30%, a value comparable to that described elsewhere in the literature (28–30). Although not described here, these data also suggest that this reconstruction method substantially reduces variations in spatial resolution throughout the imaging field of view, resulting in a more quantitatively uniform imaging response (31).
A single coronal slice through the micro-Defrise phantom is shown in Figures 2E, 2F, and 2G; the FORE Dmax values used in these reconstructions were 16, 19, and 22, respectively. The vertical direction is the axial direction in Figures 2E, 2F, and 2G.
Axial Sensitivity Profile
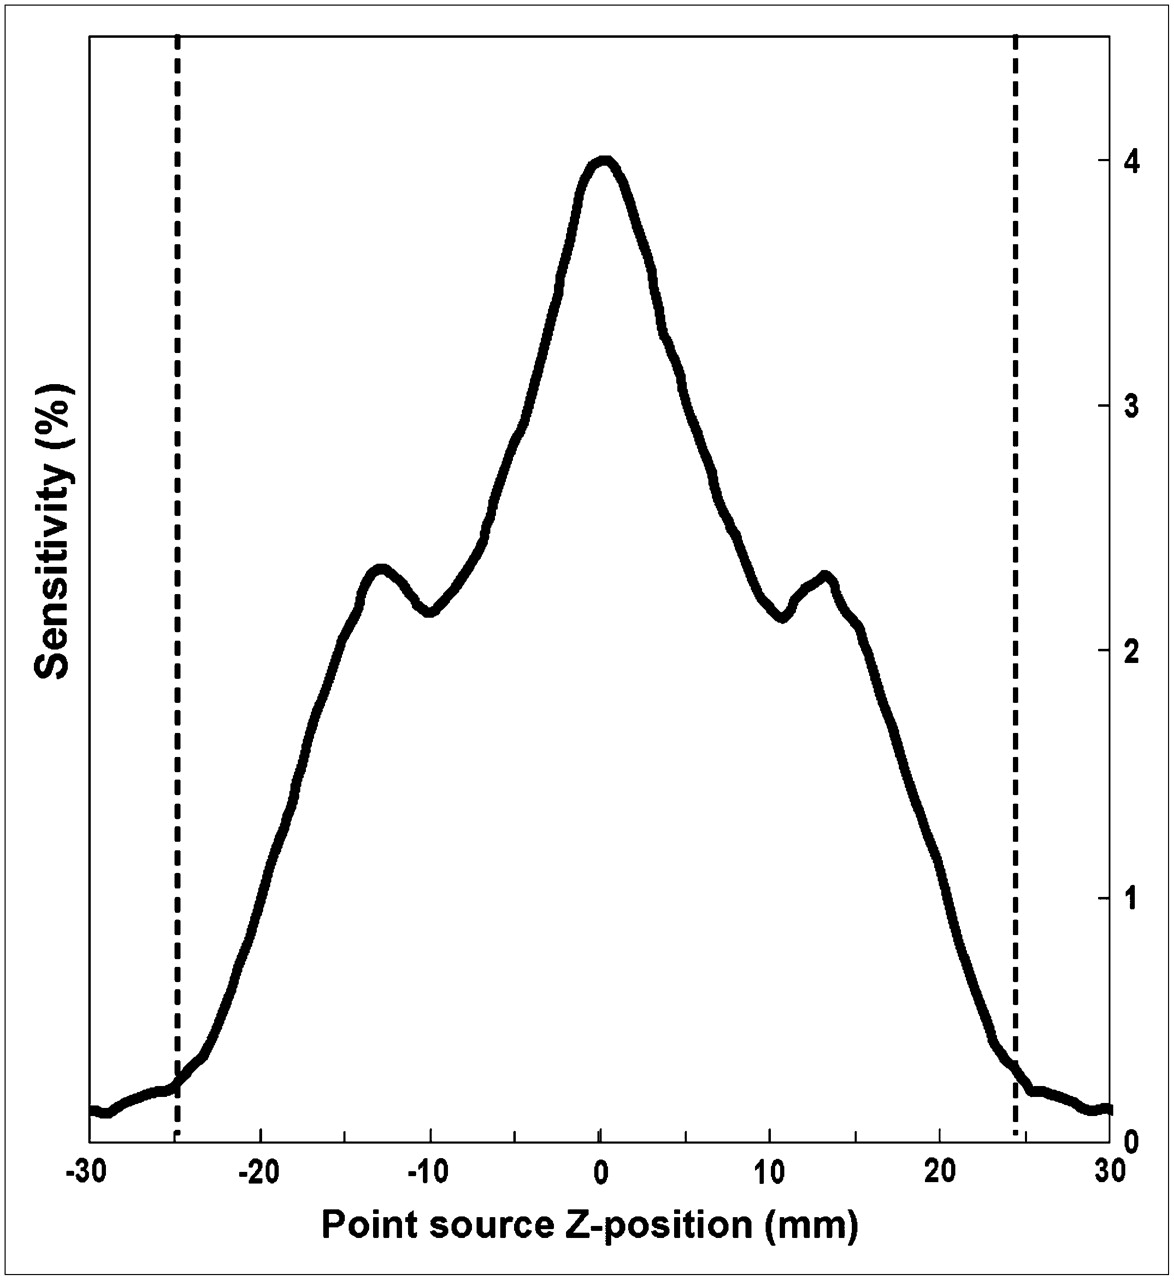
Absolute sensitivity (percentage of positron annihilations detected) is plotted against position in Figure 3 as the source is moved along the central axis of the scanner. This profile is triangular (as expected) but exhibits two small “bumps,” one on each side of the peak, that arise from the small gap between the two rings of detector modules in VISTA.

Axial sensitivity profile for VISTA. Bumps in profile are attributable to small gap between the two VISTA detector rings. Dashed vertical lines locate physical ends of axial field of view.
Absolute Central Point Source Sensitivity
ACS values, measured with a line source along the central axis of the scanner, are listed in Table 2 for three different energy windows.
ACS Values for Different Energy Windows
Scatter Fractions
Scatter fractions for mouse- and rat-sized cylinders are listed in Table 3 for three different energy windows.
Scatter Fractions
NEC Rates
Peak NEC rates for mouse- and rat-sized cylinders are listed in Table 4. The NEC rates for these objects with different energy windows are plotted in Figure 4 as a function of phantom activity concentration. The scatter fractions used to calculate these NEC rates are shown in Table 3.
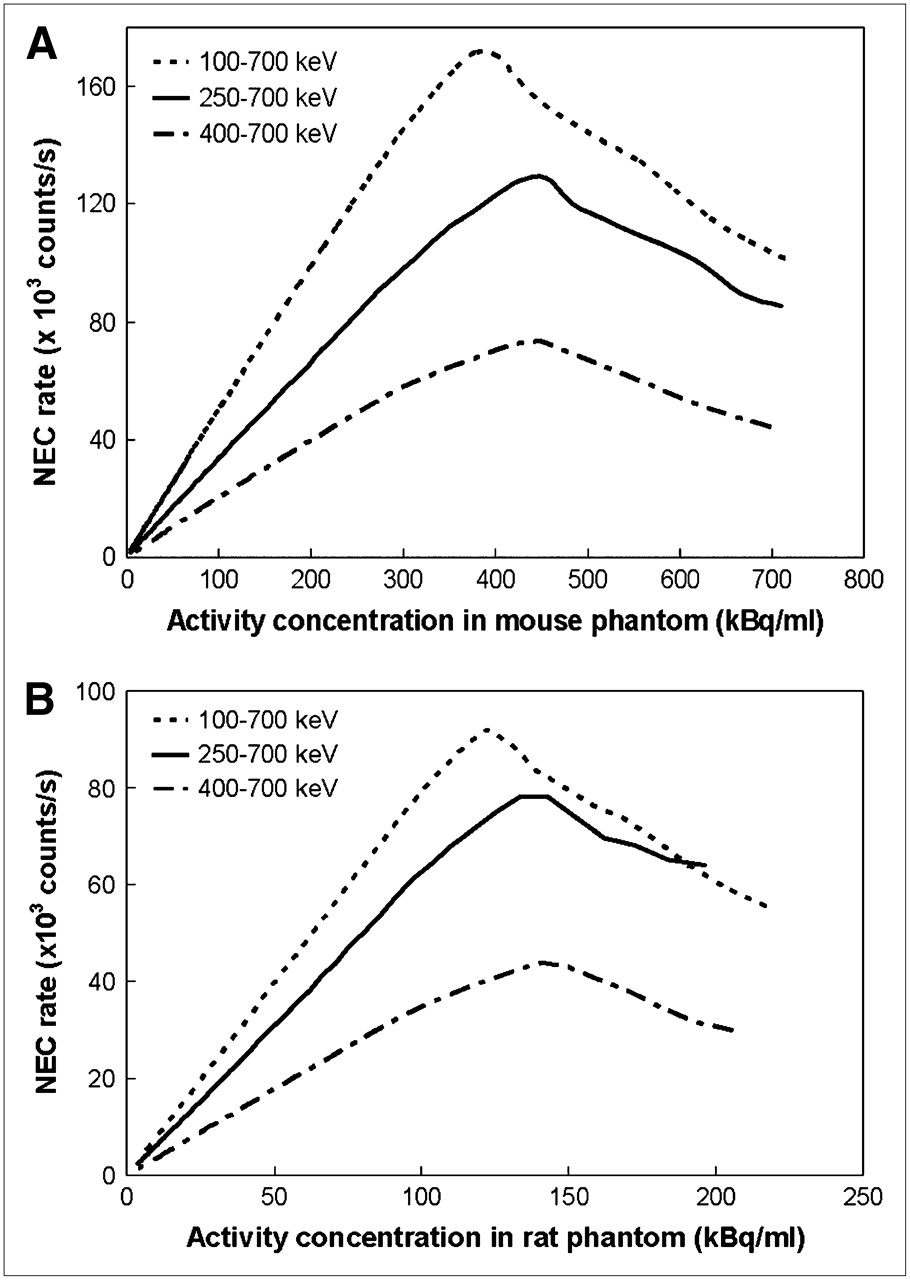
NEC rate curves for three different energy windows and two different phantoms, mouse (A) and rat (B).
Peak NEC Rates and Corresponding Activity Concentrations
Count Rate Linearity
The 24-hour time–activity curve of (mouse) phantom activity, corrected for random coincidences, system dead time, and radioactive decay to the time the data collection was started, was flat (as it should be) over nearly a 1,000-fold range of activity concentration and departed from “flatness” (defined as <3% variation from the average count rate in the central linear region) only at the very lowest concentrations (<740 Bq/mL or 0.02 μCi/cc) and the very highest concentrations (>407 kBq/mL or 11 μCi/cc). Curves obtained for the rat phantom would be expected to be equally flat and to differ in scale only along the concentration axis (as suggested by the linearity of the NEC rate plots shown in Fig. 4).
Energy and Timing Resolutions
Energy resolution averaged over all 6,084 crystals in the LYSO layer was 26% ± 3.1% (mean ± SD), and that over all 6,084 crystals in the GSO layer was 33% ± 4.8% (29.6% average system energy resolution).
Coincidence timing spectra for the four different coincidence combinations possible in VISTA averaged 1.3 ns and 3.0 ns at the FWHM and FWTM levels, respectively. Although the FWHM values did not differ appreciably from one another for any of the combinations, the GSO–LYSO spectra showed extended “tails” and were wider at the FWTM level than were the LYSO–LSYO and GSO–GSO spectra. These differences are accommodated in VISTA by using different widths of coincidence timing windows and different offsets of these windows with respect to a zero arrival time difference. Coincidence window widths were as follows: LYSO–LYSO, 5.0 ns; GSO–GSO, 10.0 ns; GSO–LYSO, 6.5 ns; and LYSO–GSO, 6.5 ns. These windows, set by the manufacturer, are based on the condition that the window width and offset encompass 97% of all coincidence events within these peaks.
Scintillator Identification Accuracy
Accuracy, as defined in “Materials and Methods,” was 95%. That is, an event occurring in a given phoswich element had a 95% chance of being correctly assigned to the LYSO or GSO crystal of interaction.
Effectiveness of Parallax Compensation
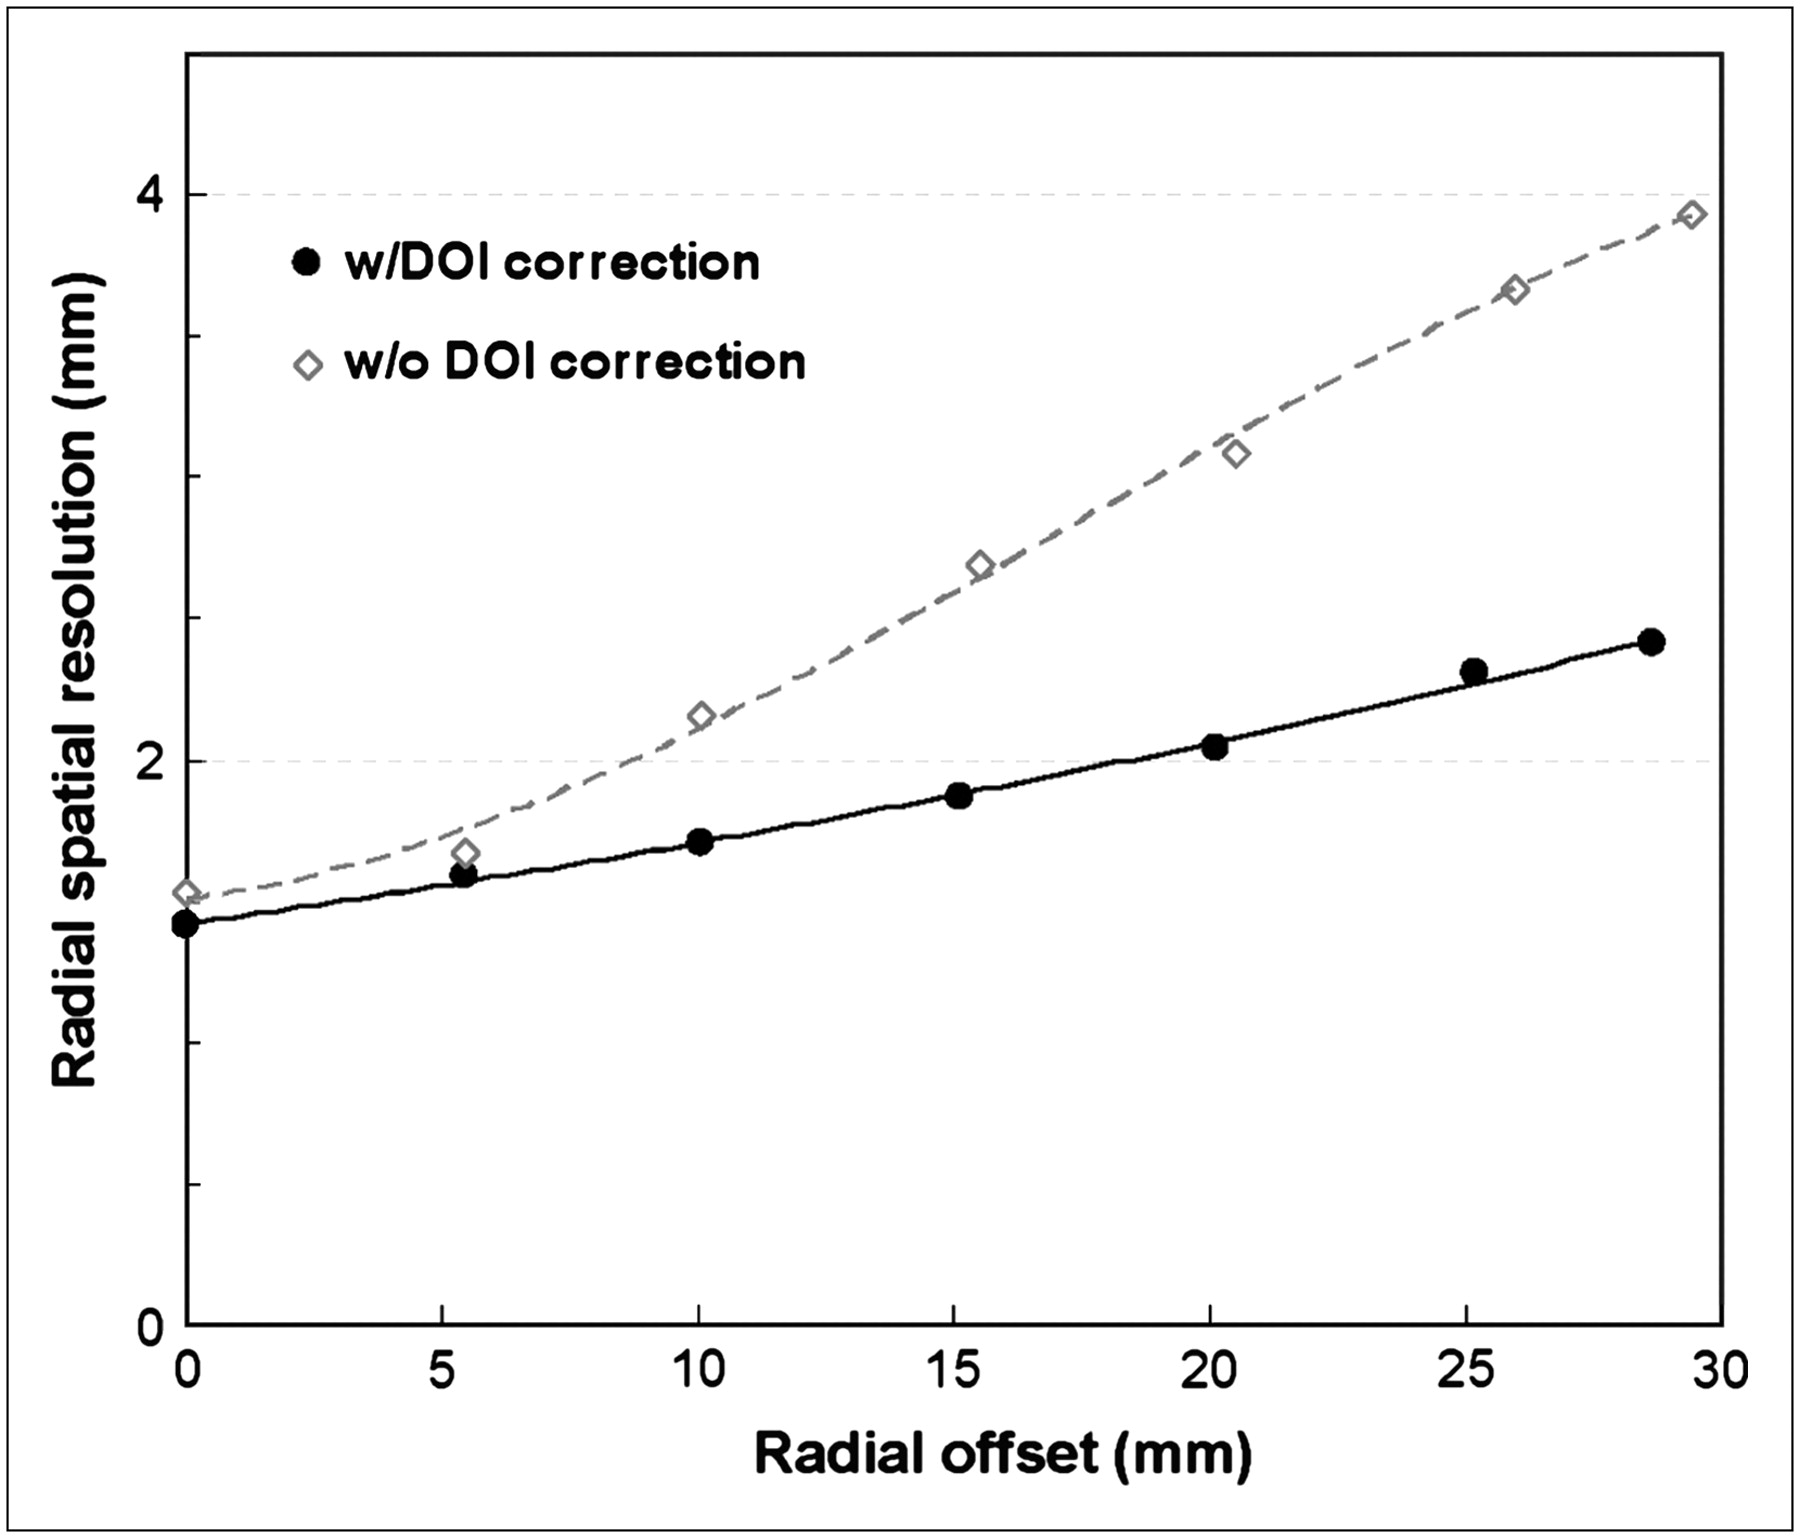
Radial resolution is plotted in Figure 5 against radial position (in slice 31) with parallax correction enabled and with an event in a phoswich element assigned to the axial center of that phoswich element (7.5 mm) regardless of which scintillator in the phoswich participated in the scintillation event, that is, with parallax compensation disabled. Spatial resolutions were similar for both in the central field of view (as expected) but degraded more rapidly with increasing radial position without compensation than with compensation. At 2.8 cm off axis, for example, the radial resolution with compensation was 2.5 mm, but this value degraded (by 56%) to 3.9 mm when compensation was not used.

Variations in radial resolution with increasing radius when VISTA parallax correction is enabled (•) and when parallax correction is disabled (⋄), as would be the case for single-crystal type of scanner with identical geometry and 15-mm crystal thickness but no DOI capability. Note apparent displacement in radial source position between the two sets of data points as radial offset increases. w/ = with; w/o = without.
Animal Imaging Studies
Whole-body 18F-FDG and whole-body 18F-fluoride mouse imaging studies are reconstructed in three different ways (2D FBP, 2D OSEM, and 3D OSEM) in Figure 6. Images from an experimental study conducted at the Johns Hopkins Medical Institutions are shown in Figure 7; these images are included to illustrate results that can be expected in an actual quantitative imaging study requiring sufficient spatial resolution to resolve proximate brain structures in the mouse and conducted with 11C, a radiolabel also requiring good count rate performance.

(Top row) The same single whole-body coronal section from an 18F-FDG mouse study (26-g mouse, ∼11.1 MBq or 0.3 mCi injected) reconstructed three different ways: FORE/FBP, FORE/2D OSEM, and 3D OSEM. (Bottom row) Maximum-intensity volume reprojections of an 18F-fluoride study (∼11.1 MBq or 0.3 mCi injected) in a 29-g mouse also reconstructed with these same three methods. The RV myocardium is seen in all three FDG reconstructions as well as the intensely labeled LV myocardium.

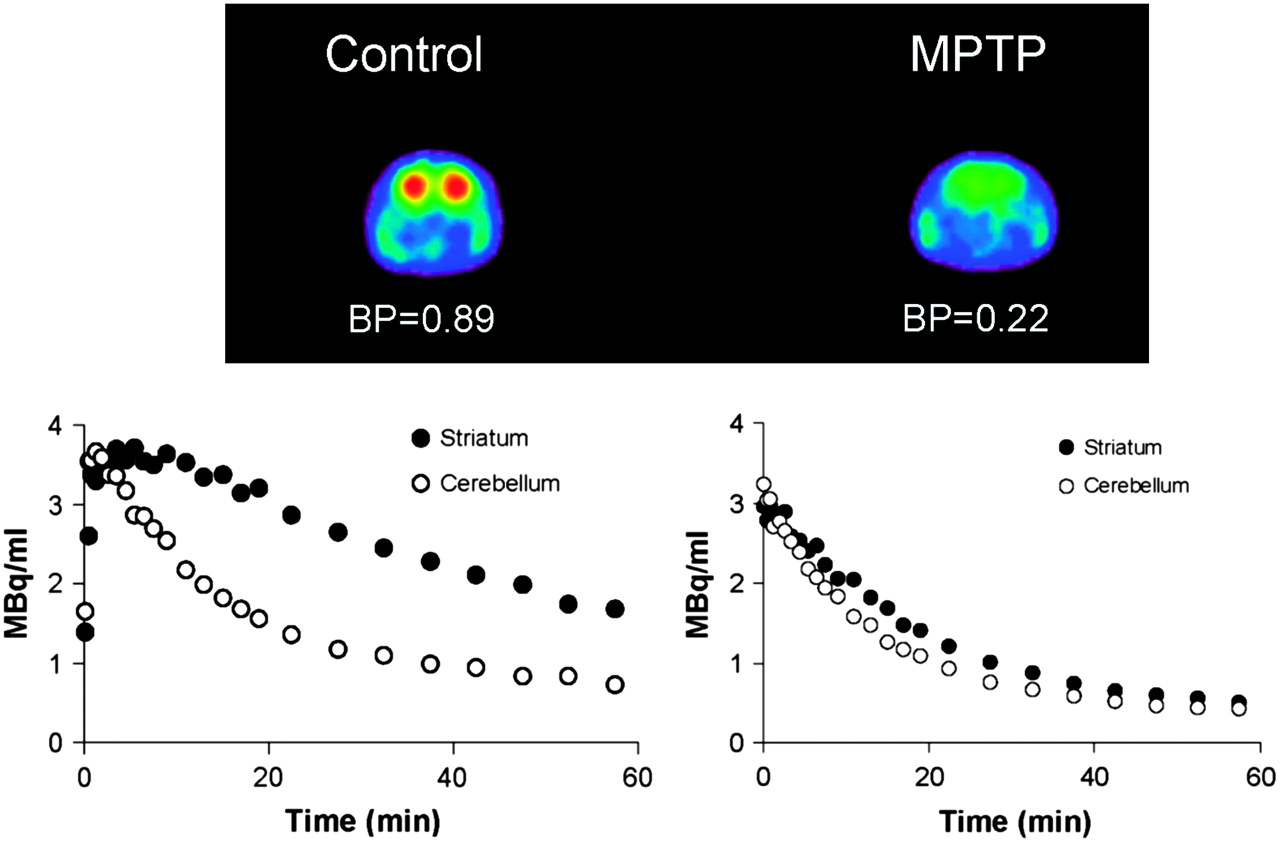
Transverse images of the distribution of 11C-methylphenidate (MP) in striatum of a normal 37-g control mouse (left) and a 37-g mouse (right) after treatment with 1-methyl-4-phenyl-1,2,3,6-tetrahydropyridine (MPTP), an intervention known to markedly reduce dopaminergic activity in striatum. Binding potential (BP) was derived from the striatal and cerebellar time–activity curves shown under each image. Striatal time–activity curve in the MPTP animal approaches that derived from the cerebellum, where there is little or no specific binding. Note variable frame rate data collections (high early, lower at later times) and minimal statistical fluctuations in both striatal and cerebellar time–activity curves. Both animals were injected with ∼37 MBq or 1.0 mCi of 11C-MP and imaged for 1 hour. These image data were corrected for scatter.
DISCUSSION
The results obtained in this study suggest that VISTA is well suited to the task of imaging rodent-sized animals; spatial resolution, resolution uniformity, sensitivity, and count rate performance combine to yield high-quality animal images with excellent statistical properties. A number of observations that relate to the unique design of this scanner were made during this study and deserve comment.
First, the use of dual-scintillator phoswich detector modules could, for various reasons, compromise spatial resolution, for example, because of excessive absorptive light losses across an extra optical joint or between different scintillators. Yet, the measured spatial resolution of the system at the center of the field of view after correction for finite source size (∼1.3 mm) is similar to that (1.2 mm) predicted from the relationship derived by assuming a block factor of zero (32): this equation includes the degrading effects of positron range (s), noncollinear annihilation (Dsystem term), and finite crystal size (Dcrystal). Even better agreement is obtained when plausible nonzero block factors (b) are included in this calculation. This finding suggests that the phoswich approach does not, in itself, compromise spatial resolution.
On the other hand, the energy resolution of VISTA is somewhat poorer than the reported energy resolution (20%–25%) of several other single-scintillator (non-DOI correcting) small-animal PET scanners (8). Although the phoswich technique produces enough scintillation light to easily locate a phoswich element in an array of such elements, it may be that the total light output of an element is somewhat lower than that in a single-scintillator design because scintillation light emitted by one of the scintillators can be absorbed (and lost) in the other. It is known that this process, for example, the absorption of LYSO light by GSO, does occur in LYSO/GSO phoswich elements (33) and so could be responsible for the small reduction in energy resolution observed here. As a practical matter, this difference does not seem to be particularly significant, because images can be corrected for scatter and the reduction in energy resolution compared with single-scintillator scanners is not great.
The axial sensitivity profile shown in Figure 3 differs from, for example, that shown in the study of Bloomfield et al. (34). Instead of a smoothly rising and falling triangular function, this profile contains two bumps, one on each side of the maximum. These perturbations are caused by the small physical axial gap that exists between the two rings of detector modules in VISTA and is purely geometric in character. Although the shape of this function is unusual, knowledge of this variation allows accurate sensitivity normalization corrections to be made to VISTA data.
The existence of this gap also requires modification of the FORE code to allow sinograms to be created for the gap region even though no crystal rings actually surround the subject in this region. That these modifications are largely successful is suggested by the results shown in Figure 2, particularly in Figures 2E, 2F, and 2G, for the micro-Defrise phantom. If axial resolution were perfect, then all of the hot slabs portrayed in Figure 2 would be of equal width and uniform brightness. However, the central slabs are both somewhat wider and less bright at the center than are their neighbors nearer the axial ends of the field of view, suggesting that axial resolution is somewhat poorer in the central field than at the ends. All scanners that acquire data in 3D must, inevitably, have some reduction in spatial resolution in the central field of view when lines of response at extreme obliquity are included in the reconstruction; therefore, some portion of this axial resolution reduction is due to this effect and not the gap. The effect of including lines of higher obliquity can be seen in Figure 2, in which the FORE Dmax parameter has been increased from 16 (Fig. 2E) to 22 (Fig. 2G). Although the amount of blurring in the central region increases slowly with Dmax, the axial resolution measurements shown in Figures 1C and 1D suggest that axial blurring from all sources is small in the central region when images are reconstructed with the Dmax default value of 16.
Peak NEC rates for VISTA (Table 4) are high and occur at relatively low tracer concentrations (as expected given the high sensitivity of the scanner). Unlike the results reported by Tai et al. (9), however, the peak NEC rates for both rat and mouse phantoms occur with the widest energy window (100–700 keV). Because the NEC rate is, in effect, a measure of “good counts” modulated by event throughput efficiency, scatter fraction, and random coincidence rate for rat- and mouse-sized objects, the NEC data taken by themselves suggest that this wide energy window should be used routinely for animal imaging. If other important imaging parameters, for example, spatial resolution, are not seriously compromised by this choice, sensitivity could be increased to more than 6%; such an increase could be usefully exploited in actual animal studies, in which the specific activity of the administered tracer can sometimes limit the amount of administered tracer or in which particularly low uptake by the target structure is expected.
The purpose of phoswich modules is to reduce parallax losses while preserving the sensitivity associated with thick (in the radial direction) scintillation crystals. The comparison of parallax-corrected with parallax-uncorrected spatial resolution shown in Figure 5 suggests that this strategy does, in fact, reduce parallax losses as radial source position increases. At 2.8 cm off axis, radial resolution degrades by 56% when parallax correction is not used. Yet, at the same time, the sensitivity of VISTA remains high. In a conventional single-crystal type of scanner without parallax correction, only a reduction in crystal depth or thickness can achieve the same resolution at the same radial position as a parallax-correcting system. However, reducing crystal thickness also reduces sensitivity, potentially severely, because sensitivity varies with the square of the detection efficiency of the individual crystal elements. Thus, even a modest difference in crystal thickness can have a significant effect on detection sensitivity.
Another, less appreciated, beneficial effect of DOI correction is evident in Figure 5. As the source is moved away from the central axis in the radial direction, the apparent location of the source point without DOI correction becomes increasingly displaced toward larger radial values compared with the more nearly correct DOI-compensated positions. Although small, this improvement in spatial linearity is also an expected secondary effect of DOI compensation.
Finally, the animal studies shown in Figure 6 indicate that VISTA is capable of producing high-quality images in rodents for imaging targets of both low and high biologic contrast. When statistical considerations are not dominant, VISTA can reveal very small, relatively low-contrast structures in the mouse body, such as the right ventricular myocardium in the top row of Figure 6, and very fine structures in high-biologic-contrast targets, such as the mouse skeleton in the bottom row of Figure 6. The study shown in Figure 7 portrays results under conditions more often found in actual experiments. The time–activity curves for the striatum and cerebellum are of excellent statistical quality even for this 11C-labeled tracer.
CONCLUSION
VISTA is well suited to the imaging of rodent-sized animals. Excellent spatial resolution, resolution uniformity, sensitivity, and count rate performance support the view that VISTA is among the most technologically advanced small-animal PET scanners now available.
Acknowledgments
We thank James Fox (Johns Hopkins Medical Institutions) for assisting with the data collection and Jose Manuel Udias (Universidad Complutense, Madrid, Spain) for providing the 3D OSEM reconstruction code. We also thank Harold G. Ostrow and Michael V. Green (Trident Imaging Inc., Rockville, MD) for their assistance and advice. Finally, we thank Tomas Guilarte, Ronnie Mease, Chris Endres, and Catherine Foss (Johns Hopkins Medical Institutions) for permitting use of the rodent images shown in this article. This work was supported in part by grant CA92871 from the National Institutes of Health, Bethesda, MD.
References
- Received for publication April 4, 2006.
- Accepted for publication August 15, 2006.


Jump to section
Related Articles
Cited By...
- [18F]Fluorocholine and [18F]Fluoroacetate PET as Imaging Biomarkers to Assess Phosphatidylcholine and Mitochondrial Metabolism in Preclinical Models of TSC and LAM
- Noninvasive PET Imaging and Tracking of Engineered Human Muscle Precursor Cells for Skeletal Muscle Tissue Engineering
- Performance Evaluation of a New Dedicated Breast PET Scanner Using NEMA NU4-2008 Standards
- Mapping Changes in Mouse Brain Metabolism with PET/CT
- Performance Evaluation of the Small-Animal nanoScan PET/MRI System
- Spatiotemporal Uptake Characteristics of [18]F-2-Fluoro-2-Deoxy-D-Glucose in a Rat Middle Cerebral Artery Occlusion Model
- Molecular Imaging of Conscious, Unrestrained Mice with AwakeSPECT
- Small-Animal PET: What Is It, and Why Do We Need It?
- NEMA NU 4-2008 Comparison of Preclinical PET Imaging Systems
- 5-(2-18F-Fluoroethoxy)-L-Tryptophan as a Substrate of System L Transport for Tumor Imaging by PET
- 3'-Deoxy-3'-18F-Fluorothymidine PET/CT to Guide Therapy with Epidermal Growth Factor Receptor Antagonists and Bcl-xL Inhibitors in Non-Small Cell Lung Cancer
- National Electrical Manufacturers Association NU-4 Performance Evaluation of the PET Component of the NanoPET/CT Preclinical PET/CT Scanner
- Stable Delineation of the Ischemic Area by the PET Perfusion Tracer 18F-Fluorobenzyl Triphenyl Phosphonium After Transient Coronary Occlusion
- Development of Small-Animal PET Prototype Using Silicon Photomultiplier (SiPM): Initial Results of Phantom and Animal Imaging Studies
- Characterization and Reduction of Noise in Dynamic PET Data Using Masked Volumewise Principal Component Analysis
- Radionuclide Imaging of Angiotensin II Type 1 Receptor Upregulation After Myocardial Ischemia-Reperfusion Injury
- In vivo Imaging of Inflammation- and Tumor-Induced Lymph Node Lymphangiogenesis by Immuno-Positron Emission Tomography
- Signal Extraction and Separation in In Vivo Animal PET Studies with Masked Volumewise Principal-Component Analysis
- A Mouse Model Characterizing Features of Vascular Dementia With Hippocampal Atrophy * Supplemental Methods
- Noninvasive Quantification and Optimization of Acute Cell Retention by In Vivo Positron Emission Tomography After Intramyocardial Cardiac-Derived Stem Cell Delivery
- Recent Advances in Small-Animal Cardiovascular Imaging
- Spatial Resolution and Sensitivity of the Inveon Small-Animal PET Scanner
- Ectopic Expression of the Sodium-Iodide Symporter Enables Imaging of Transplanted Cardiac Stem Cells In Vivo by Single-Photon Emission Computed Tomography or Positron Emission Tomography
- In Vivo PET Imaging of Cardiac Presynaptic Sympathoneuronal Mechanisms in the Rat
- A Prototype PET Scanner with DOI-Encoding Detectors
- Latest Advances in Molecular Imaging Instrumentation
- Performance Measurement of the microPET Focus 120 Scanner