


Abstract
The renin–angiotensin system (RAS) mediates proapoptotic, profibrotic, and proinflammatory processes in maladaptive conditions. Activation after myocardial infarction may initialize and promote cardiac remodeling. Using a novel positron-emitting ligand, we sought to determine the presence and time course of regional myocardial upregulation of the angiotensin II type 1 receptor (AT1R) and the blocking efficacy of various anti-RAS agents. Methods: In male Wistar rats (n = 31), ischemia–reperfusion damage was induced by 20- to 25-min ligation of the left coronary artery. The AT1R blocker 11C-2-butyl-5-methoxymethyl-6-(1-oxopyridin-2-yl)-3-[[2-(1H-tetrazol-5-yl)biphenyl-4-yl]methyl]-3H-imidazo[4,5-b]pyridine (11C-KR31173) was injected intravenously at different times until 6 mo after surgery and sacrifice. Autoradiography, histology, and immunohistochemistry were performed for ex vivo validation. Additional in vivo PET was conducted in 3 animals. A second series of experiments (n = 16) compared untreated animals with animals treated with oral valsartan (50 mg/kg/d), oral enalapril (10 mg/kg/d), and complete intravenous blockage (SK-1080, 2 mg/kg, 10 min before imaging). Results: Transient regional AT1R upregulation was detected in the infarct area, with a peak at 1–3 wk after surgery (autoradiographic infarct-to-remote ratio, 1.07 ± 0.09, 1.68 ± 0.34, 2.54 ± 0.40, 2.98 ± 0.70, 3.16 ± 0.57, 1.86 ± 0.65, and 1.28 ± 0.27 at control, day 1, day 3, week 1, week 3, month 3, and month 6, respectively). The elevated uptake of 11C-KR31173 in the infarct area was detectable by small-animal PET in vivo, and it was blocked completely by intravenous SK-1080. Although oral treatment with enalapril did not reduce focal tracer uptake, oral valsartan resulted in partial blockade (infarct-to-remote ratio, 2.94 ± 0.52, 2.88 ± 0.60, 2.07 ± 0.25, and 1.26 ± 0.10 for no treatment, enalapril, valsartan, and SK-1080, respectively). Conclusion: After ischemic myocardial damage in a rat model, transient regional AT1R upregulation is detectable in the infarct area using 11C-KR31173. Inhibitory effects of the clinical AT1R blocker valsartan can be identified, whereas blockage of upstream angiotensin-converting enzyme with enalapril does not affect AT1R density. These results provide a rationale for subsequent testing of AT1R-targeted imaging to predict the risk for ventricular remodeling and to monitor the efficacy of anti-RAS drug therapy.
Left-ventricular remodeling describes changes in the structure, geometry, and function of the heart, which ultimately lead from myocardial injury to heart failure. The underlying biologic processes are thought to be complex, but there is increasing interest in developing strategies for targeted imaging of these maladaptive mechanisms (1). It is hoped that such novel molecular imaging techniques may provide prognostic value after myocardial infarction (MI) and that they may identify appropriate therapies to prevent the development of heart failure.
Various neurohormonal systems are known to be involved in left-ventricular remodeling (2). The renin–angiotensin system (RAS) is of particular interest, and not just because medical therapy directed against the RAS demonstrated an outcome benefit in large clinical trials (3–5). An increasing body of evidence shows that, in addition to the systemic circulatory RAS, there is a local myocardial tissue component (6). In the heart, most of the angiotensin II, the primary active molecule of RAS, is thought to be produced by local synthesis rather than from circulating angiotensin I (7). Transgenic mice with cardiac-specific angiotensin II type 1 receptor (AT1R) overexpression develop cardiac remodeling, characterized by hypertrophy and fibrosis, in the absence of hemodynamic abnormalities (8). On the other hand, AT1R knockout mice show an improved survival rate after MI (9). Therefore, a method for noninvasive assessment of regional myocardial activation of the RAS could be of considerable value for improved understanding of its role in remodeling and for optimizing anti-RAS therapy.
11C-2-butyl-5-methoxymethyl-6-(1-oxopyridin-2-yl)-3-[[2-(1H-tetrazol-5-yl)biphenyl-4-yl]methyl]-3H-imidazo[4,5-b]pyridine (11C-KR31173), a metabolically stable, specific AT1R ligand that demonstrated promising biodistribution and kinetic properties in multiple species (10–12), was introduced as a novel PET tracer. In the present study, we used a rat model of MI to determine the feasibility of 11C-KR31173 for characterizing the presence and time course of regional myocardial AT1R upregulation and the blocking efficacy of various anti-RAS drugs.
MATERIALS AND METHODS
Animal Model
The protocols were approved by the Johns Hopkins Animal Care and Use Committee and conform to the Guide for the Care and Use of Laboratory Animals (13).
Male Wistar rats weighing 250–350 g were used. Rats were anesthetized using 1%–3% isoflurane gas and mechanical ventilation. Left thoracotomy was performed to expose the heart. A 7-0 polypropylene suture was passed through the myocardium beneath the proximal portion of the left coronary artery. Subsequently, both ends of the suture were passed through a small vinyl tube that produced a snare. Then, by pulling both ends of the suture against the vinyl tube to tighten the snare, the left coronary artery was occluded. Reperfusion was obtained after 20–25 min by release of the snare. The success of coronary occlusion and reperfusion were confirmed by regional cyanosis of the myocardial surface and blush in the risk area, respectively (14,15). Then, the chest was closed and the animals were allowed to recover. Rats were given an intramuscular injection of buprenorphine (0.5 mg/kg) twice daily for 24 h to act as postoperative analgesia.
Ex Vivo Receptor Binding Studies with 125I-[saralasin-1-isoleucine8] (SI) Angiotensin II
At 1 h, 1 d, 1 wk, and 3 wk after MI (n = 4, 5, 5, and 5, respectively), 0.74 MBq of 201Tl-chloride were injected via the tail vein for later delineation of the nonperfused scar area. To delineate the area at risk, the left coronary artery was reoccluded via tightening of the snare (which was left in place for animals of this series) 15 min later; 185 MBq of 99mTc- tetrofosmin were then injected during occlusion to delineate the risk area. One minute later, the rat was euthanized, the heart was frozen, and short-axis sections (20-μm thickness) were obtained on a cryostat.
Multitracer autoradiography was performed using a phosphor imager (Perkin Elmer). A first exposure of 30 min was started at 1 h after sacrifice to visualize 99mTc-tetrofosmin distribution. Three days later, after decay of 99mTc, a 7-d exposure was conducted for visualization of 201Tl distribution (16). Then, for analysis of angiotensin II binding to tissue, sections were incubated in a buffer with 500 pM 125I-SI angiotensin II for 120 min. Nonspecific binding was assessed by incubation in the same buffer after the addition of 3 μM SK-1080 (a potent AT1R blocker). Slides were rinsed and dried. After decay of 201Tl (>30 d), a 30-d exposure was performed for the visualization of 125I activity.
Region-of-interest analysis was used to determine angiotensin II activity in the remote myocardium, infarct scar (defined by 201Tl defect), and area at risk (defect on 99mTc images but not on 201Tl images) using image J software (National Institutes of Health). The radioactivity values of each region of interest were expressed as background-corrected photostimulated luminescence units per area (mm2). Infarct size and area at risk size were determined by measuring the 201Tl defect area and 99mTc defect area, respectively, with manual planimetrics on a mid-ventricular slice.
Histologic Tissue Analysis
Short-axis slices were stained with hematoxylin and eosin (HE) to determine scar localization and extent. Additionally, immunohistochemistry of AT1R was performed using standard techniques and commercially available rabbit polyclonal AT1R antibodies (Abcam).
Autoradiography After in Vivo Injection of 11C-KR31173
11C-KR31173 was synthesized as previously described (10–12).
For this series, rats were studied at day 1 (n = 6), day 3 (n = 4), week 1 (n = 4), week 3 (n = 4), month 3 (n = 4), and month 6 (n = 4) after MI. A blocking study was performed in 4 animals at 1 wk after MI using a 2 mg/kg injection of SK-1080 at 10 min before 11C-KR31173 administration. Finally, a control group of rats (n = 5) was studied without MI.
In all animals, 37 MBq of 11C-KR31173 were administered via the tail vein. Thirty minutes later, rats were sacrificed, the heart was removed, short-axis slices were rapidly obtained, and exposure for autoradiography was started immediately for 3 h. For region-of-interest analysis, the infarct area was defined on corresponding HE-stained sections, and a ratio of radioactivity in infarct and remote areas was obtained on mid-myocardial sections.
In a next series, the effects of oral intake of a clinically approved AT1R blocker and an angiotensin-converting enzyme (ACE) inhibitor were examined. Valsartan (50 mg/kg/d, n = 4) or enalapril (10 mg/kg/d, n = 4) was given orally via a gastric tube after MI. Animals were studied by 11C-KR31173 autoradiography at 1 wk after MI. Results were compared with the groups without blockade (n = 4) and those with intravenous SK-1080 blockade (n = 4) (2 mg/kg intravenously 10 min before tracer administration). Infarct scar size was determined using HE staining with manual planimetric measurement on digitalized photographs.
In Vivo PET
A dedicated small-animal PET scanner (Explore VISTA; GE Healthcare) was used for in vivo myocardial imaging. The intrinsic spatial and volume resolutions of this system are reported as approximately 1.4 mm3 and 2.9 mm3, respectively (17). One week after MI, a 30-min static scan was obtained at 20 min after the intravenous injection of 55.5 MBq of 11C-KR31173 (n = 3). A blocking PET study with SK-1080 (2 mg/kg) was performed with 1 of the infarction rats at 1 d after PET without blocking. As a reference for the localization of left-ventricular myocardium and infarct area, 13N-ammonia perfusion PET was performed after the 11C-KR31173 scan. After the decay of 11C-KR31173, 37 MBq of 13N-ammonia were injected, and a 10-min static acquisition was initiated at 5 min after tracer injection, to visualize the myocardium and hypoperfused infarct area. Image data were reconstructed with an iterative algorithm (2-dimensional ordered-subset expectation maximization).
Statistical Analysis
All results were expressed as mean ± SD. Statistical analysis was done with StatMate III (ATMS Co., Ltd.). Multiple-group comparisons were made by ANOVA using ranks (Kruskal–Wallis test) followed by Dunn's multiple-contrast hypothesis test to identify differences between each set of groups. A value of P less than 0.05 was considered statistically significant.
RESULTS
Angiotensin II Binding in Remote Myocardium, Area at Risk, and Infarct Area
For the multitracer autoradiography of infarct animals, the planimetrically measured area at risk was 51.1% ± 16.2% of the myocardial circumferential area, and the infarct area was 19.9% ± 12.6% of the entire myocardial circumference and 33.0% ± 20.4% of the area at risk. There was no difference in the area at risk and infarct area between the different time points after MI.
125I-labeled angiotensin II showed regionally increased binding in the territory of the occluded left coronary artery at 1 and 3 wk after myocardial ischemia–reperfusion injury, whereas noninfarcted control hearts and hearts at 1 h after ischemia–reperfusion demonstrated only homogeneous, low background activity. The area of increased angiotensin II binding was well matched with the area of infarct shown by 201Tl uptake defect (Fig. 1). No significant elevation of angiotensin II binding was found in the noninfarcted area at risk, identified by 99mTc-tetrofosmin. The ratio of infarct uptake to remote uptake was 0.99 ± 0.036, 0.83 ± 0.15, 1.12 ± 0.40, 4.12 ± 1.48, and 4.44 ± 1.48 at control, 1 h, day 1, week 1, and week 3, respectively (vs. control, the ratios at weeks 1 and 3 were significant [P < 0.001]). The specificity of the 125I signal was evidenced by a strong blocking effect of SK-1080 (at week 1: uptake ratio, 1.18 ± 0.16, P < 0.01 vs. no blocking). Immunohistochemistry for the angiotensin II type 1 receptor confirmed increased expression in the histologic area of the infarct.

(A) Corresponding autoradiographic short-axis images in rat heart at 3 wk after MI (99mTc-tetrofosmin, 201Tl, 125I-SI angiotensin II, and HE staining). 99mTc-tetrofosmin images demonstrate area at risk, because tracer was injected during coronary reocclusion before sacrifice. Focal-increased 125I-SI angiotensin II is seen in area of MI indicated by 201Tl uptake defect and HE staining. (B) Results of quantification of 125I-SI angiotensin II activity in remote myocardium, area at risk, and infarct area at 3 wk after MI and in control hearts. (C) Immunohistochemical staining showed increased AT1R in infarct area. Ang = angiotensin; ANT = anterior; INF = inferior; LAT = lateral; SEP = septal; TF = tetrofosmin.
Myocardial Uptake of 11C-KR31173 In Vivo
In our model, the autoradiographic pattern after in vivo intravenous injection of the PET tracer 11C-KR31173, showing elevated uptake in the infarct area (Fig. 2A), was confirmed by the same uptake pattern shown by ex vivo binding studies using 125I-labeled angiotensin II. The specificity of 11C-KR31173 uptake for AT1R was confirmed by an 87% reduction of signal after intravenous blockade with SK-1080, 10 min before tracer injection.

(A) Representative autoradiographic short-axis images of 11C-KR31173 at 1 wk after MI and corresponding histology with HE staining. (B) Time course of 11C-KR31173 ratio of infarct uptake to remote uptake after coronary occlusion and reperfusion. Temporal increase of tracer signal in infarct area peaked at week 3. *P < 0.01. **P < 0.001. ***P < 0.05, as compared with control.
An extended assessment of the time course of AT1R upregulation confirmed that 11C-KR31173 uptake peaked at 3 wk and decreased time-dependently until the end of the study at 6 mo. The ratio of infarct uptake to remote uptake was 1.07 ± 0.09, 1.68 ± 0.34, 2.54 ± 0.40, 2.98 ± 0.70, 3.16 ± 0.57, 1.86 ± 0.65, and 1.28 ± 0.27 at control, day 1, day 3, week 1, week 3, month 3, and month 6, respectively (vs. control, the ratios at day 3 [P < 0.01], weeks 1 and 3 [P < 0.001], and month 3 [P < 0.05] were significant) (Fig. 2B).
In Vivo PET
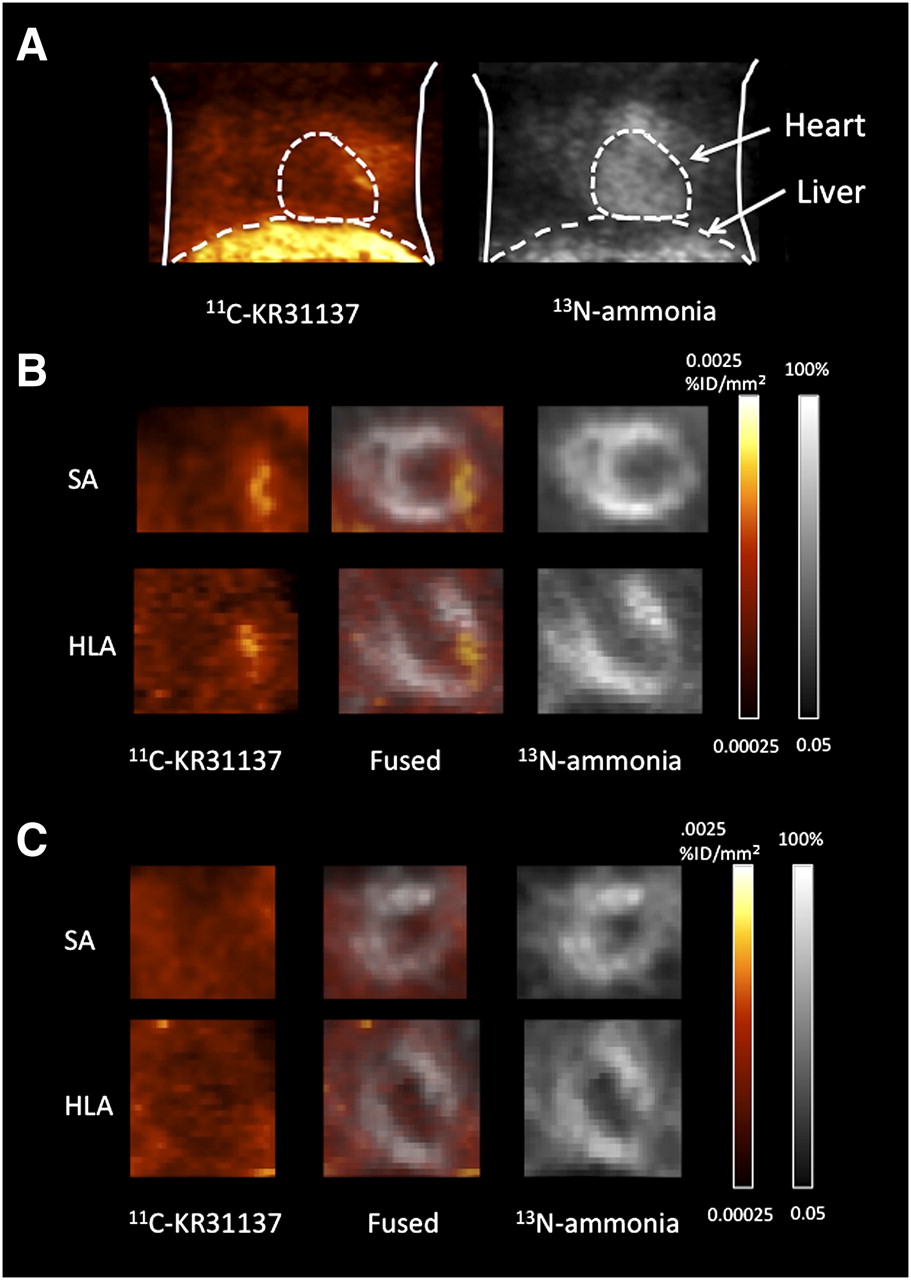
Focally increased myocardial uptake of 11C-KR31173 was identified in the hypoperfused infarct area showing reduced 13N-ammonia uptake using dedicated small-animal PET (Fig. 3). The ratio of infarct uptake to remote uptake was 2.2 ± 0.9 at 1 wk after ischemia–reperfusion. The 11C-KR31173 signal was undetectable after blocking with SK-1080, 10 min before tracer injection. Notably, however, a high liver uptake of 11C-KR31173 was observed. The ratio of liver uptake to heart uptake was 10.3 ± 1.76.

11C-KR31137 and 13N-ammonia images of rat with MI at week 1. (A) Anterior maximum-intensity-projection chest view. (B) Short-axis (SA) view and horizontal-long-axis (HLA) views showing focal increased 11C-KR31173 uptake in area of reduced myocardial perfusion by 13N-ammonia. (C) Images after blocking with SK-1080, resulting in disappearance of focal increased 11C-KR31173 signal.
Effect of Anti-RAS Medication
All animals survived surgery and medication. Oral medication with the AT1R blocker valsartan (approved by the Food and Drug Administration) for 1 wk after ischemia–reperfusion resulted in a partial blocking effect, as identified by a 51% reduction of 11C-KR31173 uptake when compared with nontreated infarct rats. Oral medication with the clinically approved ACE inhibitor enalapril had no effect on 11C-KR31173 uptake. The ratio of infarct uptake to remote uptake was 2.94 ± 0.52, 2.88 ± 0.60, 2.07 ± 0.25*, and 1.26 ± 0.10** for the untreated ischemia–reperfusion model, enalapril-treated, valsartan-treated, and intravenous SK-1080–blocked animals (vs. untreated, the ratios for the valsartan-treated [P < 0.05] and intravenous SK-1080–blocked animals [P < 0.001] were significant) (Fig. 4). Planimetrically measured histologic infarct size cannot explain the uptake differences because size was similar among groups (21.8% ± 8.4%, 24.6% ± 4.3%, 21.3% ± 4.2%, and 20.5% ± 11.6% of left-ventricular circumference for untreated, enalapril, valsartan, and SK-1080).

Representative autoradiographic and HE-stained images of infarcted rat hearts at week 1, from 4 groups: control (no treatment), SK-1080 intravenous injection 10 min before imaging, oral daily valsartan administrations, and oral daily enalapril administrations. Bar graph shows ratio of infarct uptake to remote uptake in each group. *P < 0.01, as compared with control.
DISCUSSION
This study suggested the feasibility of measuring myocardial AT1R expression noninvasively using a novel PET tracer, 11C-KR31173. Ex vivo tissue binding studies with 125I-labeled angiotensin II indicate regional upregulation of receptors that is nicely matched with the infarct area in our rat model of coronary occlusion and reperfusion. Corresponding to angiotensin II binding at ex vivo incubation, we found increased regional uptake in the infarct region after in vivo injection of 11C-KR31173, with a peak signal between 1 and 3 wk after MI. The specificity of the PET tracer signal for AT1R was proven by blocking experiments, and the inhibitory effects of the clinical AT1R blocker valsartan after oral administration could be identified. These results lay a foundation for future projects using AT1R-targeted in vivo molecular imaging for the prediction of left-ventricular remodeling and the monitoring of the efficacy of drug therapy directed against the RAS.
The results of our imaging study are in line with prior molecular biologic studies showing increased local AT1R expression at the site of MI in a rat model (18). Further histologic examinations confirmed that receptor expression was primarily associated with myofibroblasts at the site of MI (19,20). It has been speculated that soon after the arrival of inflammatory cells in the infarct area, these cells produce transforming growth factor-β-1 that converts interstitial fibroblasts into activated myofibroblasts, which have the distinctive feature of α–smooth muscle actin microfilament and high active AT1R expression (21). The myofibroblasts rapidly proliferate and exert profibrotic effects, including collagen synthesis, which are mediated by AT1R stimulation (21). Our observation of a regional and temporally limited increase of AT1R-targeted tracer signal at the site of MI thus probably reflects the temporary presence of myofibroblasts and severity of the fibrogenic reaction of injured tissue. Because 11C-KR31173 has low lipophilicity, the compound is unlikely to bind to internalized AT1R. The signal thus mostly reflects the presence and density of active externalized AT1R receptor. It is tempting to speculate that a stronger expression of AT1R leads to more severe fibrotic transformation and thus to more severe geometric changes, which ultimately contribute to adverse ventricular remodeling and heart failure development. Whether early imaging of AT1R after MI can be used to predict the individual risk and severity of later remodeling and pump failure is a hypothesis that needs to be tested in subsequent studies with serial functional imaging and follow-up. Such survival studies were not included in the present project, which was targeted at the validation of the imaging signal and required animal sacrifice.
A second component of our study was an investigation into the blocking effects of different medications on myocardial AT1R expression. The intravenous injection of high-dose SK-1080, a potent AT1R antagonist that is structurally similar to 11C-KR31173, resulted in complete blockage of the tracer signal. Oral medication with valsartan, a clinical AT1R blocker that is used for the treatment of hypertension and heart failure, resulted in a partial blockage. However, no blockage was observed with enalapril, another well-established clinical anti-RAS drug, which inhibits ACE as an enzyme that converts inactive angiotensin I to active angiotensin II and thus acts upstream from AT1R. Although these results support the potential use of imaging for monitoring the efficacy of medical AT1R blockade on the myocardial tissue level, they also provide interesting insights into the pathobiology of the myocardial RAS. On the basis of multiple clinical trials and experimental animal studies, there is general agreement that both ACE inhibitors and AT1R blockers are effective in attenuating ventricular remodeling and improving outcome after MI (21,23). There is still controversy regarding the optimal use of anti-RAS medical therapy. The Valsartan Heart Failure Trial and Candesartan in Heart Failure Assessment of Reduction in Mortality and Morbidity trial suggested beneficial effects of AT1R blockers on top of ACE inhibitor therapy (3,24). On the other hand, the Valsartan in Acute Myocardial Infarction Trial and the Optimal Therapy in Myocardial Infarction with the Angiotensin II Antagonist Losartan studies failed to demonstrate an incremental effect on cardiac remodeling and outcome using a combination of AT1R blocker and ACE inhibitor, compared with either ACE inhibitor or AT1R blocker therapy alone (25,26). Dosage and timing of therapy may explain the discrepancy among these trials (27). Our study suggests that ACE inhibitors and AT1R blockers have different effects on AT1R availability and expression, which may have implications for therapeutic effectiveness.
The present data should be seen as a proof of concept that imaging might be useful for the optimization of timing and dosage of anti-RAS medication after MI, because imaging uniquely provides noninvasive information about receptor availability on the myocardial tissue level. But there are significant limitations for translating the present data into the clinical situation. First, we used drug doses that were adopted from previous publications using a rat model (28), but those doses were significantly higher than standard clinical doses. Further experimental studies using different medication doses and different timing of administrations might be useful to gain deeper insights into drug mechanisms. But more important, there are significant species differences in AT1R expression, angiotensin receptor subtypes, and response to drug action between large mammals and rodents (29,30). For translation of the imaging approach into the clinics, it is important to confirm the present results in other species.
Noninvasive imaging of AT1R expression after MI has been previously reported by Verjans et al. in a mouse model (20). The SPECT tracer 99mTc-labeled losartan was used in, this study, and proof of concept, with a modest in vivo signal from the infarct zone, was demonstrated. In contrast to 99mTc-labeled losartan, 11C-KR31173 enables PET, which has superior detection sensitivity and quantitative potential. We were able to successfully obtain in vivo imaging in our small-animal model, and the stability of our compound over time has been demonstrated in prior work. However, as is the case with many molecular-targeted tracers, nonspecific uptake by the liver may be strong, and the molecular-specific signal from myocardium may be relatively weak. The robustness of myocardial AT1R imaging in vivo will need to be confirmed in subsequent experiments in a wider array of experimental conditions. Furthermore, as mentioned, species variability needs to be carefully considered for translation of the present results to other animals and humans (29). The need for confirmatory studies in other models is further emphasized.
In vivo PET was obtained in a small group of animals only, for proof of principle. Also, static imaging was conducted at 30 min after tracer injection. This imaging time point was chosen on the basis of previous publications of biodistribution and kidney tracer kinetics (10–12). Unfortunately, blood counts and time–activity data are not available for the current rat study because of limitations regarding injected dose and volume. Serial blood sampling is difficult in rats because of the limited amount of available blood. A better description of tracer kinetics and blood metabolism is, thus, another reason for subsequent large-animal studies—for example, studies in pigs.
Finally, our ischemia–reperfusion model in the rat demonstrated mid-myocardial injury, which is different in humans, in whom injury occurs subendocardially first. A similar mid-myocardial injury pattern had been described in a mouse transient coronary occlusion model (31,32). This similarity may be due to a subendocardial network of collateralization between coronary arteries in small rodents and is another factor that needs to be considered for translation of the present results.
CONCLUSION
The present study confirms a temporal increase of AT1R expression at the site of MI in a rat model of coronary occlusion–reperfusion. The feasibility of molecular imaging of this AT1R upregulation by the PET tracer 11C-KR31173 was demonstrated, providing a foundation for subsequent studies investigating the usefulness of 11C-KR31173 PET for predicting adverse postinfarct remodeling and for monitoring and guiding drug therapy directed against the RAS.
Acknowledgments
We are grateful to Jennifer Merrill, Roselle Abraham, Michael Bonios, Takuro Isoda, James Fox, and Gilbert Green for their excellent research assistance. The precursor for C-11 KR31173 was courtesy of Dr. Sung-Eun Yoo from the Center for Biological Modulators/KRICT, Taejeon, Korea. We are also grateful to Gola Javadi for her careful editorial assistance. This project was supported in part by a 2008 Nuclear Cardiology Foundation Research Award and an American Heart Association Mid-Atlantic Affiliate Postdoctoral Fellowship Award to Dr. Higuchi. The work was also supported in part by NIH grants 1RO1HL092985, 5RO1DK050183, and 5U24CA092871-10.
- © 2010 by Society of Nuclear Medicine
REFERENCES
- Received for publication June 2, 2010.
- Accepted for publication August 30, 2010.


