


Article Figures & Data
Figures
- FIGURE 1.
Variation of spatial resolution in radial (A and B) and axial (C and D) directions. Radial spatial resolution variation is measured in center transverse slice 31 in A and in off-center transverse slice 44 in B, 1 cm away from center slice in axial direction. Axial spatial resolution variation is measured in central axial slice (r = 0 cm) in C and in axial slice 1 cm off axis (r = 1.0 cm) in D.
- FIGURE 2.
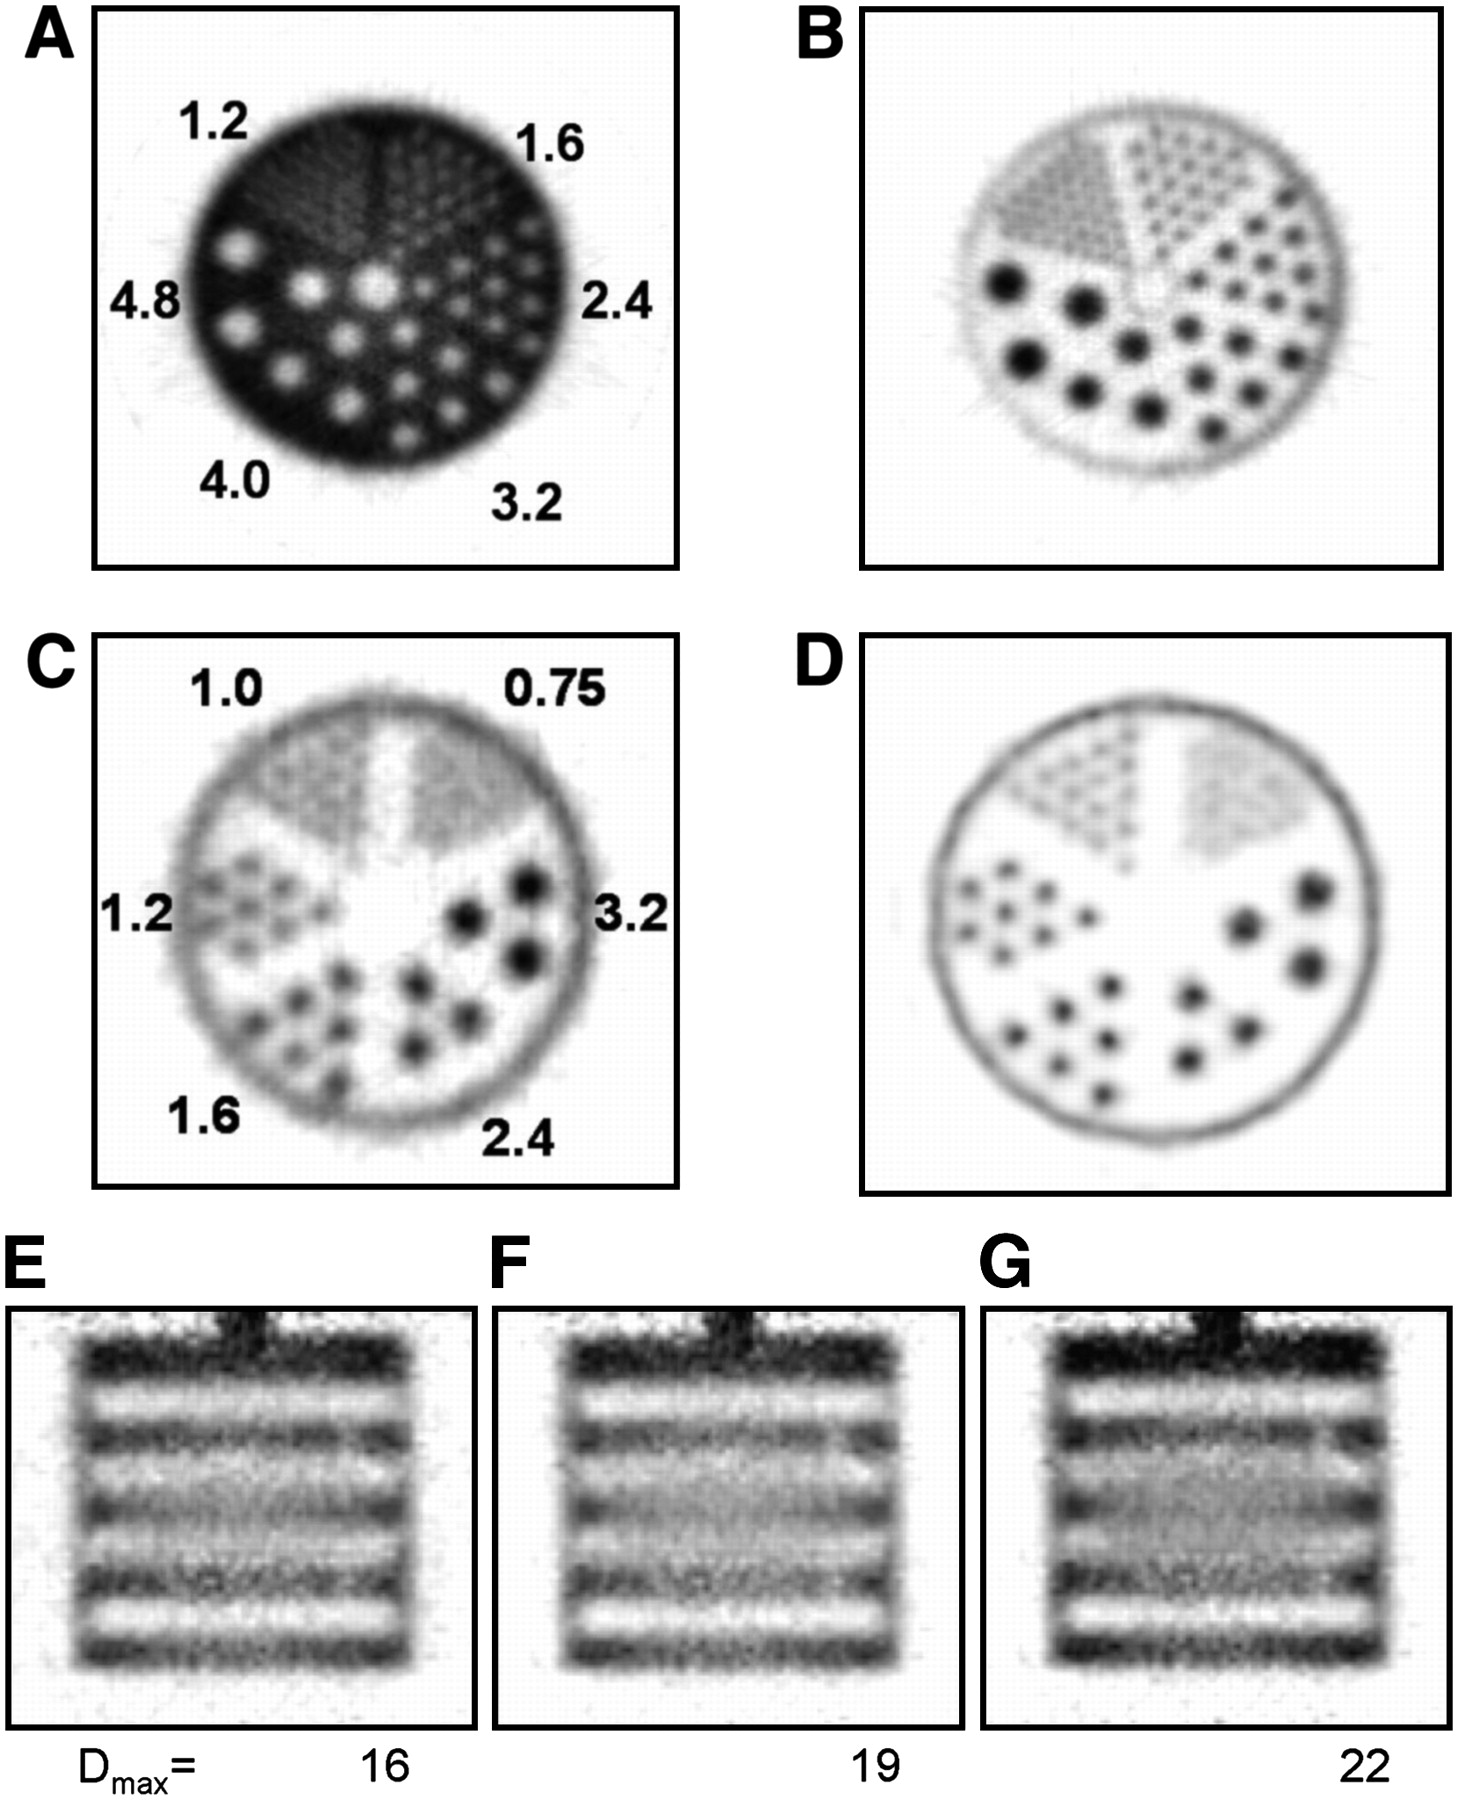
Transverse images of cold-rod (A) and hot-rod (B) microresolution phantoms reconstructed with FORE/FBP and ramp filter. Ultradeluxe microresolution hot-rod phantom images reconstructed with FORE/FBP (C) and with 3D OSEM (D). Coronal images of micro-Defrise phantom reconstructed with FORE/FBP with Dmax values of 16 (E), 19 (F), and 22 (G). Rod center-to-center spacing in A and B is twice the rod diameters shown in A, and rod center-to-center spacing in C and D is twice the rod diameters shown in C.
- FIGURE 3.
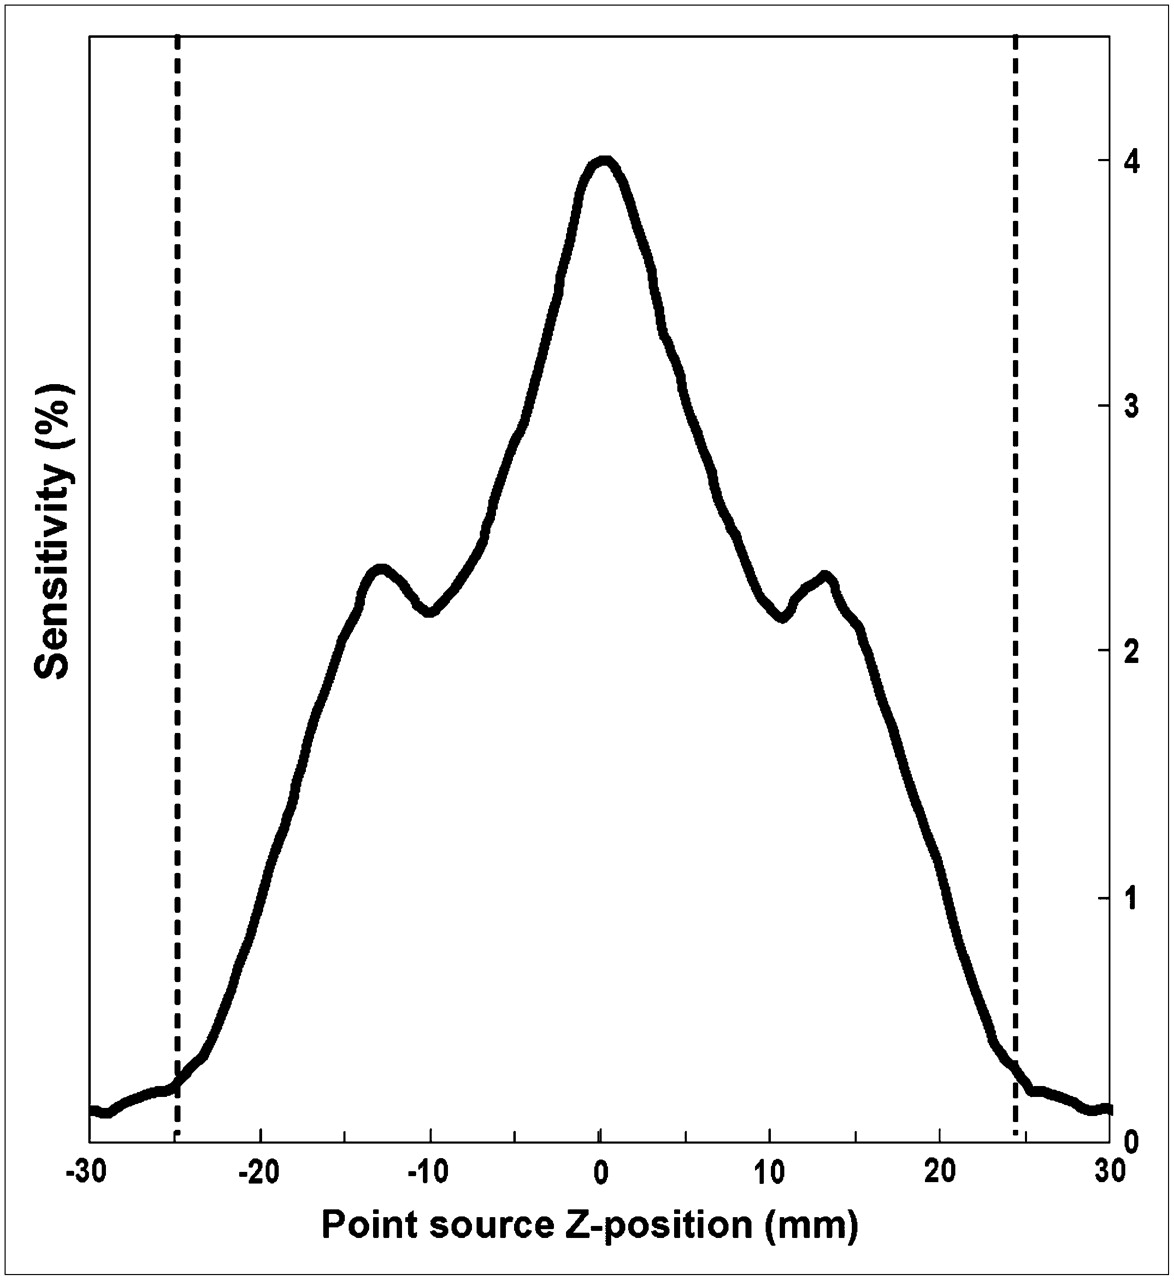
Axial sensitivity profile for VISTA. Bumps in profile are attributable to small gap between the two VISTA detector rings. Dashed vertical lines locate physical ends of axial field of view.
- FIGURE 4.
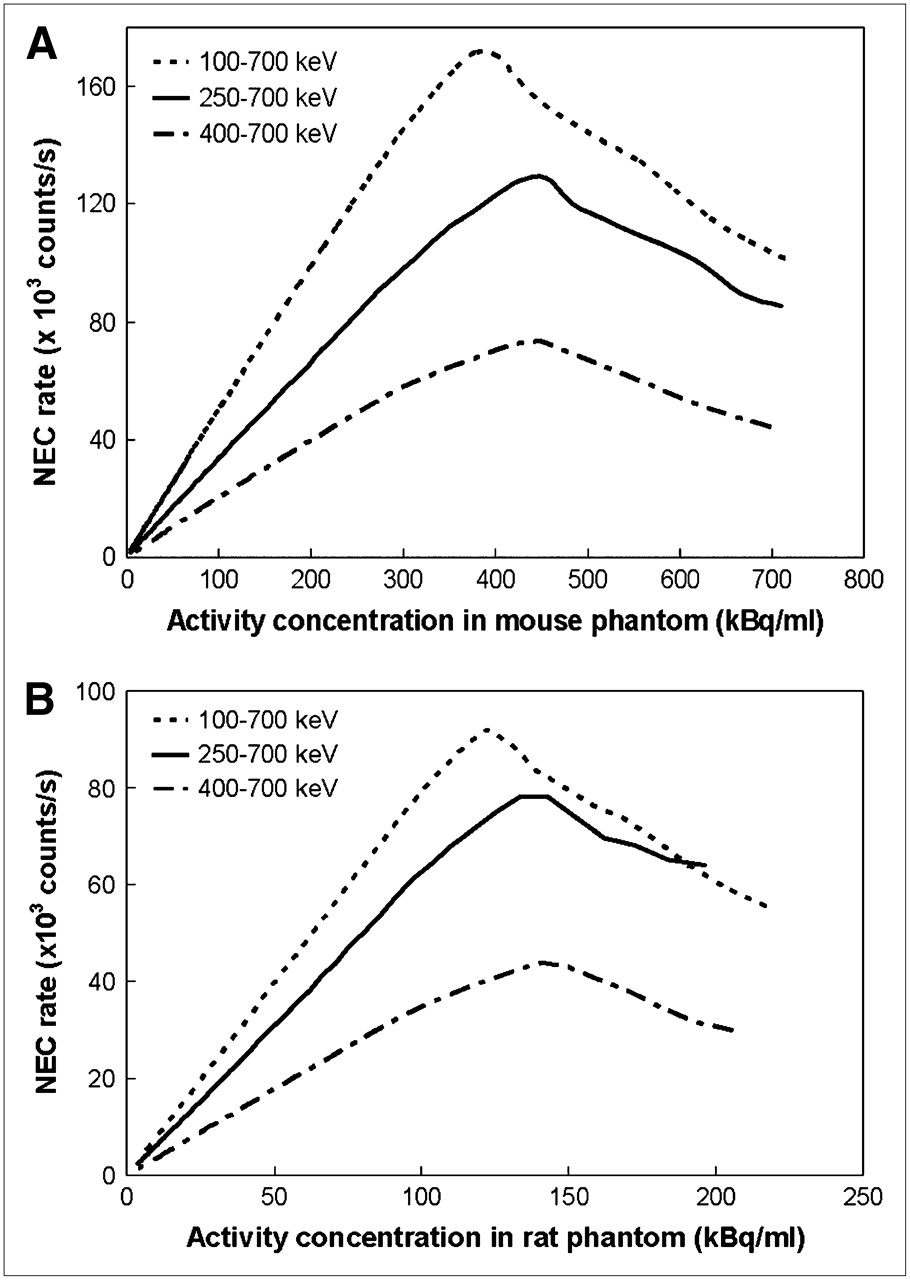
NEC rate curves for three different energy windows and two different phantoms, mouse (A) and rat (B).
- FIGURE 5.
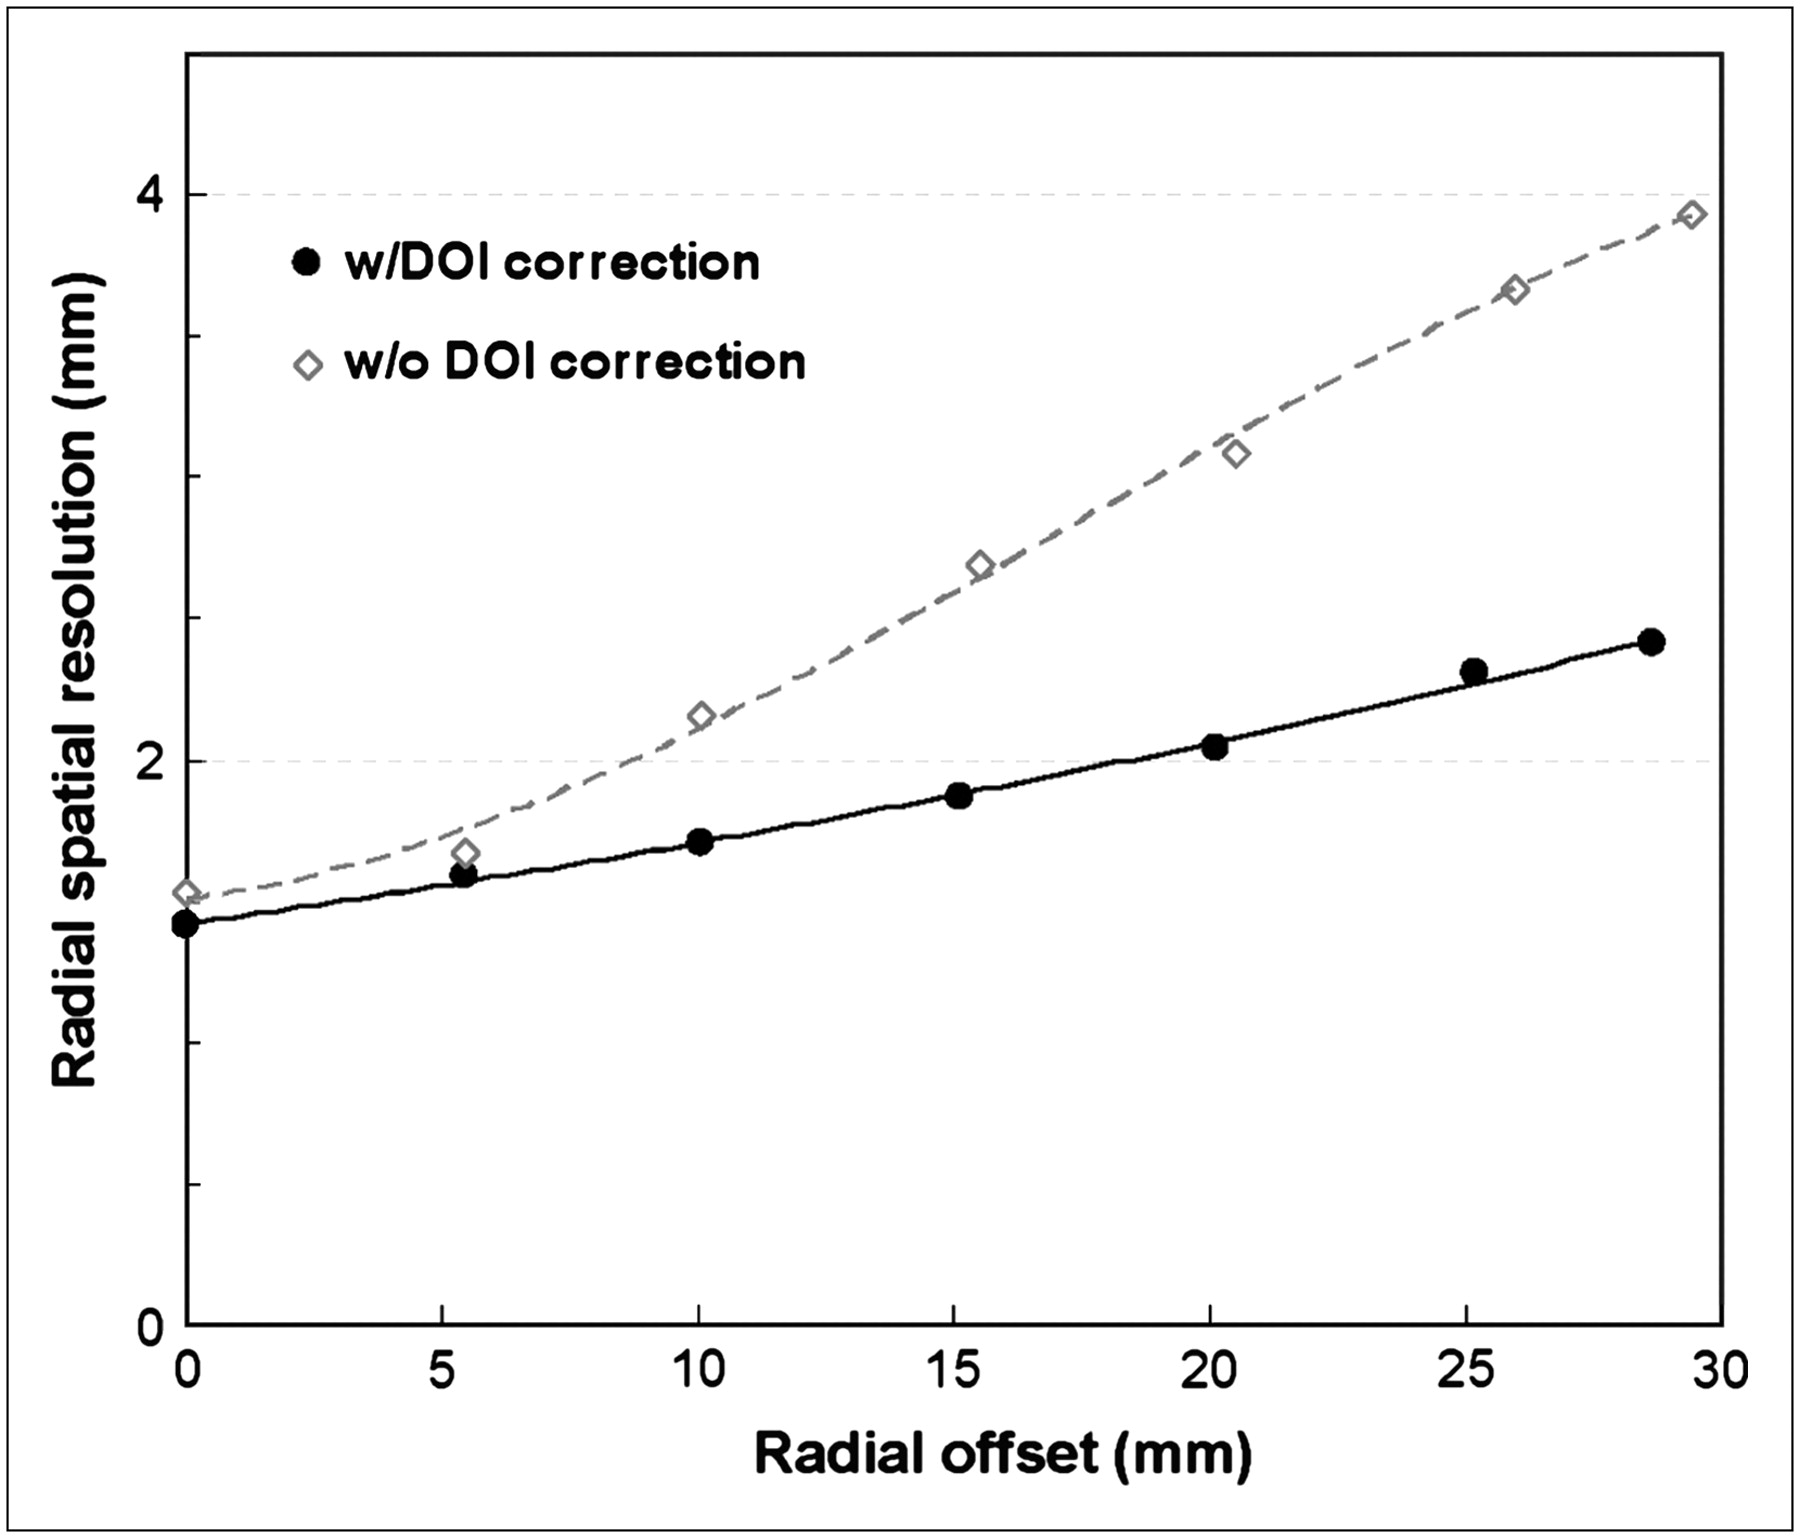
Variations in radial resolution with increasing radius when VISTA parallax correction is enabled (•) and when parallax correction is disabled (⋄), as would be the case for single-crystal type of scanner with identical geometry and 15-mm crystal thickness but no DOI capability. Note apparent displacement in radial source position between the two sets of data points as radial offset increases. w/ = with; w/o = without.
- FIGURE 6.
(Top row) The same single whole-body coronal section from an 18F-FDG mouse study (26-g mouse, ∼11.1 MBq or 0.3 mCi injected) reconstructed three different ways: FORE/FBP, FORE/2D OSEM, and 3D OSEM. (Bottom row) Maximum-intensity volume reprojections of an 18F-fluoride study (∼11.1 MBq or 0.3 mCi injected) in a 29-g mouse also reconstructed with these same three methods. The RV myocardium is seen in all three FDG reconstructions as well as the intensely labeled LV myocardium.
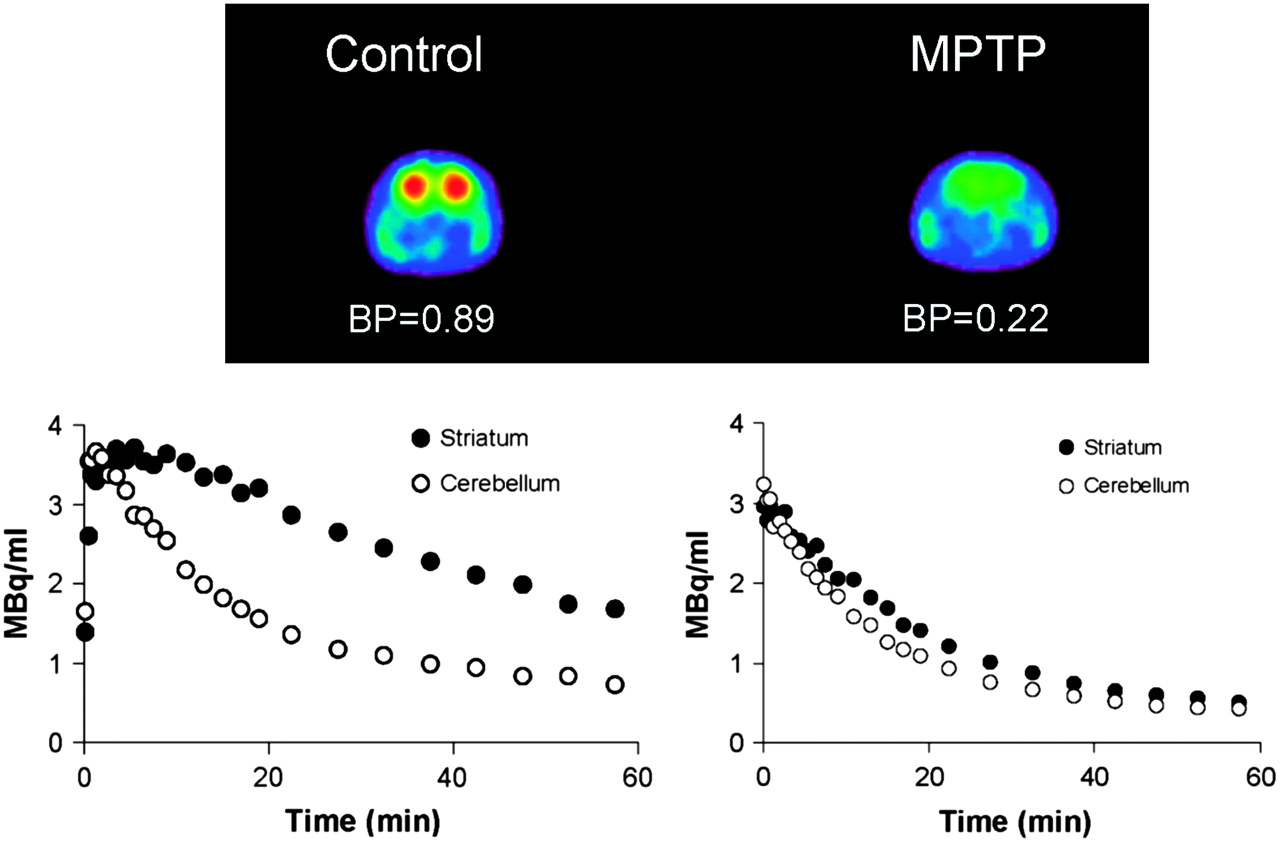
- FIGURE 7.
Transverse images of the distribution of 11C-methylphenidate (MP) in striatum of a normal 37-g control mouse (left) and a 37-g mouse (right) after treatment with 1-methyl-4-phenyl-1,2,3,6-tetrahydropyridine (MPTP), an intervention known to markedly reduce dopaminergic activity in striatum. Binding potential (BP) was derived from the striatal and cerebellar time–activity curves shown under each image. Striatal time–activity curve in the MPTP animal approaches that derived from the cerebellum, where there is little or no specific binding. Note variable frame rate data collections (high early, lower at later times) and minimal statistical fluctuations in both striatal and cerebellar time–activity curves. Both animals were injected with ∼37 MBq or 1.0 mCi of 11C-MP and imaged for 1 hour. These image data were corrected for scatter.


Tables
Item Parameter Description or value Detector modules Type of module Dual-layer phoswich (front layer: LYSO; back layer: GSO) Phoswich element dimensions 1.45 mm × 1.45 mm × 7 mm for LYSO and 1.45 mm × 1.45 mm × 8 mm for GSO (total length: 15 mm) Light decay time LYSO: 40 ns; GSO: 60 ns Phoswich element arrays 13 × 13 (outside dimensions: 20 mm × 20 mm) Phoswich pitch 1.55 mm Phototubes Hamamatsu R8520-C12 System No. of detector modules 36 (2 rings of 18) No. of phoswich elements 6,084 Total no. of crystals 12,168 Ring diameter 11.8 cm Gantry aperture 8 cm Axial field of view 4.8 cm Effective transaxial field of view 6.7 cm Normalization or transmission source 68Ge annulus Overall dimensions 121 cm wide × 151 cm high × 82 cm deep Estimated gantry weight ∼200 kg Power 120 V alternating current, <20 A Datasets Acquisition mode 3D only Total no. of lines of response 28.8 million No. of 2D sinograms 61 2D sinogram size 175 spatial samples × 128 angles 2D dataset size 5.2 megabytes Energy window (keV) ACS (%) 100–700 6.5 250–700 4.0 400–700 2.1 Scatter fraction (%) Energy window (keV) Mouse phantom Rat phantom 100–700 33.0 48.3 250–700 26.6 37.0 400–700 18.9 29.2 Mouse phantom Rat phantom Energy window (keV) Peak NEC rate (kcps) Activity concentration, kBq/mL (μCi/cc) Peak NEC rate (kcps) Activity concentration, kBq/mL (μCi/cc) 100–700 170.7 377 (10.2) 91.4 122 (3.3) 250–700 126.8 455 (12.3) 77.1 141 (3.8) 400–700 73.3 448 (12.1) 43.7 141 (3.8)


Jump to section
Related Articles
Cited By...
- [18F]Fluorocholine and [18F]Fluoroacetate PET as Imaging Biomarkers to Assess Phosphatidylcholine and Mitochondrial Metabolism in Preclinical Models of TSC and LAM
- Noninvasive PET Imaging and Tracking of Engineered Human Muscle Precursor Cells for Skeletal Muscle Tissue Engineering
- Performance Evaluation of a New Dedicated Breast PET Scanner Using NEMA NU4-2008 Standards
- Mapping Changes in Mouse Brain Metabolism with PET/CT
- Performance Evaluation of the Small-Animal nanoScan PET/MRI System
- Spatiotemporal Uptake Characteristics of [18]F-2-Fluoro-2-Deoxy-D-Glucose in a Rat Middle Cerebral Artery Occlusion Model
- Molecular Imaging of Conscious, Unrestrained Mice with AwakeSPECT
- Small-Animal PET: What Is It, and Why Do We Need It?
- NEMA NU 4-2008 Comparison of Preclinical PET Imaging Systems
- 5-(2-18F-Fluoroethoxy)-L-Tryptophan as a Substrate of System L Transport for Tumor Imaging by PET
- 3'-Deoxy-3'-18F-Fluorothymidine PET/CT to Guide Therapy with Epidermal Growth Factor Receptor Antagonists and Bcl-xL Inhibitors in Non-Small Cell Lung Cancer
- National Electrical Manufacturers Association NU-4 Performance Evaluation of the PET Component of the NanoPET/CT Preclinical PET/CT Scanner
- Stable Delineation of the Ischemic Area by the PET Perfusion Tracer 18F-Fluorobenzyl Triphenyl Phosphonium After Transient Coronary Occlusion
- Development of Small-Animal PET Prototype Using Silicon Photomultiplier (SiPM): Initial Results of Phantom and Animal Imaging Studies
- Characterization and Reduction of Noise in Dynamic PET Data Using Masked Volumewise Principal Component Analysis
- Radionuclide Imaging of Angiotensin II Type 1 Receptor Upregulation After Myocardial Ischemia-Reperfusion Injury
- In vivo Imaging of Inflammation- and Tumor-Induced Lymph Node Lymphangiogenesis by Immuno-Positron Emission Tomography
- Signal Extraction and Separation in In Vivo Animal PET Studies with Masked Volumewise Principal-Component Analysis
- A Mouse Model Characterizing Features of Vascular Dementia With Hippocampal Atrophy * Supplemental Methods
- Noninvasive Quantification and Optimization of Acute Cell Retention by In Vivo Positron Emission Tomography After Intramyocardial Cardiac-Derived Stem Cell Delivery
- Recent Advances in Small-Animal Cardiovascular Imaging
- Spatial Resolution and Sensitivity of the Inveon Small-Animal PET Scanner
- Ectopic Expression of the Sodium-Iodide Symporter Enables Imaging of Transplanted Cardiac Stem Cells In Vivo by Single-Photon Emission Computed Tomography or Positron Emission Tomography
- In Vivo PET Imaging of Cardiac Presynaptic Sympathoneuronal Mechanisms in the Rat
- A Prototype PET Scanner with DOI-Encoding Detectors
- Latest Advances in Molecular Imaging Instrumentation
- Performance Measurement of the microPET Focus 120 Scanner