


Abstract
This review concentrates on the latest advances in molecular imaging technology, including PET, MRI, and optical imaging. In PET, significant improvements in tumor detection and image resolution have been achieved by introducing new scintillation materials, iterative image reconstruction, and correction methods. These advances enabled the first clinical scanners capable of time-of-flight detection and incorporating point-spread-function reconstruction to compensate for depth-of-interaction effects. In the field of MRI, the most important developments in recent years have mainly been MRI systems with higher field strengths and improved radiofrequency coil technology. Hyperpolarized imaging, functional MRI, and MR spectroscopy provide molecular information in vivo. A special focus of this review article is multimodality imaging and, in particular, the emerging field of combined PET/MRI.
PET is a high-performance imaging technology that can image the whole-body distribution of positron-emitting biomarkers with high sensitivity. The invention of PET dates back more than 30 y. However, the acceptance of PET as a routine clinical diagnostic tool has been hampered by the need for an on-site cyclotron and a radiochemistry unit for the production of the short-lived radiotracers (1–7). With the availability of commercial radiopharmacies that supply PET probes and with the relatively broad insurance coverage for a variety of clinical indications, the number of PET centers now totals more than 2,000 worldwide.
Major technologic milestones in the development of PET include the discovery of faster and brighter scintillators such as lutetium oxyorthosilicate (LSO), gadolinium oxyorthosilicate, and lutetium yttrium oxyorthosilicate. Furthermore, the continuing development of the detectors, progressing from one-to-one scintillator–to–photomultiplier-tube (PMT) coupling (8,9) to advanced block and Anger readout schemes, helps to limit the costs of a PET scanner by providing a multiplexed readout and reduced electronic channels (10–13).
The use of faster scintillators enabled the transition from 2-dimensional data acquisitions for whole-body PET, using lead or tungsten collimators as septa (14–16), to 3-dimensional (3D) acquisitions (17). However, approximately an 8-fold increase in detection sensitivity is accompanied by an increased fraction of random and scattered photon events leading to degradation of image quality if not corrected during image reconstruction (18). This degradation effectively reduces the increase in sensitivity from a factor of 8 to approximately 5-fold. To achieve high-quality and quantitative PET data, various image reconstruction techniques have evolved (19). One simple approach is filtered backprojection, which is computationally fast but results in poor image quality if the count statistics of the available PET data are inadequate. Better image quality and improved spatial resolution are achieved by iterative methods such as ordered-subset expectation maximization or maximum-likelihood expectation maximization algorithms (20) together with a posteriori information. Iterative algorithms use the underlying physical model of the scanner to implement geometric factors and corrections for photon scatter and detector penetration (21–23). However, iterative reconstruction approaches are much more computationally intense than filtered backprojection and do not necessarily converge. Appropriate corrections for dead time, detector normalization, photon scatter, random events, and in particular photon attenuation have been developed to obtain quantitative image data.
Through the integration of these software and hardware advances, PET has matured as a technology, providing whole-body patient scans within 10–20 min with a spatial resolution of 4–7 mm in the reconstructed image. Because of its high sensitivity, the large variety of available probes, and the potential for development of new biomarkers, PET is a powerful tool for clinical diagnosis and biomedical research. An important milestone in PET has been the introduction of multimodality imaging—in particular, combined PET/CT—to provide functional and morphologic information in a single patient scan (24,25).
Although PET has invigorated nuclear medicine by initiating the field of clinical molecular imaging, MRI has also had a profound effect on the practice of radiology. The wide variety of imaging sequences, along with better soft-tissue contrast than that of CT, makes MRI an important diagnostic tool in the areas of cardiology, neurology, and oncology. In addition to the anatomic information delivered by MRI, MR spectroscopy provides spectral and therefore molecular information about tissue composition in vivo. More recently, 7- or even 9.4-T human scanners have been introduced that exhibit superb spatial resolution and a high signal-to-noise ratio (SNR). These tomographs are especially of interest for studying the physiology of the human brain using functional MRI (fMRI) to visualize and quantify blood-oxygenation-level dependency (BOLD). Another important step was the improvement in radiofrequency coil technology; in this regard, at least for the preclinical field, cryo-coils have entered the market. A current focus of MRI research concentrates on functional imaging using hyperpolarized substances such as 13C or 19F.
In vivo molecular imaging tools include PET, MRI, SPECT, and optical imaging. MRI, PET, and SPECT have demonstrated great clinical value and utility, whereas clinical applications of optical imaging are still in their infancy. All modalities play an important role in preclinical research, but there are some fundamental technical differences between clinical and preclinical imaging. Light does not propagate deeply in tissues, and therefore although whole-body imaging with optical technologies is possible for mice, it is not possible for humans. Therefore, throughout this review we will discuss each modality in the context of both preclinical and clinical applications. However, optical imaging in general, and PET and MRI in particular, have undergone the most significant technical advancements over the last few years, and we have therefore elected to focus primarily on these 2 modalities. In addition, we briefly describe the principles and advances in optical imaging and CT.
PET
Advances in PET Detector Technology
Important steps to improve PET performance have been driven by advances in γ-detector technology. The first PET images were acquired in the 1970s by using a hexagonal arrangement of 24 single sodium iodide (NaI) scintillation crystals, individually coupled to PMTs (Fig. 1). Although NaI is a nearly ideal scintillator material for detecting low-energy γ-photons in SPECT cameras, the probability of interaction is low for 511-keV γ-photons, reducing the sensitivity of the PET system significantly. In addition, compared with LSO, the relatively slow scintillation decay time of 230 ns for NaI precludes fast coincidence timing, which is desired in PET applications to reduce data contamination by random events. Nevertheless, the first PET images were successfully acquired with this setup (Fig. 1C). Significant improvements in the spatial resolution of PET images were driven not only by a higher granularity of the scintillation blocks but also by new scintillator materials yielding more light per mega–electron volt, shorter scintillation decay times, and higher stopping power. Although bismuth germanate was for many years the crystal material of choice for PET, the advent of LSO (doped with cerium) in the late 1990s provided a scintillator with a higher light yield and approximately 7 times better timing performance (Table 1) (26). Thus, LSO and its derivates such as lutetium yttrium oxyorthosilicate (doped with cerium) paved the way for fast coincidence timing thereby reducing random events and improving image quality. However, a drawback of LSO is its intrinsic background radioactivity due to the 176Lu, which can increase the singles counting rate. Although a one-to-one coupling of scintillator and light detector would be advantageous to improve the counting rate performance, energy, and timing resolution of PET (21,27,28), clinical PET scanners use a light-sharing readout that reduces the number of electronic channels, which in turn reduces PET production costs. Today's PET detector arrangements are still based on Anger readout (10,29–32) or on a block detector principle (Fig. 2). Both methods use light sharing and map many small scintillation crystals to few light detectors, in most cases PMTs. This approach results in a multiplexing factor of 16 or even higher (30–32). Here as well, the latest generation of scintillators is advantageous for improving block detector performance; brighter scintillators allow for an increase in the multiplexing factor and also for finer crystal segmentation (Fig. 3).

First prototype PET scanner (positron emission transaxial tomograph, PETT) (1). (A and B) Schematic and picture show that total of 24 crystals were arranged in hexagonal shape providing 1 transaxial image slice. (C) Image of phantom filled with activity and cold spots that could be imaged with this apparatus. (Reprinted from (171).)
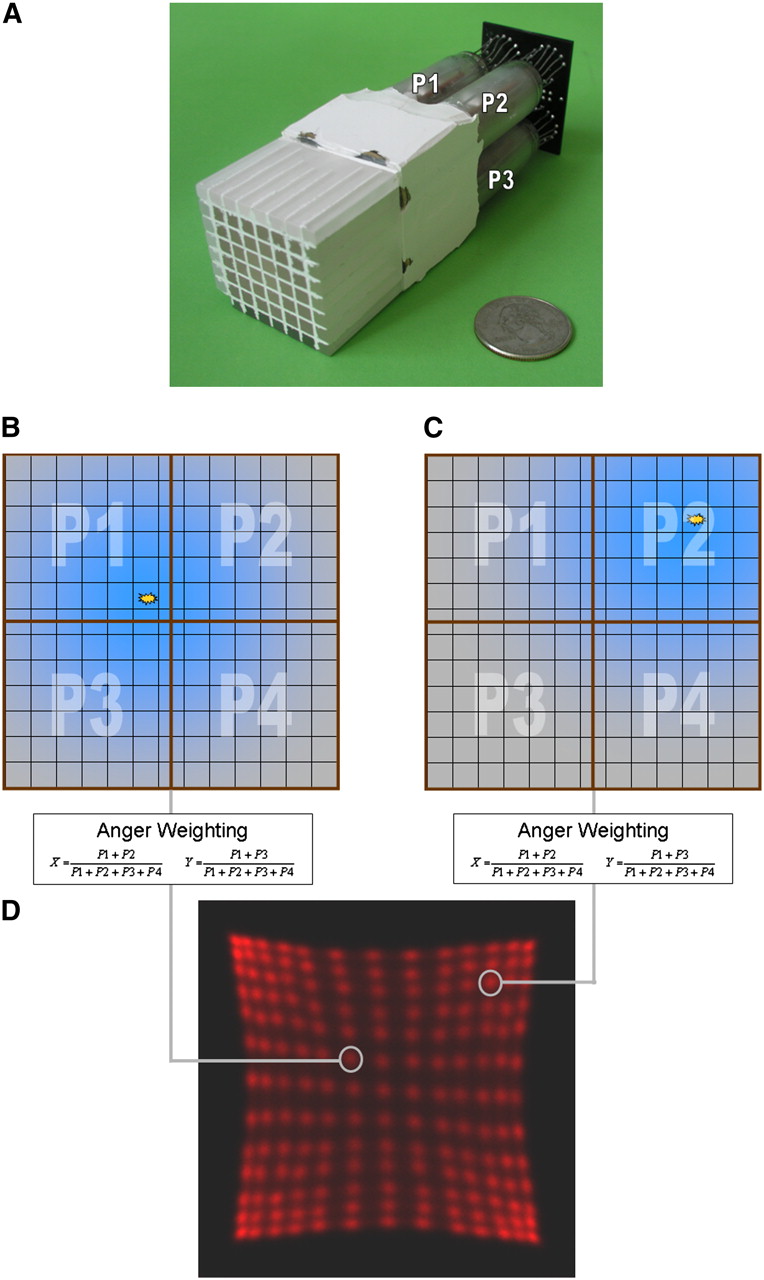
Block detector. (A) Example of PMT-bismuth germanate block detector from clinical PET scanner. Readout is performed using only the 4 PMTs that are connected to pixilated scintillator block. Light sharing is used to distribute light originating from single pixel between the 4 readout PMTs (P1, P2, P3, P4). (B and C) Depending on crystal position, light will be uniquely distributed to readout PMTs. (D) Using Anger weighting algorithm on measured signals, position of incident event can be calculated and assigned to position profile. (Courtesy of University of Tübingen.)
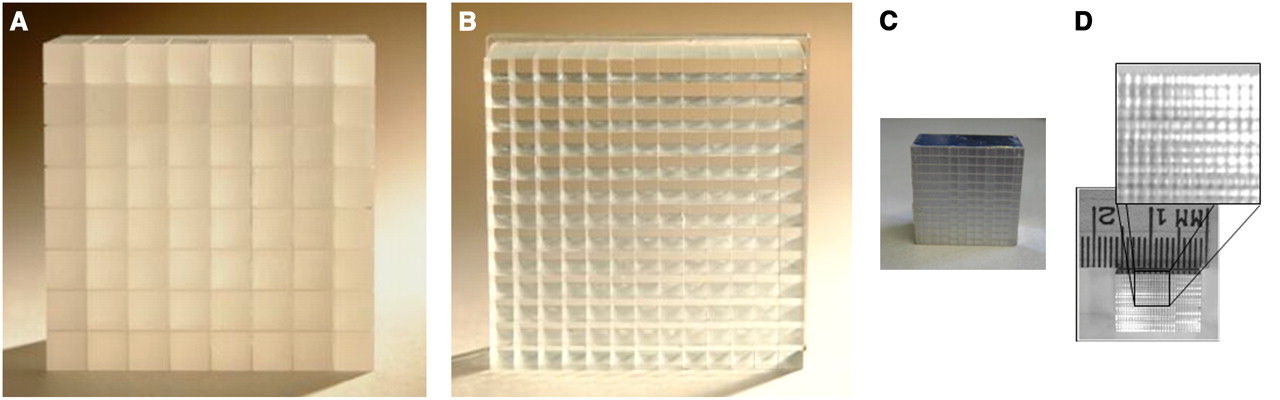
Scintillation crystal blocks for PET detectors. Size of each individual scintillator used for detector block depends on application field and defines intrinsic resolution of PET scanner. (A) Early clinical PET scanners used 6 × 6 mm bismuth germanate crystals arranged in 8 × 8 matrix. (B) Newer generations of PET systems (124) use, for instance, 13 × 13 LSO array with only 4 × 4 mm cross-sectional crystals. (C) Preclinical systems aim for spatial resolution below 1.5 mm and use, for example, 12 × 12 array of LSO scintillators with size of 1.5 × 1.5 × 10 mm. (D) New research has focused on reducing crystal pixel size to improve spatial resolution. Crystal block with crystals of only 0.43 × 0.43 mm in cross section was successfully fabricated and read out by Stickel et al. (34). (Panels A and B courtesy of Siemens Medical Solutions; panel C courtesy of University of Tübingen; panel D reprinted from (8).)
There is an ongoing discussion about the ideal crystal size. The smaller the individual crystal of a PET detector, the higher is the spatial resolution; however, smaller crystals cause the number of lines of response (LORs) in a scanner to increase, potentially leading to a statistical problem for the reconstruction if the scan time is short and the injected radioactivity remains low. However, in theory, a binning of single crystal pixels, such as those in CCD cameras, can improve the statistics per LOR at the cost of spatial resolution. A main factor limiting clinical systems from achieving higher resolution is photon noncolinearity; thus, in clinical PET scanners the pixel cross-section is still between 4 × 4 and 6.5 × 6.5 mm (30–32), whereas small-animal systems, which require a higher resolution but have a smaller field of view in the axial and transaxial directions and thus fewer LORs, have pixels about 1.5 × 1.5 mm in cross section (Fig. 3C). Feasibility studies focusing on small crystals for PET detectors have shown that, in theory, the smallest achievable resolution is on the order of 0.4 mm in the reconstructed image (33). However, resolutions beyond that are unlikely because the intrinsic physical limitations, such as positron range and noncolinearity of the annihilation γ-photons, will dominate. Detectors based on such fine pixelated crystal blocks (Fig. 4) (34) might find their way into small-animal PET or high-resolution organ-specific dedicated human scanners for breast or brain imaging but will probably not enter standard clinical systems because of the significant costs for readout and manufacturing.
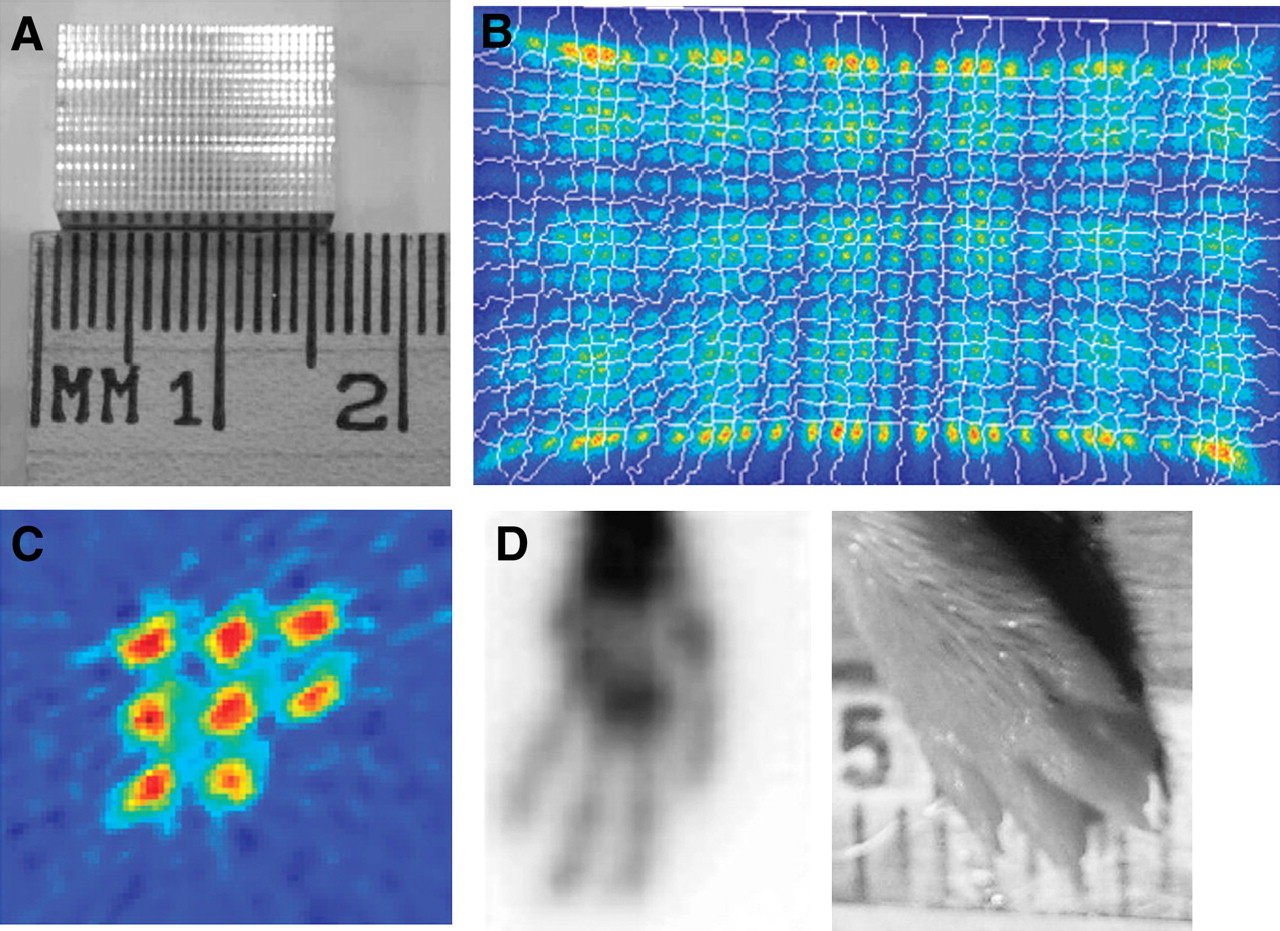
Small pixilated block detectors (8). (A) Ambition to achieve smaller resolution encouraged fabrication of LSO crystal blocks with 20 × 30 elements, each with cross-section of only 0.43 × 0.43 mm. (B) Even though crystal size is small, position profiles of block could be acquired using 64-channel position-sensitive PMT. (C and D) Two of these LSO blocks have been operated in coincidence to acquire phantom images of 0.5-mm rod source phantom (C) and mouse paw (D). (Reprinted from (8).)
The requisite for a PET detector is to provide not only good spatial resolution but also high sensitivity that minimizes both patient scan time and the injected radioactivity. The sensitivity of a PET detector can be increased by using crystals with a higher stopping power, maximizing the packing fraction, and increasing the length. Thus, in the design of a PET scanner, sensitivity and spatial resolution are often a compromise. In this respect, detector researchers are studying ways of making crystals deeper to increase the overall PET sensitivity without affecting spatial resolution. One possibility for achieving this is by detecting the depth of interaction (DOI), or the location within the crystal where the photon is absorbed. There are several potential ways of generating a DOI detector, although all these approaches are experimental and have not entered standard commercial products yet. The only exceptions are animal PET systems such as the eXplore VISTA (GE Healthcare) (35) and the LabPET (Gamma Medica) (36), as well as the high-resolution brain scanner HRRT (37) (Siemens Medical Solutions), which uses 2 layers of different crystal types stacked together—the phoswich design (Fig. 5A). In this concept, the DOI is determined electronically by analyzing the scintillation decay time of the different crystal types. Thus, the DOI is based on the interaction of the photons in the front or back crystal layer. With this approach, the number of light detectors and electronic channels does not increase. More advanced systems, which are still experimental, concentrate on resolving a continuous DOI within the entire crystal length (Fig. 5B) (38). The DOI is of particular importance for high-resolution PET scanners with a small-diameter bore, such as dedicated brain scanners or animal PET systems (11,27,39).
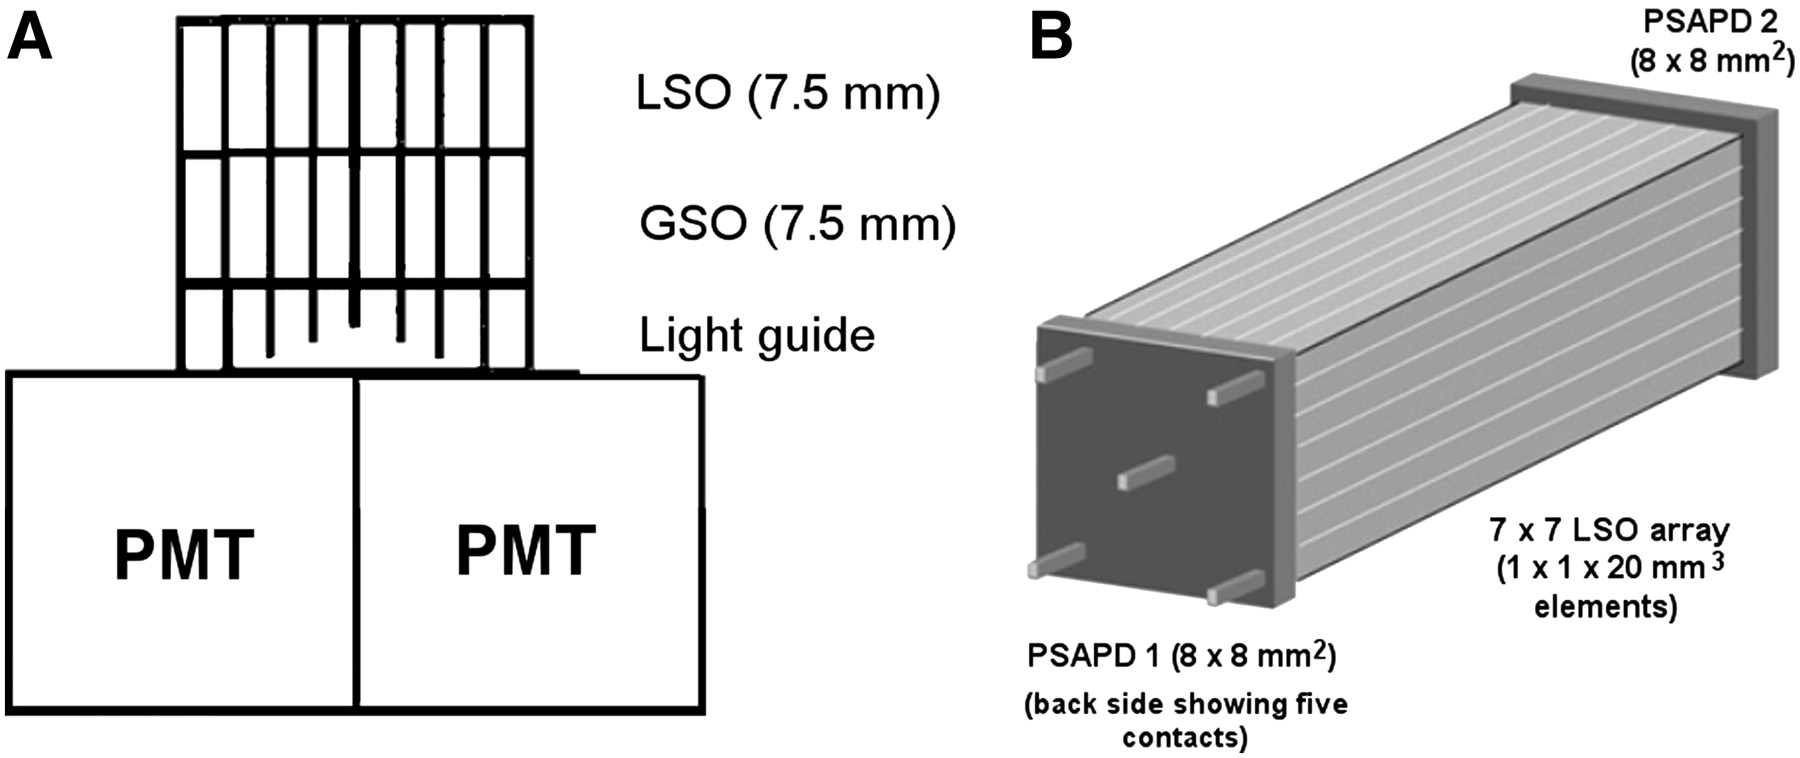
DOI schemes for PET block detectors. Different methods can be used to acquire information on location of γ-interaction in crystal. (A) One approach is a stack of 2 or more crystal layers with different scintillation properties, which allow for upper and lower crystal layer to be distinguished by discriminating different scintillation decay times. (B) Continuous DOI can be gained by reading scintillation light from both sides of scintillation crystal. In this approach, position-sensitive APDs (PSAPDs) are used to read scintillation light on each side. Comparing amount of light collected on each side of scintillator allows for calculation of DOI with resolution of 3–4 mm (26). All these approaches are challenging technologies and currently not implemented in any standard clinical PET system. (Panel A © 1998 IEEE and reprinted with permission of (172); panel B reprinted from (38).)
Although most commercial clinical and small-animal PET systems still use PMTs as light detectors, a large fraction of PET research focuses on replacing PMTs by novel semiconductor-based light detectors. The reason for still using PMTs in PET although they are bulky and relatively expensive is that they are reliable in operation and so far provide the best performance with respect to electronic noise and timing properties, when compared with all other light detectors. Avalanche photodiodes (APDs) have been the subject of intensive research for the last 15 y (3–5,40). The first evaluations of APDs in prototype small-animal PET scanners proved their feasibility as light detectors. Major advantages of APDs are their compactness, high quantum efficiency that consequently provides an energy resolution close to that of PMTs, and low bias voltage, which is a helpful feature for an inexpensive system design (Fig. 6). Over the years, the reliability and robustness of APDs have improved significantly, and now they operate for many years without performance degradation. Most important, APDs are semiconductor devices and therefore have the potential to become less expensive as the production volume increases.

Example of APD implemented as single detector with 5 × 5 mm (center) active surface and monolithic array of 9 APDs each having 5 × 5 mm active surface. Thickness of APD is only 1.5 mm, including housing. (Courtesy of University of Tübingen.)
APDs not only are compact but also are insensitive to magnetic fields (41) and therefore ideal as PET light detectors in combined PET/MRI scanners (42–45). For an integrated combination of PET and MRI, the PMT cannot be used because its function is based on electron acceleration within a high electric field in a relatively large vacuum tube. Thus, even small magnetic fields can deflect electrons from their original trajectories, leading to a loss of gain.
An interesting alternative to APDs emerged in the early 2000s, when a new generation of Geiger-mode APDs, or so-called siliconPMs (siPMs), was introduced (46). Standard APDs are based on different silicon layers in which an internal gain is built up at the p-n junction by a high electric field, accelerating free electrons, which are generated by scintillation light impacting the APD surface. The p-n junction is only several micrometers thick and therefore makes an APD a compact device. This type of APD is insensitive to magnetic fields because the free path of electrons is short; therefore, the Lorenz force has essentially little chance of deflecting them from their original path. However, APDs are more difficult to manufacture than standard semiconductors and have an increased excess noise when the active area gets larger. Also, standard APDs have a limited electronic gain of approximately 100–1,000, which is a factor of 1,000–10,000 lower than the gain of PMTs and therefore requires dedicated integrating preamplifiers. The lower gain along with the required preamplifiers results in a lower SNR and poorer timing performance for the PET detector. In sharp contrast to standard APDs, the active surface of siPMs is subdivided into small cells several micrometers in size. Each of these cells is operated in Geiger mode; this means essentially that the voltage exceeds the breakdown value at the p-n junction and in principle leads to an infinite gain. To prevent destruction of the siPM by heat, a small integrated resistor limits the maximum current. When a photon impacts a cell of the siPM, the probability is high that an avalanche process is initiated, providing an output amplitude of the electrical signal that is proportional to the number of cells fired. The gain achieved with siPMs can exceed 106. Because siPMs work in Geiger mode, each cell that detects light provides a signal amplitude independent of the number of photons detected per cell. Thus, to maintain the overall linearity of the siPM output signal, the number of cells needs to be much higher than the number of expected light photons impacting the siPM surface. In essence, siPMs provide high signal amplitudes at the output and can therefore be operated with simple preamplifiers. They are as compact as APDs and insensitive to magnetic fields. Their production is based on a standard CMOS process and thus has the potential for inexpensive mass production. A few years from now, when Geiger-mode APDs have been further researched and optimized, siPMs might drastically change current PET detector technology. They will most likely be the technology of choice for combined PET/MRI scanners and potentially also for combined PET/CT, serving as a dual detector for PET photons and CT x-rays.
In summary, the development of novel, high-sensitivity, and high-resolution PET detectors was a major step improving PET image quality with the potential ability to resolve small lesions in vivo. At the same time, immensely improved computer power, faster scintillators, and advanced electronics have helped to reduce the scanning time and the injected radioactivity dose. This in turn has made time-of-flight (TOF) PET feasible. Thus, the field of PET detector research was, and still is, a key factor for advancing clinical and preclinical PET.
Advances in PET Reconstruction Algorithms
Iterative reconstruction algorithms have replaced analysis-based filtered backprojection in most clinical and preclinical PET applications. Iterative reconstruction techniques such as maximum-likelihood expectation maximation (20,47), ordered-subset expectation maximization, or maximum a posteriori (48) reconstruction have the advantage of being able to include directly in the algorithm the detector-specific parameters of the system and models for attenuation, randoms, and scatter. The result is reduced noise and streak artifacts, well known in filtered backprojection images. In addition, iterative reconstruction is preferable on 3D PET data, especially for whole-body applications. A comprehensive review of iterative reconstruction methods can be found by Leahy and Byrne (49).
A PET detector design will always be a compromise between spatial resolution, sensitivity, and price. A major problem is that deep crystals improve sensitivity but worsen spatial resolution, especially at the edge of the field of view, when no DOI information is provided and the point spread function broadens with oblique penetration (Fig. 7). DOI can be revealed by using a more complex detector design or by including the point spread function into the reconstruction algorithm (22,23). This approach is currently being pursued by at least one manufacturer of commercial PET systems by interpolating between sinogram bins with spatially variant point spread functions for improving the resolution uniformly over the entire field of view and might help to lower the noise in the reconstructed PET images, ultimately leading to higher contrast. As for TOF PET systems, this effect is more predominant for larger patients (Fig. 8), in whom the counting rate is lower because of attenuation and the ratio between scattered and true events is unfavorable.

To achieve high sensitivity in PET system, scintillators cannot be very short because of resulting limited stopping probability for 511-keV γ-quanta. If longer crystal is used and no DOI information is available, image resolution will gradually degrade when going toward edge of field of view because LOR starts to broaden. Therefore, one has to compromise between sensitivity (long crystal) and image quality. (Courtesy of University of Tübingen.)
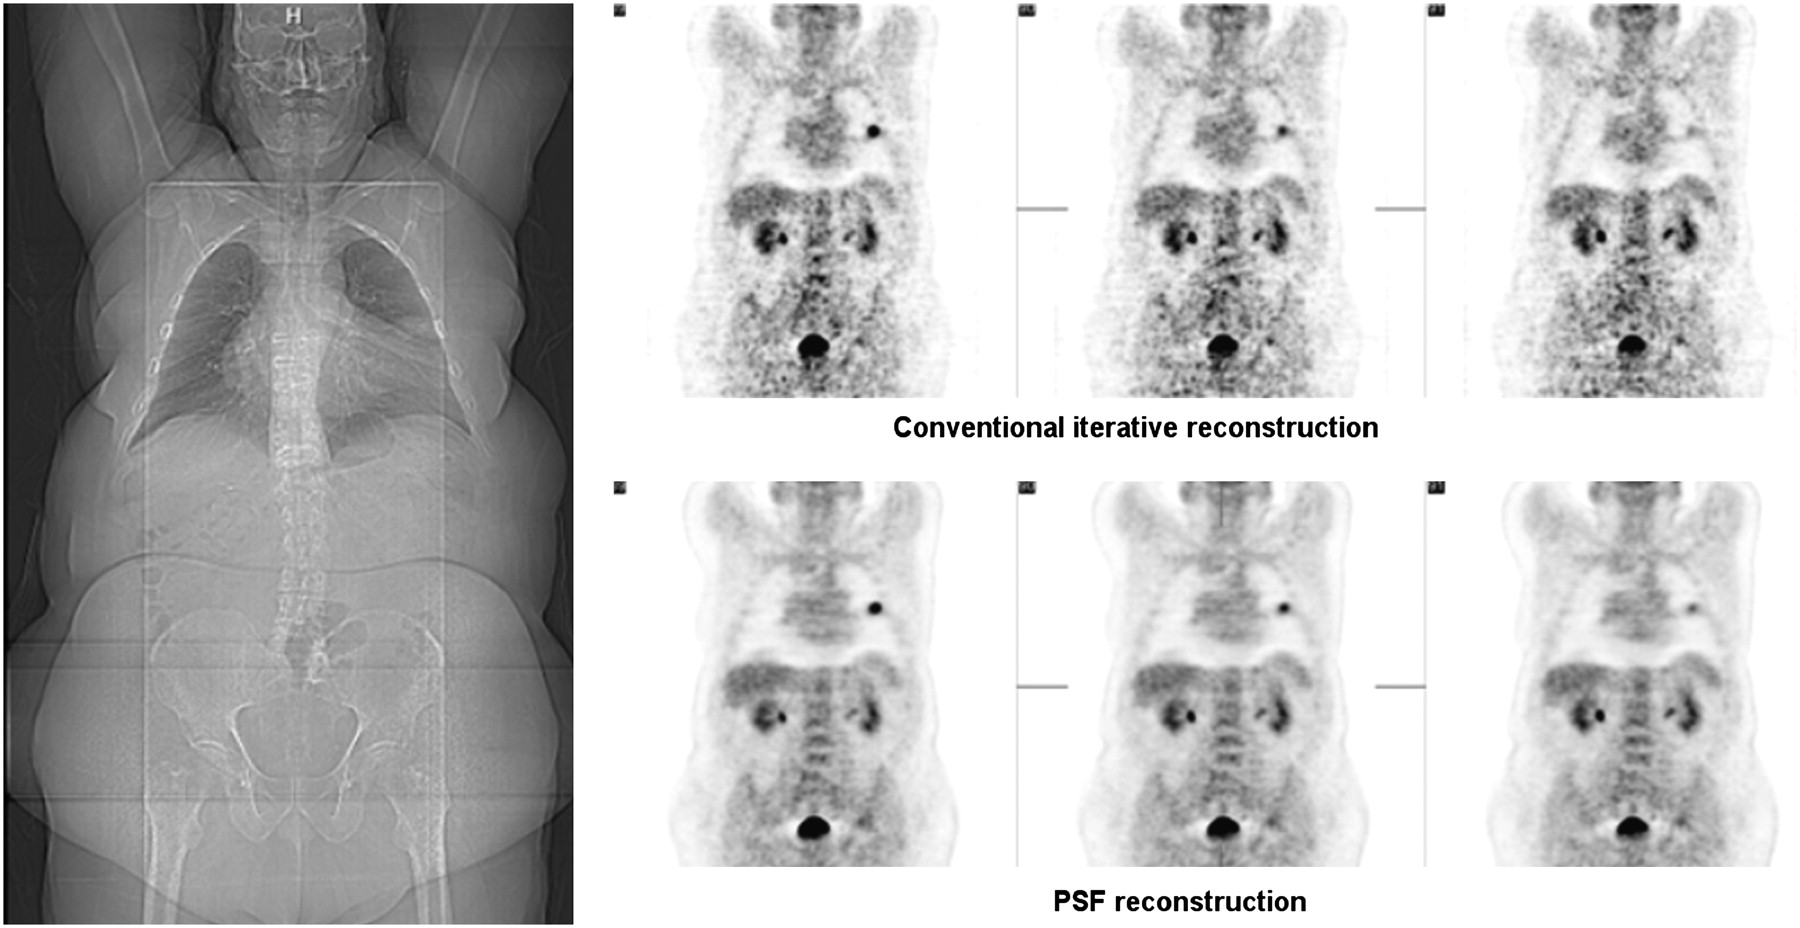
Advanced reconstruction algorithms attempt to include information about scanner geometry and properties for improving image quality. Point spread function, which is specific for a certain scanner, can be used to significantly improve image quality in terms of noise and contrast. Effect in obese patients is increased because ratio of true and random events is unfavorable. Example of patient with body mass index of 44.2 (144 kg) shows clear benefit of advanced reconstruction algorithm using point spread function. (Courtesy of Siemens Medical Solutions.)
TOF PET
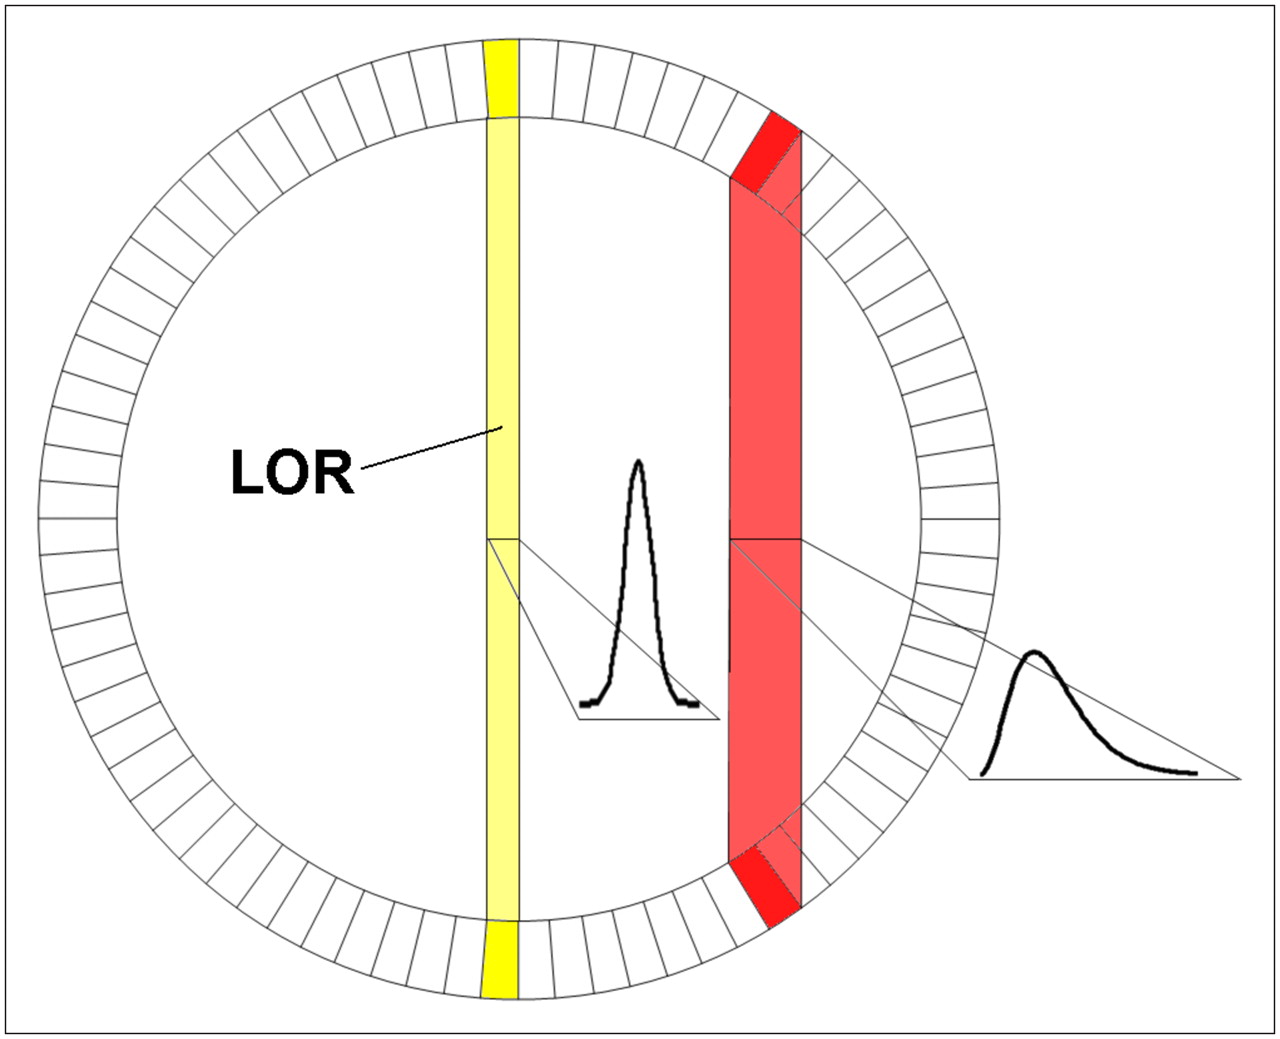
In conventional PET, once a photon from a positron electron annihilation event is detected, the preset coincidence timing window of the scanner allows a certain time in order for detection of a second coincident photon to be considered as originating from the same annihilation. This timing window is on the order of about 10 ns in standard PET scanners. Therefore, considering that the speed of light is 2.99 × 10⁸ m/s, this window does not allow for exact determination of the annihilation position. In fact, the only spatial information is derived from the position of the LOR between the 2 opposing detectors (Fig. 9). The idea of TOF PET is basically to increase the SNR of the PET images by including more accurate information about the location of the annihilation event. TOF PET is not a new concept, having been investigated in the 1980s but with moderate success. Because the scintillators investigated at that time (NaI, CsF, BaF2) either were too slow or had limited stopping power (sensitivity), the overall performance of such systems was not superior to that of conventional PET scanners (50). Also, the stability of the system for maintaining a good timing resolution over long periods was limited. A prototype TOF PET system based on BaF2 scintillators was developed and achieved a time resolution of 540 ps. With more recent improvements in PET detector technology, electronics, computer performance, and image processing, over the last few decades it became feasible to measure the arrival time of a photon in the scintillator to within a few hundred picoseconds. Thus, TOF PET was revived as PMTs with a short transit time and a fast rise time became more widespread and scintillators such as LSO or lutetium yttrium oxyorthosilicate, that have a short scintillation decay time and a high light yield, became available and cost-effective.

Ability of PET scanner to accurately measure time between 2 γ-interactions from 1 annihilation is defined as TOF capability. If no TOF information is available (time resolution > 1,500 ps), probability that coincidence occurred along 1 LOR is basically same (A). However, if time resolution can be increased (<600–800 ps), location of annihilation can be narrowed to several centimeters (B and C). In ideal PET system, where time resolution would be good (e.g., 15 ps), position of annihilation could be determined within several millimeters and would no longer require image reconstruction (D). (Courtesy of University of Tübingen.)
Theoretically, an intrinsic detector time resolution of about 15 ps would render the PET image reconstruction algorithm obsolete by identifying the location of an annihilation event to within 2 mm (Fig. 9D). However, PET detectors and electronics providing such superb time resolution are not yet available. Current clinical TOF PET systems achieve time resolutions of about 500 ps. However, the measured TOF information can be used to reduce noise by localizing annihilation events to within several centimeters (32). This is especially important for whole-body imaging of larger patients, in whom the ratio between true and scattered counts is unfavorable.
Tests with LSO scintillators show that a coincidence timing resolution down to 300 ps can be achieved with 2 single LSO crystals in coincidence (51). The improvement gained in the signal-to-noise ratio (SNRTOF) with a PET system using TOF, compared with non-TOF PET, is described by the following (52): Eq. 1
Eq. 1
In this context, a 300-ps coincidence time resolution would result in a localization uncertainty dX of 4.5 cm and thus improve the SNRTOF by a factor of 3 for a 40-cm diameter (D), compared with a non-TOF system (SNRnon-TOF). However, Equation 1 applies only to a uniform distribution of activity and not necessarily to a patient.
The potential of TOF PET lies in improving image quality in PET scans of obese patients, whereas the gain of SNR is modest for slim or normal-weight patients (Fig. 10). According to Equation 1, an improvement in SNR of 2-fold for 40-cm phantoms and 2.5-fold for 60-cm phantoms can be achieved with this system.
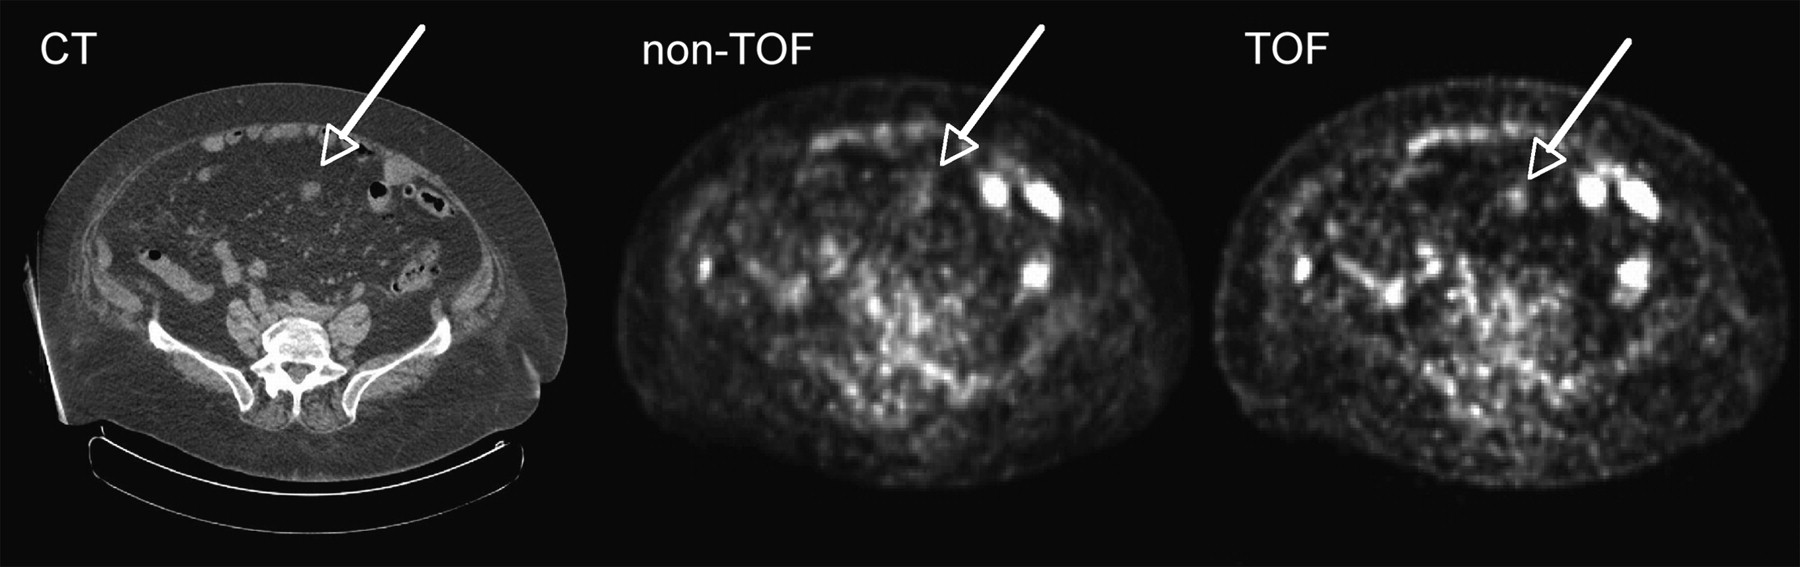
TOF PET images acquired with Phillips Gemini TF PET scanner. One can see that obese patient (119 kg; BMI, 46.5) particularly benefits from information gained because of time resolution of 600 ps. (Courtesy of Philips Medical Systems.)
Kuhn and Surti (53,54) are developing a TOF system based on a fairly new scintillator material, LaBr3, which has a scintillation decay time of only 25 ns, compared with the 40 ns of LSO, and is approximately twice as bright. However, this approach is still investigational, and its challenges include the hygroscopic characteristics of LaBr3, a stopping power less than that for LSO, and limited production capabilities (55).
CT AND PET/CT
CT is among the leading imaging modalities in clinical radiology. Although the low sensitivity of CT precludes its use beyond morphologic imaging, CT offers several advantages over other imaging modalities. First, it provides an excellent spatial anatomic resolution, in the millimeter and submillimeter range. Second, it is a fast modality allowing whole-body images to be acquired within a few seconds. These fast-acquisition protocols permit electrocardiography-gated cardiac imaging and respiration-gated chest imaging. New CT technology has moved toward more detector rows, which is an advantage for gated imaging applications such as in cardiology. Currently, the state of the art is a 64-slice CT system that can obtain a whole-body scan within a single breath-hold and allows cardiac imaging (56–61), acquiring more than 150 slices per second at a resolution below 0.5 mm. In clinical studies, devices acquiring up to 256 slices per rotation are currently under investigation (60). Another milestone is the introduction of dual-energy CT scanners. This new technology enhances image quality and improves differentiation of soft tissue and segmentation of tissue and iodine-based contrast agents. Better tissue contrast could especially improve the diagnostic value of CT in vascular diseases through early detection of calcifications (62,63).
Although stand-alone CT does not play a significant role in molecular imaging, it complements PET by providing high-resolution anatomic information (24,25,64–67). Low-resolution CT scans are routinely used for PET attenuation correction. The combination of advanced CT scanner technology, such as dual-source CT, with a PET scanner might be beneficial for reducing the radiation dose (68) and improving the accuracy of PET attenuation correction, especially when iodine-based contrast agents are applied (69).
The latest commercial PET/CT technology combines up to 64-slice CT scanners with high-resolution 3D PET systems. The PET scanners often use TOF technology or image reconstruction based on the point spread function to achieve images with low noise, the highest spatial resolution, and good contrast. Fast scintillators, electronics with high counting-rate performance, 3D acquisition modes, and large axial fields of view of up to 22 cm can reduce PET scanning times to 1 min per bed position for slim patients and up to 4 min for obese patients.
OPTICAL IMAGING
Optical molecular imaging technologies use light emitted through fluorescence or bioluminescence (70). For fluorescence imaging, excitation light penetrates tissues and reaches a targeted reporter molecule in living subjects, resulting in the emission of light of lower-energy wavelengths, which is registered by a charge-coupled device (CCD) camera. In bioluminescence imaging, light is emitted through an enzymatic reaction, most frequently involving firefly luciferase, which oxidizes d-luciferin in the presence of adenosine triphosphate and oxygen. The result is an emission of yellow-green light at a wavelength of about 575 nm. Cells expressing luciferase in vivo can be detected with a cooled, low-electronic-noise CCD camera after systemic injection of d-luciferin (71,72).
In contrast to fluorescence, bioluminescence in vivo imaging has essentially no background signal. However, because of the limited penetration of light in tissue, the large amount of photon scattering, and the need to transfect cells, neither bioluminescence nor fluorescence imaging is likely to become widely applicable in cancer patients. Absorption of fluorescence light, which is predominant at wavelengths below 600 nm and above 800 nm, is caused mainly by hemoglobin and water, 2 major constituents of living tissue. Thus, strategies are being developed to design specific imaging probes based on near-infrared fluorescence that detect lesions a few centimeters deep in tissue. Besides the optimization of biomarkers, efforts are currently focused on the improvement of optical imaging instrumentation by developing tomographic fluorescence imaging systems (73–75).
Nevertheless, some clinical applications of optical imaging are emerging. For instance, it has been used for detecting superficial malignant skin lesions. Another potential application is the detection of breast cancer, an idea that dates back more than 70 y (76) and was termed transillumination. Although tumor lesions were detectable, a clear differentiation between malignant and benign lesions was not always possible.
Important progress in in vivo optical imaging was made by introducing diffuse optical tomography, a technology based on diffuse light that penetrates tissue at multiple projections, yielding tomographic images. Diffuse optical tomography can provide quantitative information about light absorption, scatter, and uptake of fluorescence contrast agents (77). Currently, a major supplier of imaging technology is working on an advanced breast scanner based on fluorescence optical imaging (Fig. 11). This optical mammography system illuminates the breast with laser light from all sides and detects the fluorescence signal from the specific contrast agents applied. Dedicated reconstruction algorithms provide 3D images of the breast disease. This project is closely linked to a pharmaceutical company that develops specific fluorescence probes for breast imaging, indicating the importance of jointly developing imaging probes and the required technology.
Optical mammography. Optical imaging, which is widely used in field of preclinical imaging, can successfully be applied for mammography applications in which high resolution is desirable but field of view is smaller. (Courtesy of Philips Medical Systems.)
MRI
Fundamentals of MRI
MRI is well integrated in the clinical practice of radiology and oncology (Fig. 12). MRI offers superior soft-tissue contrast and resolution in the submillimeter range, but its sensitivity for detecting imaging probes is roughly 106 times lower than that of PET. This lower sensitivity often leads to the necessity of correlating functional information from PET with anatomic landmarks from MRI through image fusion. For image generation in MRI, the hydrogen nuclei, which are found in water, produce the detected signal. In some specialized MRI protocols, other nuclei (e.g., 31P, 13C, and 3He) are also used for signal formation. Unlike PET and CT, MRI does not involve ionizing radiation. In fact, no known health hazards are associated with magnetic field exposure, provided there are no ferromagnetic objects present, such as metal implants or pacemakers (78). The high soft-tissue contrast of MRI is due to the relaxation properties of the coupled nuclei in the respective tissue and the presence of contrast medium. These differences were previously exploited in 1971 by Damadian, who found that relaxation times in cancerous tissue samples from rats were longer than those in noncancerous tissue (79). MRI also allows arbitrary orientation of the imaged planes with respect to the standard anatomic orientations, enabling the imaging to focus on certain areas of interest for diagnostic purposes. Additionally, 3D scanning techniques using nearly isotropic voxels are routinely applied. Such datasets can then be resliced and used for various tasks such as tumor volumetrics, presurgical or intervention planning, radiation therapy planning, or therapy response evaluation (80).

(A) High soft-tissue contrast of MR image is apparent in whole-body MRI tomogram of human. (B) In contrast, fused PET/CT image shows mainly bone structures. Metabolic PET images (B and C) clearly depict tumor area (arrow) that appears also in MR image. Anatomic information is most prominent in MR image, whereas PET image can help to guide diagnostic focus toward abnormalities in metabolism. These abnormalities can then also be identified as structural malignancies in PET images. (Courtesy of Heinz-Peter Schlemmer, University of Tübingen.)
The enormous potential of MRI is based mainly on the variety of different contrasts that can be achieved by altering the scanning parameters, such as the echo and repetition times or the flip angle of the applied sequence. The generated images are usually either T1- or T2-weighted or have some form of mixed contrast (Fig. 12). In tumors, prolonged T1 and T2 relaxation times can be observed; these are usually attributed to a large accumulation of extracellular water as a consequence of disordered cell growth and micronecrosis. These increased T2 values tend to appear hyperintense in T2-weighted images (81). Therefore, in some cases, tumors can be identified on unenhanced images. Specifically in the field of brain imaging, MRI contrast agents are routinely applied. Most of these contrast agents use complexes of the paramagnetic element gadolinium. Gadolinium cannot be directly visualized in MR images, but it shortens T1 (and to some extent T2) relaxation times (82). When the blood–brain barrier is disrupted—such as by intracranial mass lesions—the contrast agent penetrates the damaged barrier and enters the extracellular space, giving the appearance of increased intensity on T1-weighted images. Besides providing simple enhancement of certain pathologic structures, contrast agents also offer the opportunity for dynamic studies. Using fast MRI, the time course of the contrast agent signal can be tracked, allowing for measurements of mean transit times, regional cerebral blood volume, and regional cerebral blood flow (83–85).
Beyond Anatomic MRI—Toward Functional Imaging
The potential of MRI goes beyond anatomic imaging: for instance, MR spectroscopy can be used to dissect the molecular composition of tissues (Fig. 13) by applying selective radiofrequency excitation pulses such as stimulated echo acquisition mode (86) or point-resolved spectroscopy (87,88). The Fourier transformation of the acquired signal provides a defined spectrum that allows for discrimination between various metabolites. Several studies have reported a reduction in the signal intensity of creatine and N-acetylaspartate and an increased level of the choline signal in brain tumors (89–94). The amount of tumor infiltration is proportional to the decrease in N-acetylaspartate and the increase in choline signal (95,96). Moreover, spectroscopic images of entire regions can be generated for preoperative staging of gliomas (97), pH imaging (98), monitoring of temperature (99), or evaluation of lactate changes during brain activation (100). Most of these studies are performed using 1H spectroscopy. However, other nuclei could also be used to study function; for example, 31P MR spectroscopy can be used to study the energy status of the myocardium (101).
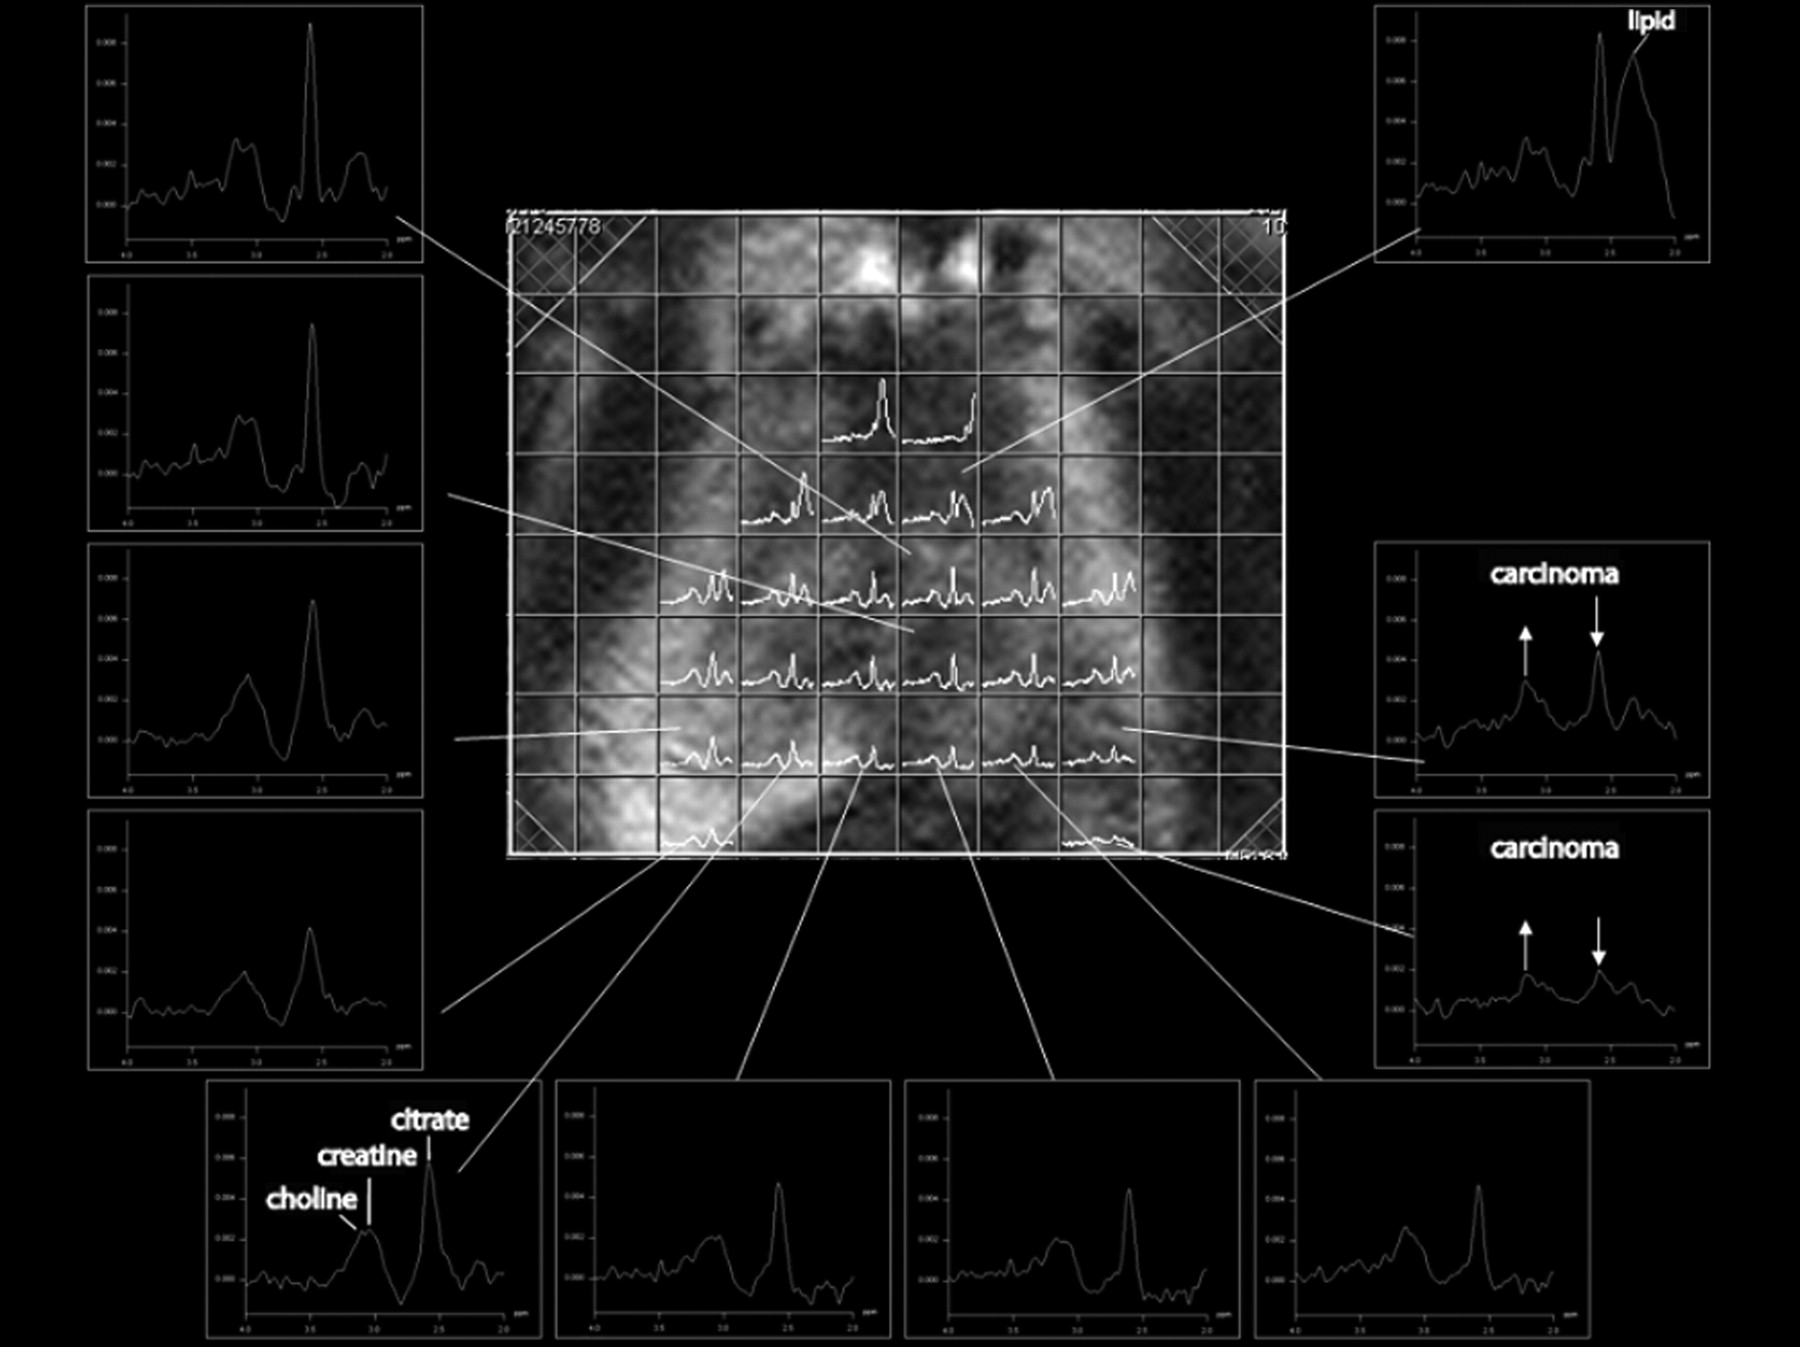
MR spectroscopy of prostate. Spectra are obtained from different voxels. Carcinogenic tissue can be differentiated by increase of choline signal and decrease of citrate signal. (Courtesy of Heinz-Peter Schlemmer, University of Tübingen.)
Because of their low abundance in humans, nonhydrogen nuclei exhibit a low SNR in MRI. However, signals can be enhanced by a technique called hyperpolarization, which involves polarizing certain nuclei, thus increasing their observed MRI signal by several orders of magnitude. For instance, 3He and 129Xe are polarized via optical pumping whereas 13C can be polarized via parahydrogen-induced polarization (102,103) and dynamic nuclear polarization (104,105). Applications of 3He and 127Xe include lung perfusion studies (106,107). For 127Xe, there are also developments toward its use as a biomarker. Here, the high specificity of biochemical interactions is combined with the high sensitivity gained from hyperpolarization (108). 13C has previously been used for MR angiography and perfusion studies in animals (109,110). New endogenous contrast agents can be formed from hyperpolarized 13C (e.g., 13C[urea]); here, the administered substance does not change the T1 or T2 relaxation time, but similar to the case with a radioactive tracer, the hyperpolarized nuclei are the source of the MRI signal. Consequently, hyperpolarized 13C can be used for metabolic mapping. In a recent study, Golman et al. injected 13C-pyruvate in rats with an implanted P22 tumor and used MRI to noninvasively map the metabolic conversion of the injected pyruvate into alanine and lactate (Fig. 14). The approach has some similarities to 18F-FDG PET studies, but despite the abundant presence of oxygen, these studies yielded the extra information that the cancer cells preferred anaerobic glycolysis (111). Through application of chemical shift imaging techniques with metabolic 13C imaging, it seems feasible to distinguish signals from 13C nuclei in different molecules—a possible advantage over PET and SPECT in some applications. A downside of hyperpolarized imaging is the relatively high costs and the rapid decay of the hyperpolarization; therefore, imaging of the injected 13C substances must take place a few minutes after administration (112).
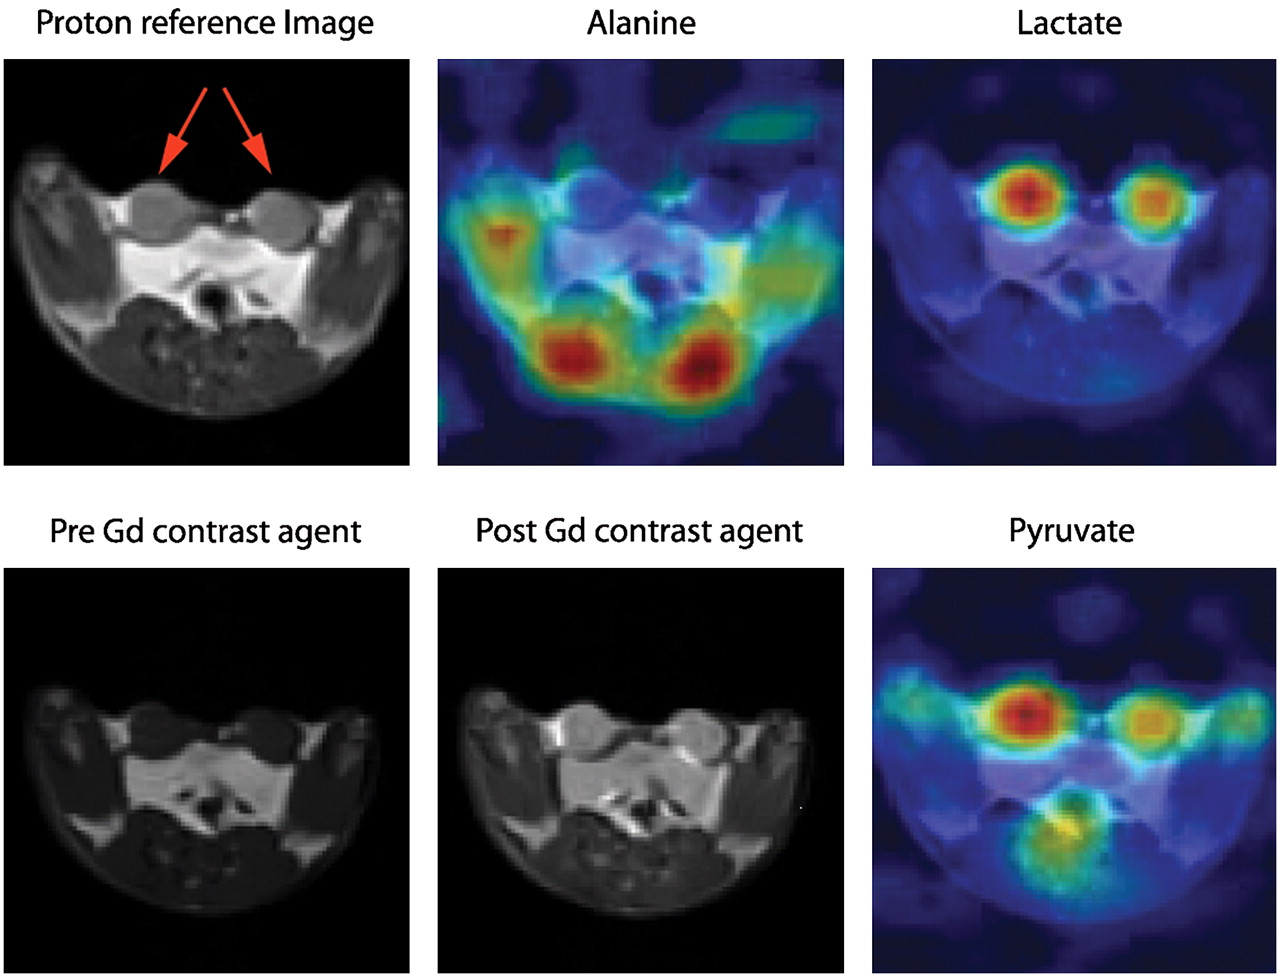
Example of hyperpolarized 13C imaging. Transverse proton reference image before and after introduction of gadolinium contrast agent in rat bearing 2 R3230 mammary adenocarcinomas (red arrows). NMR signal obtained simultaneously from alanine, lactate, and pyruvate is projected on anatomic 1H images. High alanine concentration is seen in skeletal muscle adjacent to spinal cord, and the 2 tumors are indicated by high lactate and pyruvate signals. In tumor, lactate is twice as intense as pyruvate signal; in muscle, ratio of lactate to pyruvate is 1:1. (Courtesy of Jan Henrik Ardenkjaer-Larsen, GE Healthcare.)
Functional processes in living subjects can also be studied via diffusion MRI. Here, a spatially varying magnetic field, generated by different gradients, is used to map phase differences in the MRI signal that are caused by diffusing molecules. Many MRI techniques can be made sensitive to diffusion by using adequate gradient pulses (113). Diffusion MRI has various potential clinical applications ranging from diagnosing ischemia (114), cancer (115,116), multiple sclerosis (117), or Alzheimer's disease (118) to general fiber tracking via diffusion tensor imaging (119). Diffusion imaging is not restricted to the brain; it has also been applied in other regions of the body (e.g., for oncologic diagnosis), where it provides qualitative and quantitative insight about the tumor microenvironment and the integrity of cell membranes (120). Also, the use of functional diffusion imaging for the detection of neuronal activation that may be linked to cell swelling and membrane expansion has been explored (121,122).
fMRI studies are frequently based on the BOLD contrast. This technique is based on the fact that the magnetic properties of oxygenated and deoxygenated hemoglobin in the blood are different and, therefore, produce different signals when imaged with T2*-sensitive MRI sequences. The BOLD effect was first described by Ogawa in rat brain studies (123–125) and was subsequently described in human studies (126). Unlike contrast-enhanced MRI, BOLD contrast is a noninvasive technique because it uses endogenous information. A typical fMRI experiment for brain mapping uses either a block design, in which experimental conditions are separated into distinct blocks representing stimulation and baseline scenarios, or an event-related design, in which discrete, short events whose timing and order may be randomized are presented (127,128). In both experimental types, the time course of the fMRI signal is recorded, usually with a T2*-sensitive echoplanar imaging sequence. Finally, the activation pattern is statistically extracted from the signal time course (129). BOLD fMRI is widely used for the study of different functional processes in the brain, including connections among brain regions, attention, memory, consciousness, vision, motor function, and others (130). The BOLD effect also has certain applications in cancer imaging to study tumor angiogenesis (131) or tumor oxygenation (132). In addition, it has been used for the presurgical planning of tumor resections (133).
Toward Higher Field Strengths
Today, most clinical MRI examinations are performed in field strengths on the order of 1.5 T; however, in recent years, higher magnetic flux densities from 3 to 9.4 T have been introduced. High-field MRI has the potential to improve image quality and resolution and to reduce imaging time because the SNR increases proportionally with field strength. However, several problems arise from these higher magnetic field strengths (134), initiating the first discussions about the usefulness, even for human brain imaging, of magnets exceeding 7 T. A major problem is that the applied radiofrequency signal is also proportional to the main magnetic field strength (B0); therefore, the radiofrequency wavelength for a higher B0 is reduced to dimensions that are similar to the human body. These dielectric effects lead to interferences of superimposed radiofrequency waves inside the body, which can result in an almost complete cancellation of the radiofrequency excitation in parts of the pelvis or abdomen already at field strengths of 3 T. Additionally, the amount of radiofrequency energy deposited in the body is a concern at high field strengths. Nevertheless, spectroscopy, chemical-shift imaging, and susceptibility imaging clearly benefit from the higher B0 at 3 T, compared with 1.5 T (135). Further improvement, especially of spectroscopic and fMRI, is seen at field strengths of between 7 and 9.4 T, especially when dedicated radiofrequency coils are used (136,137). At 7 T, however, signal-to-noise inhomogeneities inside the head are present (138). New techniques such as parallel transmissions that include a homogeneity correction for the radiofrequency field (B1 shimming) are used to correct for radiofrequency nonuniformities (139). These approaches may also solve some problems that arise from the higher radiofrequency power deposition at high-B0 fields. Many problems in high-field MRI might be solved by the use of techniques to receive parallel MRI signals and parallel transmissions. These techniques use the information provided by several coil elements to accelerate image acquisition and apply them during signal transmission to compensate for nonuniformities in the radiofrequency field (140,141). The dielectric effects are not as pronounced in small-animal MRI because of the smaller object size. Therefore, dedicated animal MRI systems that are suitable for mice and rats operate at B0 field strengths of between 4.7 and 16.4 T. Further improvements in image quality are to be expected by the implementation of parallel-reception and -transmission techniques, as well as cryo-coils, which are cooled with liquid helium or nitrogen and yield signal-to-noise improvements of approximately a factor of 2, compared with coils operated at room temperature (142).
Whole-Body MRI
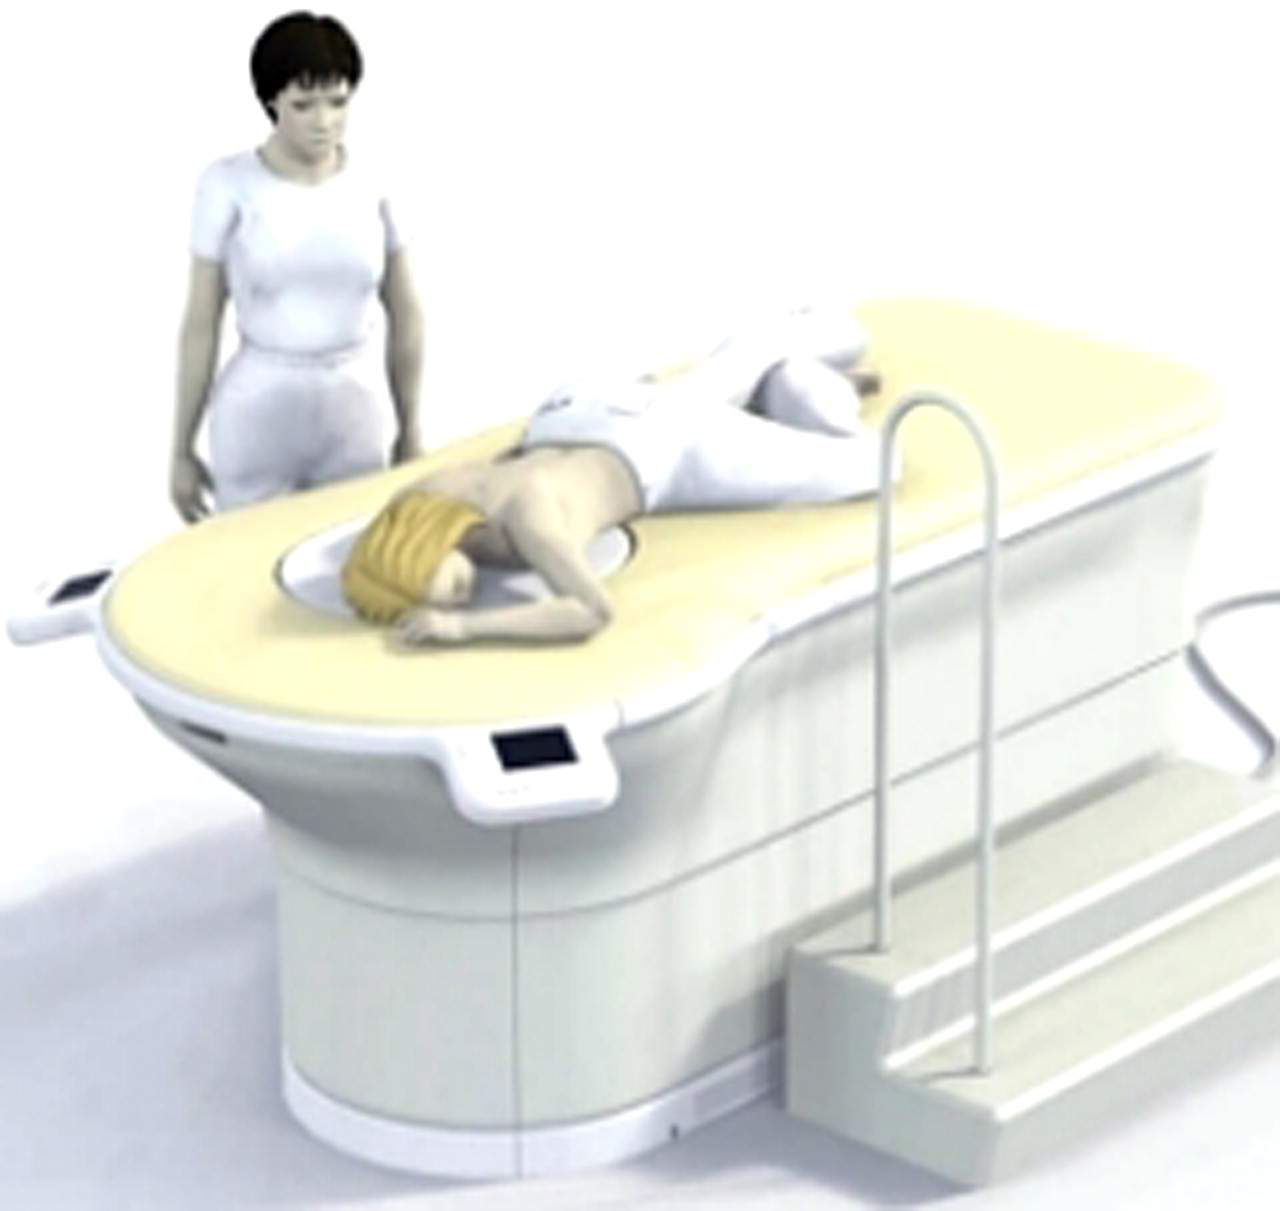
Though MRI is a diverse diagnostic modality, whole-body scans of patients were not feasible in the past because repeated examinations with patient repositioning and separate coils were needed to cover all parts of the body. The advent of parallel imaging techniques, such as generalized autocalibrating, partially parallel acquisitions (143) and sensitivity encoding (144) has accelerated image acquisition times, thus allowing whole-body MRI examinations with high spatial resolution (145). Initial results show that whole-body MRI is a promising modality in oncology, especially for the detection of metastases and hematologic malignancies (146). Performing whole-body MRI similarly to a CT examination, with continuous table motion, is likely to improve time efficiency (147).
MULTIMODALITY IMAGING: PET/MRI
We Have PET/CT—Do We Need PET/MRI?
In the late 1990s, hybrid PET/CT was introduced, a concept that was so successful (24,25,64,65,67,148) that stand-alone PET systems are almost no longer commercially available. The main shortcomings of PET/CT are based on the way this combination is realized and on the intrinsic characteristics of CT. Although the 2 modalities are hard-wired using a common patient bed in PET/CT scanners, PET/CT does not allow simultaneous acquisition of CT and PET data. Instead, the patient is first scanned by CT and then by PET. Therefore, some misalignment between CT and PET images due to patient or organ motion cannot be ruled out, potentially leading to artifacts in the fused images (149–151). In particular, the fact that CT scans are acquired quickly and PET images are acquired during an extended period of the respiratory cycle can lead to artifacts (24,152). The lack of simultaneous imaging also prevents the temporal merging of information acquired from PET and CT. Moreover, radiation doses are an inherent problem of PET/CT, although the risk for patients, if appropriately selected for imaging, is likely low (153). Finally, the soft-tissue contrast of CT images is limited, especially when no intravenous contrast agents are applied.
The development of hybrid PET/MRI systems started in the late 1990s (154). In contrast to CT, MRI offers a multitude of endogenous contrasts and a high capability of differentiating soft tissues, as well as many exogenous contrast media ranging from gadolinium-based agents to highly specified cellular markers. With a sensitivity in the picomolar range, PET is ideally suited for the visualization of specific molecules in living organisms. However, PET lacks the spatial resolution offered by MRI, which in turn lacks sensitivity. Therefore, the combination of PET and MRI is highly complementary. In contrast to CT, no additional radiation results from MRI. Furthermore, as mentioned previously, MRI has interesting functional imaging capabilities, such as perfusion, BOLD effect, diffusion, and spectroscopy. The combination of PET and MRI is feasible either in a PET/CT-like combination, in which images are obtained serially, or in a true integrated PET/MRI system that permits simultaneous scanning. The latter offers the advantage of reduced data acquisition times (because the MRI scan is performed during the PET scan) and enables dual functional imaging in which physiologic processes are studied isochronously. These advantages allow either cross-correlation studies, in which the same physiologic parameter is evaluated in PET and MRI (e.g., perfusion), or experiments in which 2 functional parameters are simultaneously evaluated. For example, this technique could monitor perfusion or tracer kinetics using PET and diffusion, spectroscopy, or the BOLD effect using MRI.
Technical Aspects
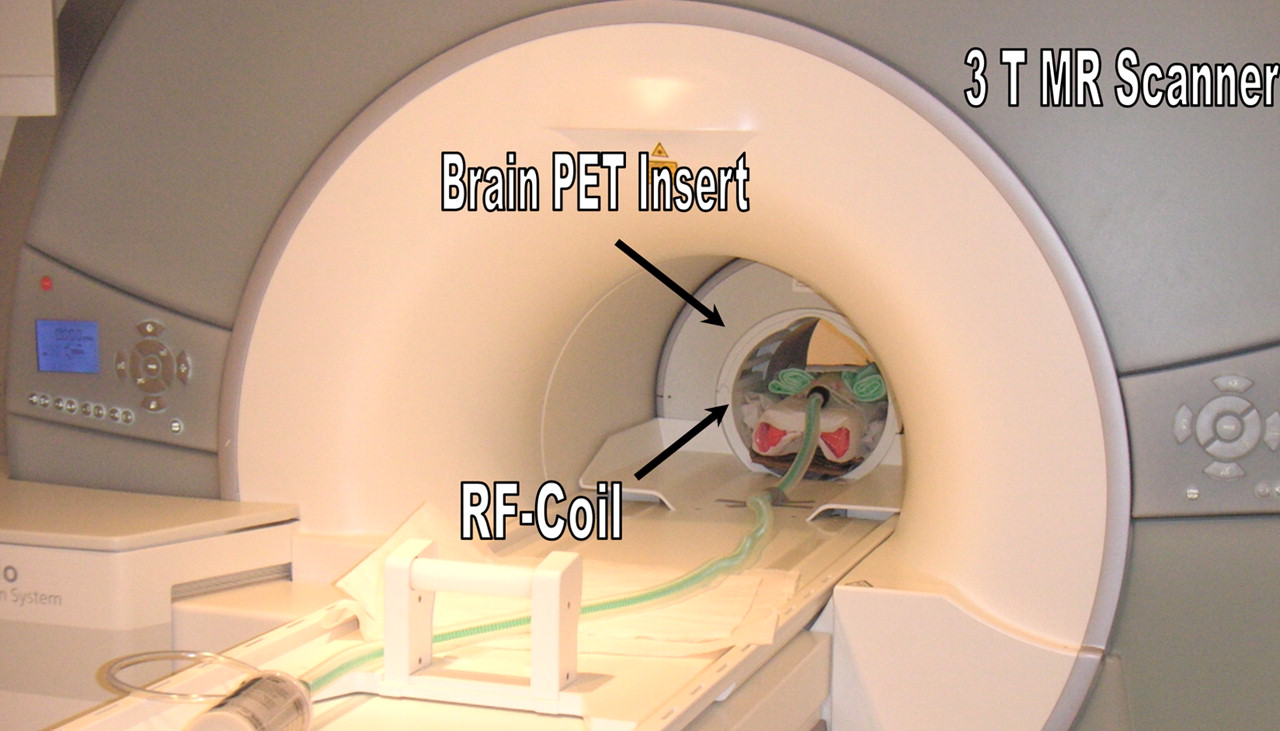
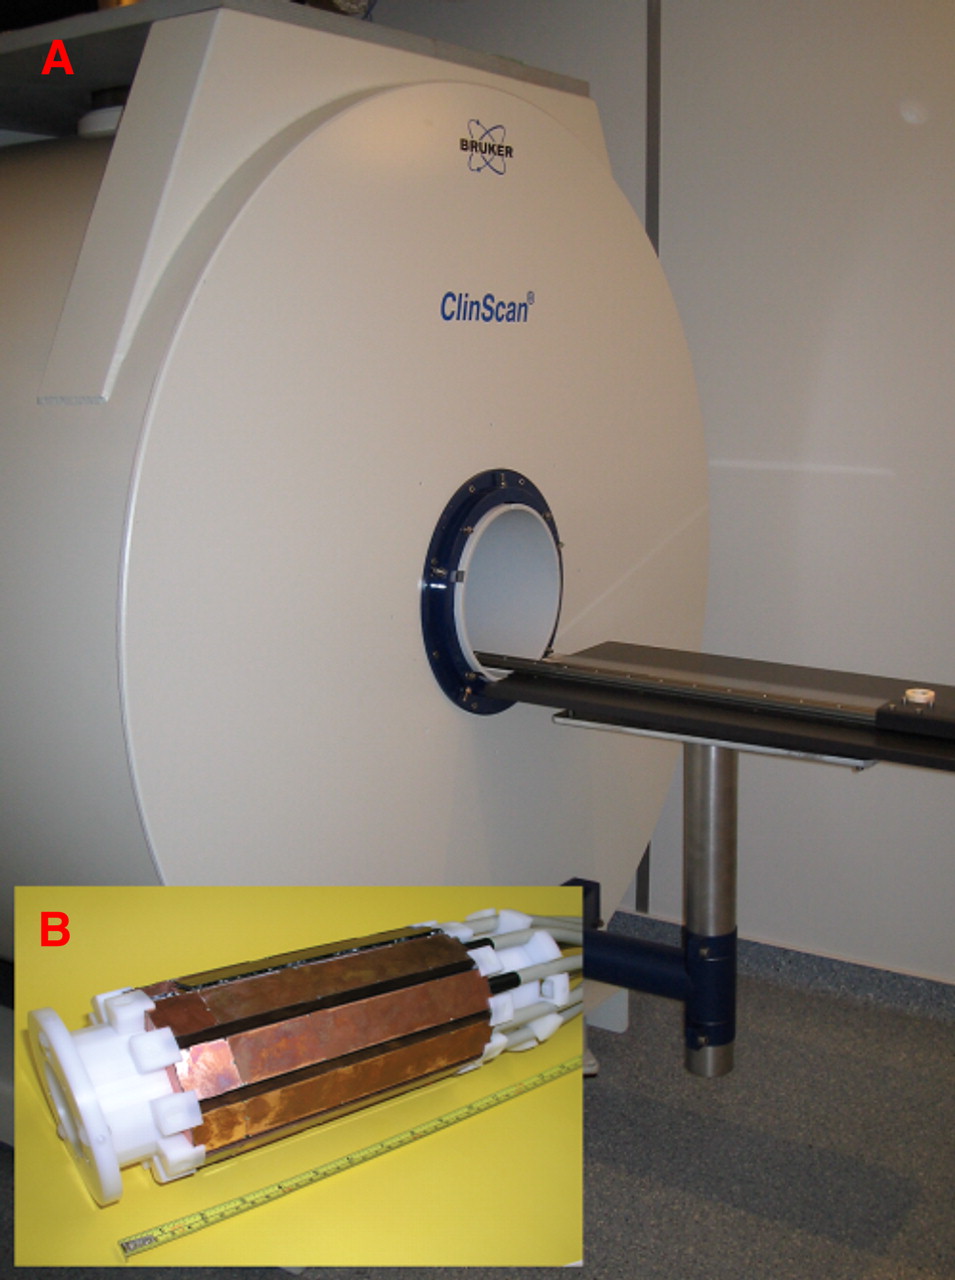
Traditional PET systems use PMTs to detect the scintillation light. However, PMTs are sensitive to magnetic fields and are therefore not functional inside an MRI scanner To overcome this problem, various approaches to the combination of PET and MRI have been established. Optical fibers can be used to lead the light from the scintillation crystals outside the fringe field of the magnet to the PMTs (154–156). Split magnets, with the PET detector between the 2 magnet halves using light fibers (157), or field cycling systems, which switch off the field of the magnet during PET acquisition (158,159), are being built. Long optical fibers, however, result in a loss of light and consequently lower performance of such a PET system. This loss can be overcome by the use of magnetic-field–compatible solid-state light detectors, such as APDs (41,45). This approach also permits easier expansion of the axial field of view of the PET system (42). In addition, an approach using both short optical fibers and solid-state light detectors has been built (43). The above-mentioned systems were first implemented in small-animal imagers, and in vivo pilot studies using these systems have been reported by various groups (42,43,155,156). Recently, an APD-based system for simultaneous PET/MRI human brain imaging was built and used to acquire the first simultaneous human PET/MRI scans (160,161) (Fig. 15). The mutual interference between PET and MRI is a critical problem; MRI can affect PET performance because of the high magnetic field, gradient fields, and radiofrequency field. MR image quality, however, can be impaired by either radiofrequency noise introduced by the PET electronics or magnetic field inhomogeneities caused by the presence of different materials in the PET insert and eddy currents induced from the gradient system in the conducting structures of the PET housing and circuit boards. Moreover, the operating temperature needs to be stabilized to ensure reliable PET and MRI performance. Overcoming these technical hurdles is a challenging but worthwhile goal. Figure 16 shows the small-animal PET/MRI system developed by our group (42,45). The 10 PET detectors are integrated in a 7-T small-animal MRI scanner. Inside the PET ring, a quadrature MRI coil is installed for MRI signal transmission and reception. The combined PET/MRI field of view is 35 mm in the transaxial direction and 19 mm in the axial direction, allowing for simultaneous PET/MRI studies in mice. Our initial results show that neither PET nor MRI performance is fundamentally impaired by this approach (42).
First installation of clinical PET/MRI system at University of Tübingen. System is dedicated for brain applications and features 3-T MRI system with dedicated head coil and PET head insert with 18-cm axial field of view. (Courtesy of University of Tübingen.)

(A) Combined PET/MRI is performed using 7-T small-animal MRI scanner with gradient strength of 300 mT/m. (B) PET insert consisting of 10 detector modules, developed and constructed by our group, is installed inside bore of magnet. Inside PET insert is placed 35-mm quadrature coil for MRI transmission and reception. Combined PET/MRI field of view is approximately 35 mm in transaxial direction and 19 mm in axial direction. Simultaneous PET/MRI studies, which allow combination of function with anatomy or of PET functional imaging with MRI functional imaging, can be performed using this system. (Courtesy of University of Tübingen.)
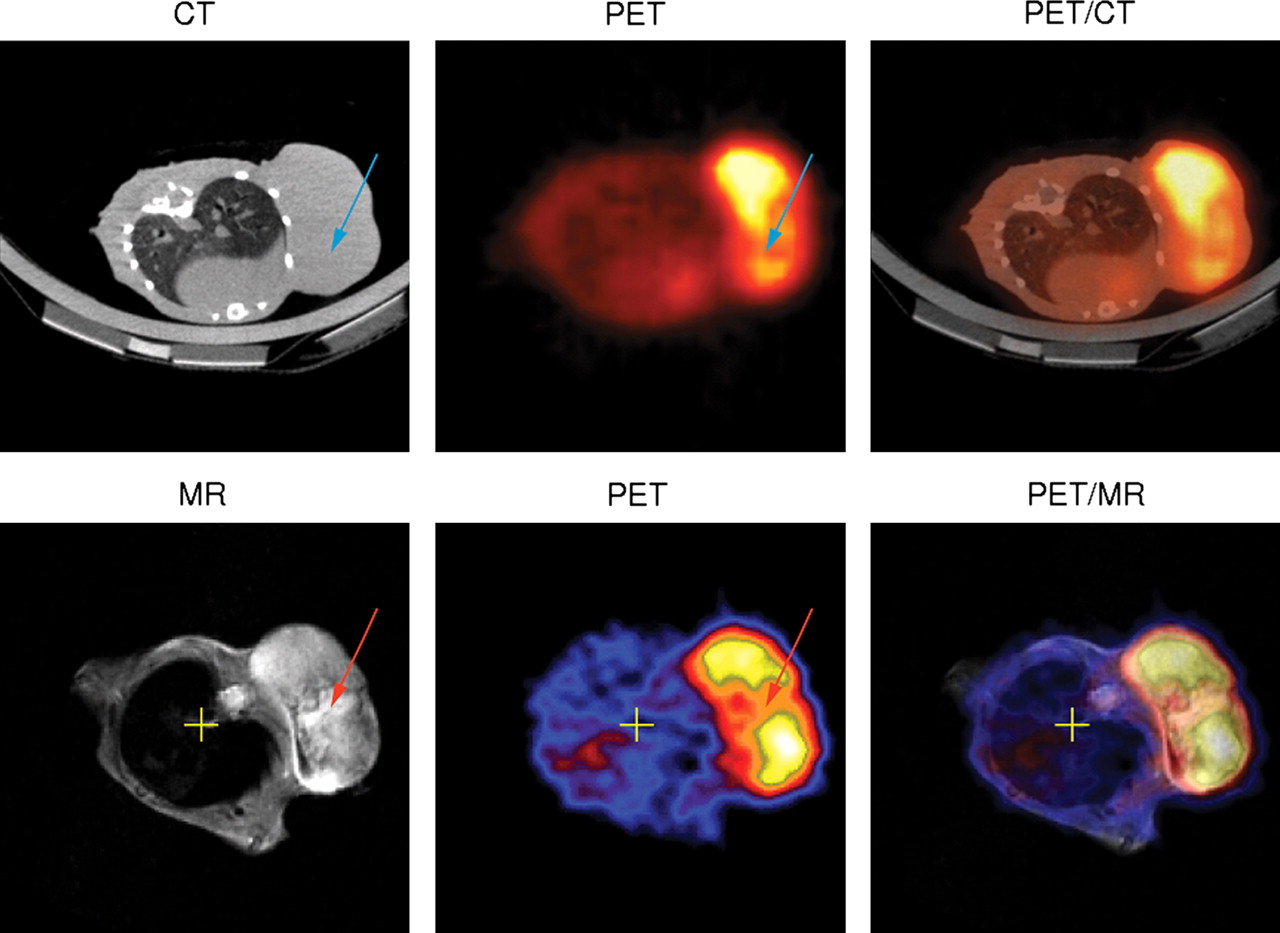
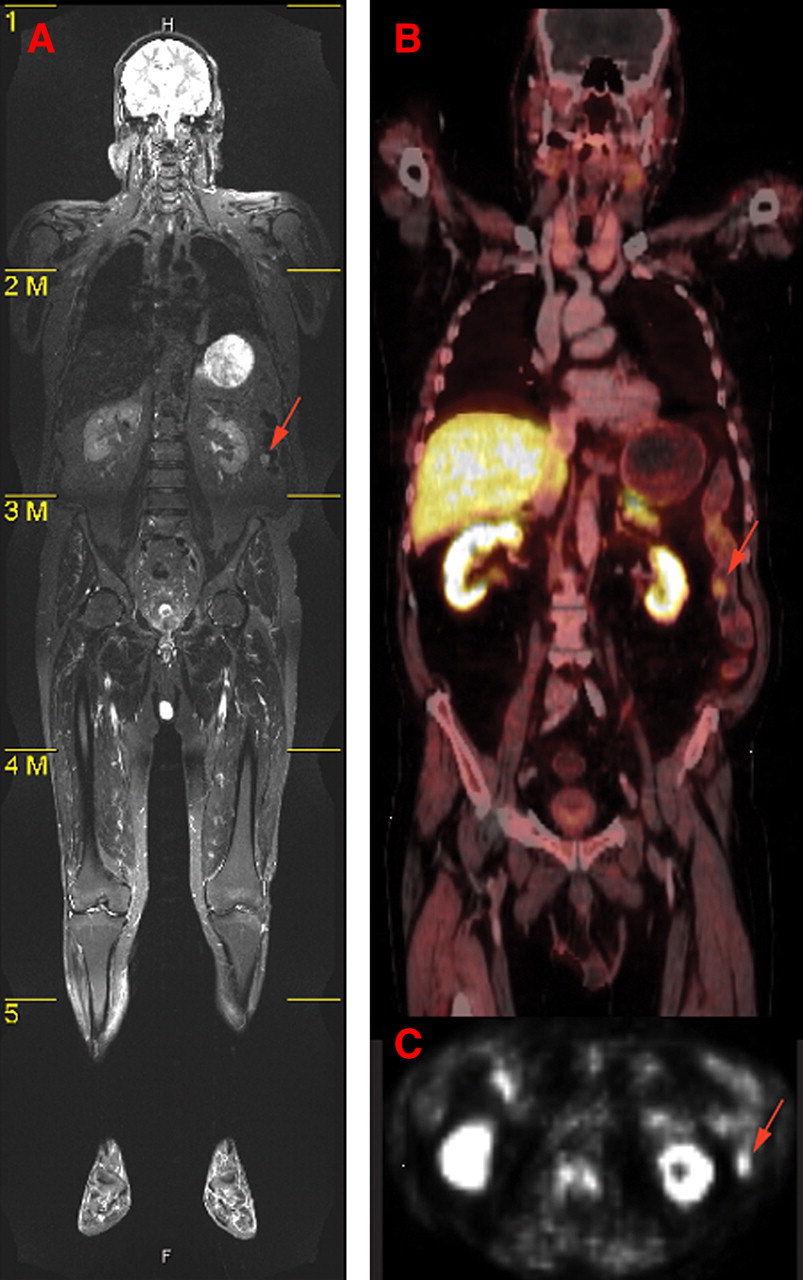
Images of 2 BALB/c mice bearing CT26 tumor. In combination PET/CT (first row), region of low tracer uptake in tumor (blue arrow) cannot be explained by CT images, because entire tumor appears as homogeneous tissue. In sharp contrast, T2-weighted MR images obtained by simultaneous PET/MRI reveal hyperintense area corresponding to area of low tracer uptake (red arrow). This is indication of tumor necrosis. From these images, one domain in which CT excels is also visible: inside lung, MR image depicts nearly no structures because of lack of signal-generating protons; in contrast, CT images reveal details of lung bronchia. (Courtesy of University of Tübingen.)
Performing PET attenuation correction with MR image information is another challenge (162). Proposed solutions have included sophisticated atlases and algorithms or are based on machine learning approaches (163). Also, special MRI sequences using ultrashort echo times to depict bone structures seem feasible as a basis for PET attenuation correction. It currently remains unclear which approach will be the most useful, and it is more than probable that a combination of different methods will be adopted.
Because the PET insert is operated inside the magnet, the spatial resolution of PET images may be improved because of the reduction of the positron range, as is especially important for small-animal systems. Particularly for high-energy positron emitters (e.g., 15O), the path the positron travels before annihilation may be reduced by the spiral movement induced by the magnetic field (164).
Motion correction of PET images based on MR images is also a viable option. Here, special MRI sequences that detect the motion of the subject can be applied by either 1-dimensional navigator scans or more elaborate techniques in 2 and 3 dimensions. Ideally, these protocols can be combined with the MRI sequence already running to provide motion information about the subject in intervals of as short as 1 s. The motion vectors can than be extracted from the motion-sensitive MRI scans and made available to the PET system, allowing either online or postacquisition motion correction of the PET images.
Applications: from Combining Function with Anatomy to Multifunctional Imaging
The original idea behind merging PET and MRI was to combine the functional information provided by PET with the high soft-tissue contrast offered by MRI. Figure 17 shows a BALB/c mouse bearing a CT26 tumor and high-resolution PET images of tumor cell proliferation that have been obtained by injection of an 18F-3-deoxy-3′fluorothymidine tracer. The morphology of the tumor areas with low tracer uptake remained unclear after evaluation of the PET images alone. Here, the MR images helped to identify necrotic regions. In contrast, only limited information about the tumor could be obtained using the CT scan of a similar mouse. Moreover brain studies benefit greatly from the additional morphologic information provided by MRI. Especially for PET quantification, a better determination of the region of interest (e.g., in the striatum) is possible from the anatomic high soft-tissue contrast of MRI. Furthermore, it seems possible to correct for partial-volume effects using accurate morphologic information (165,166).
Because it is possible, as our own studies have shown, to operate a PET system simultaneously with an MRI scanner without sacrificing the performance of either modality, the prospects for PET/MRI extend far beyond just combining function with anatomy. In the field of cardiology, the huge potential of MRI to assess cardiac function can be combined with the possibilities offered by cardiac PET; this combination would allow doctors to assess the metabolic viability of the heart muscle and its perfusion. Initial studies combining MRI spectroscopy with PET have already been performed on isolated perfused rat hearts (167), but more elaborate cardiac PET/MRI studies involving cardiac stress simultaneously assessed with PET and MRI seem feasible. Dual functional studies correlating the same parameters (e.g., perfusion in PET via radioactive water or ammonia and in MRI using spin labeling or MRI contrast agents) can help to cross correlate and validate different acquisition techniques. Using the strengths of each individual modality, one can simultaneously assess different molecular parameters. For instance, diffusion processes may be tracked simultaneously with PET tracer uptake, or PET perfusion can be correlated with the MRI BOLD effect. Because of the large number of existing PET probes and the various functional imaging capabilities of MRI, the number of possible combinations for molecular imaging readouts is virtually unlimited. The advantage of truly simultaneous PET/MRI is that the same subject is scanned at the same time with identical environmental parameters and stimuli. It is likely that such functional studies will further push the limits for basic biologic research and will open new realms for studying biology in vivo.
CONCLUSION
Molecular imaging is an emerging field that is transforming clinical in vivo diagnostics from the anatomic to the functional domain.
The latest developments in PET detector technology and PET reconstruction algorithms have resulted in high-resolution images that reveal small tumors and allow accurate quantification of biologic processes. Though optical imaging has great potential to be developed as a functional imaging modality, it might not reach the usefulness of PET or MRI in whole-body imaging because of restricted penetration and limited quantification accuracy.
Preclinical and clinical MRI applications have expanded beyond simple anatomic imaging into the domain of molecular imaging. New contrast agents and hyperpolarization techniques enhance the sensitivity of the MRI experiments, paving the way for more clinically oriented molecular imaging.
The trend has clearly gone toward functional and multimodality imaging for detecting diseases, because earlier diagnosis positively affects disease progression. A milestone in PET was the introduction of combined PET/CT. The first studies proved that PET/MRI has enormous potential as an integrated molecular imaging tool. Because of its high cost, it is unlikely to replace PET/CT in the clinical environment. However, molecular imaging research will benefit highly from the new opportunities offered by this combination. In general, the combination of different modalities such as PET, SPECT, optical imaging, ultrasound, magnetoencephalography, and CT with MRI may lead to new insights in research and novel clinical applications.
Footnotes
-
COPYRIGHT © 2008 by the Society of Nuclear Medicine, Inc.
References
- 1.↵
- 2.
- 3.↵
- 4.
- 5.↵
- 6.
- 7.↵
- 8.↵
- 9.↵
- 10.↵
- 11.↵
- 12.
- 13.↵
- 14.↵
- 15.
- 16.↵
- 17.↵
- 18.↵
- 19.↵
- 20.↵
- 21.↵
- 22.↵
- 23.↵
- 24.↵
- 25.↵
- 26.↵
- 27.↵
- 28.↵
- 29.↵
- 30.↵
- 31.
- 32.↵
- 33.↵
- 34.↵
- 35.↵
- 36.↵
- 37.↵
- 38.↵
- 39.↵
- 40.↵
- 41.↵
- 42.↵
- 43.↵
- 44.
- 45.↵
- 46.↵
- 47.↵
- 48.↵
- 49.↵
- 50.↵
- 51.↵
- 52.↵
- 53.↵
- 54.↵
- 55.↵
- 56.↵
- 57.
- 58.
- 59.
- 60.↵
- 61.↵
- 62.↵
- 63.↵
- 64.↵
- 65.↵
- 66.
- 67.↵
- 68.↵
- 69.↵
- 70.↵
- 71.↵
- 72.↵
- 73.↵
- 74.
- 75.↵
- 76.↵
- 77.↵
- 78.↵
- 79.↵
- 80.↵
- 81.↵
- 82.↵
- 83.↵
- 84.
- 85.↵
- 86.↵
- 87.↵
- 88.↵
- 89.↵
- 90.
- 91.
- 92.
- 93.
- 94.↵
- 95.↵
- 96.↵
- 97.↵
- 98.↵
- 99.↵
- 100.↵
- 101.↵
- 102.↵
- 103.↵
- 104.↵
- 105.↵
- 106.↵
- 107.↵
- 108.↵
- 109.↵
- 110.↵
- 111.↵
- 112.↵
- 113.↵
- 114.↵
- 115.↵
- 116.↵
- 117.↵
- 118.↵
- 119.↵
- 120.↵
- 121.↵
- 122.↵
- 123.↵
- 124.↵
- 125.↵
- 126.↵
- 127.↵
- 128.↵
- 129.↵
- 130.↵
- 131.↵
- 132.↵
- 133.↵
- 134.↵
- 135.↵
- 136.↵
- 137.↵
- 138.↵
- 139.↵
- 140.↵
- 141.↵
- 142.↵
- 143.↵
- 144.↵
- 145.↵
- 146.↵
- 147.↵
- 148.↵
- 149.↵
- 150.
- 151.↵
- 152.↵
- 153.↵
- 154.↵
- 155.↵
- 156.↵
- 157.↵
- 158.↵
- 159.↵
- 160.↵
- 161.↵
- 162.↵
- 163.↵
- 164.↵
- 165.↵
- 166.↵
- 167.↵
- 168.↵
- 169.
- 170.↵
- 171.↵
- 172.↵
- Received for publication March 28, 2008.
- Accepted for publication April 30, 2008.


