


Abstract
Because preclinical imaging offers challenges and opportunities, we set out to investigate and optimize image processing techniques to measure changes in mouse brain metabolism with preclinical 18F-FDG PET/CT. In particular, we considered the effects of scan length, image registration methods, image quantification methods, and smoothing during statistical parametric mapping (SPM). Methods: A cohort of 12 wild-type mice was scanned on 3 occasions at an average age of 6, 10, and 14 mo. The impact of the scan length (10, 20, 30, or 40 min) was determined, and images were registered to a template based on either the PET or the CT image. Analysis was performed using SPM or predefined regions of interest (ROIs). Data were expressed in units of standardized uptake value or percentage injected dose per gram of tissue for absolute values; images were also normalized to whole-brain activity. Results: Significant variability was observed in global brain 18F-FDG uptake between animals. Normalizing images to the whole-brain activity significantly improved detection of regional changes in metabolism. Registration based on CT images provided greater power for detecting changes in metabolism than did registration based on PET images only. In line with an age-dependent decline in brain metabolism, both ROI and SPM-based methods revealed significant changes; SPM, however, was generally more sensitive and region-specific. For example, small clusters of voxels within an ROI differed significantly between ages even in the absence of significant changes in average uptake over the whole region. Finally, and contrary to expectation, we found little benefit from longer scan times yet a marked reduction in uptake from 45 to 85 min after injection and regional variations in the rate of washout. Conclusion: With appropriate processing, preclinical PET/CT provides a highly sensitive method for reliable identification of metabolic changes in the mouse brain.
Among all noninvasive imaging techniques, PET is the most sensitive tool for studying brain function in vivo (1). It enables determination of a wide variety of processes using appropriate tracers that can be radiolabeled. The most widely used of these tracers is the fluorinated glucose analog 18F-FDG, which localizes in metabolically active tissues because it is not fully metabolized and therefore accumulates as a radiolabeled compound in an activity-dependent manner (2). Accordingly, 18F-FDG PET has been extensively applied to map changes in brain metabolism in human neurodegenerative diseases (3,4). However, back-translating these techniques into rodent models used to study brain disorders (5,6) presents significant challenges due to brain size relative to the resolution of preclinical PET scanners. Such challenges are particularly acute in mice, yet these make up most of the genetically modified models currently in use (7–9). Although the resolution of a preclinical PET scanner is around 100 times better than that of a clinical scanner in volume terms, the volume of a mouse brain is around 3,000 times lower than that of a human brain.
If a robust technique for noninvasive imaging of changes in mouse brain metabolism could be developed, it would provide a powerful tool for translational research. The ability to follow single animals or groups of animals using repeated scans should improve accuracy (by potentially reducing the effect of variability between animals) and reduce the number of animals required for studies, with the corollary of a significant lowering of costs when working with transgenic cohorts. However, attempts to measure changes in mouse brain metabolism have met with mixed results: uptake of 18F-FDG correlated well with 14C-DG uptake in normoglycemic animals (10), and 18F-FDG PET has been used to reveal metabolic phenotypes in models of epilepsy (11,12) and Alzheimer disease (13–21). However, others have failed to detect differences in mouse models of Alzheimer disease (22,23) and the question may be raised of whether phenotypes are due to different acquisition and analysis methods yielding different sensitivities in identifying neuronal alterations.
Although a clear consensus has emerged that statistical parametric mapping (SPM (24)) can be used to detect changes in 18F-FDG uptake in the human brain (25–28), there is currently no recognized gold standard in the preclinical area. Some studies applied SPM (12,17,18), whereas others examined predefined regions of interest (ROIs) (15,16,19,20,22,23). Also, although there is increasing consensus that 18F-FDG PET is a useful tool for studying rodent brain metabolism (29), there is still uncertainty over the best way to acquire and process images. For example, there are no comparative methodologic studies on optimized acquisition settings or on whether registration based on CT images offers any advantages.
Another parameter of considerable inconsistency is the units in which images are displayed. Some studies use semiquantitative measures (such as standardized uptake value, SUV, or percentage injected dose per gram of tissue, %ID/g), whereas others normalize uptake to total brain activity. For preclinical 18F-FDG PET, there is also little evidence on the best time window for acquisition, and for studies using SPM, on whether (and how much) smoothing should be applied to the images.
In this study, we addressed these issues and developed and optimized a general method for detecting changes in brain metabolism. This method was based and validated in a mouse cohort on an inbred C57BL/6 background undergoing a longitudinal study starting at age 6 mo and ending at 14 mo. The choice of this cohort is in keeping with autoradiography data, which have underlined subtle changes in 18F-FDG uptake in certain brain regions as mice age (21). However, we envisage our methodology to be more sensitive (since it measures changes in individual animals) and to be applicable to other metabolic changes related to a range of models, phenotypes, or therapy.
MATERIALS AND METHODS
Animals
We have previously described the generation and phenotypic profile of a novel Alzheimer mouse model termed PLB1Triple (17,18,30). These mice were generated on a background of C57BL/6, and all animals recorded here were wild-type offspring of that colony (PLB1WT). They were bred and maintained commercially (Harlan) and delivered to our facility 2 wk before the first recording, where they were housed under standard conditions in colonies (2–4 animals per cage) with free access to water and food on a 12-h:12-h day–night cycle. Food was withheld overnight before imaging.
A total of 12 PLB1WT mice (8 male and 4 female) were scanned on 3 separate occasions at the average age of 6.3 ± 0.5 mo, 10.6 ± 0.6 mo, and 14.4 ± 0.8 mo, respectively, referred to as the 6-, 10-, and 14-mo groups (Table 1). All experiments were performed in accordance with Home Office regulations and followed the guidelines on the ethical use of animals from the European Communities Council Directive (86/609/EEC).
Details of Mice Used
PET/CT Imaging
Apparatus and Registration
Imaging was performed using an Argus (Sedecal) dual-ring PET/CT scanner (formerly known as eXplore Vista; GE Healthcare), which contains 2 rings of phoswich detector modules giving a transaxial field of view of 6.7 cm, an axial field of view of 4.8 cm, a resolution of 1.4 mm, and a sensitivity of 4% at the center of the scanner with the 250- to 700-keV energy window used in this study (31). The integrated CT comprises a flat-panel detector and an x-ray source that produces cone-beam data with a single circular orbit. Both PET and CT images can be coregistered to each other (using positional information contained in the Interfile headers) despite different voxel sizes (0.3875 × 0.3875 × 0.775 mm for PET and 0.122 × 0.122 × 0.122 mm for CT in this study).
After overnight fasting, conscious animals were intraperitoneally injected with 18F-FDG (average dose, 15.6 ± 1.7 MBq; maximum, 19.7 MBq; minimum, 9.8 MBq) in 0.5 mL of saline and placed in a warm, dark cage for 45 min. This protocol reduced stress to the animals, facilitated 18F-FDG uptake (because the animals were conscious (10)), and reduced variability in the brain signal due to uptake in brown fat (32), thus resulting in more homogeneous readouts. Furthermore, the brain uptake of 18F-FDG is similar for intraperitoneal or intravenous routes at approximately 45 min after injection (32). After the uptake period, the animals were anesthetized (intraperitoneal ketamine, 75 mg/kg, plus medetomidine, 1 mg/kg) and placed in a custom-built Styrofoam (The Dow Chemical Co.) cradle on the scanner bed in a supine position and secured with tape at the level of the head, thorax, and hind limbs to prevent movement. A CT image was acquired first (at 40 kV, 140-μA beam current, and 360 projections), followed by a 40-min list-mode PET scan. Data were formatted into four 10-min frames, and corrections for dead-time, randoms, scatter, and attenuation were applied. Attenuation correction was based on a segmented version of the CT image (scaled to 511 keV), and scatter correction was based on fitting a scatter function to the tails of the projection data (33). Images were reconstructed using Fourier rebinning followed by a 2-dimensional ordered-subsets expectation maximization algorithm (2 iterations with 16 subsets). These reconstruction parameters were chosen (after phantom studies using objects of a similar size to the mouse brain and with similar count densities) because they gave a good tradeoff between resolution and signal-to-noise ratio. Acquisition, corrections, and reconstruction were performed using the manufacturer’s software. Reconstructed images were processed using PMOD (PMOD Technologies), version 3.3, and SPM (Wellcome Trust Centre for Neuroimaging), version 8.
Image Alignment and Analysis
PET images were resampled to the same voxel dimensions and aligned with the CT images, based on the information in the interfile headers. The accuracy of this registration was verified as part of the regular quality control procedures for the scanner. Images from the first scan were set as the reference, and all subsequent images were registered in PMOD using the Brain Norm II algorithm (based on the nonlinear warping algorithm used in SPM). Two different registration schemes were applied. In one scheme, the CT image from each mouse was registered to the reference CT image and the same transform was then applied to the PET scan of that mouse. This scheme was referred to as CT–CT, as each CT image was registered to a CT template image. In the other scheme, the PET image from each mouse was registered directly to the reference PET image (referred to as PET–PET registration). In both schemes, a mask was used that fully encompassed the brain, to prevent the registration from being biased by structures outside the brain.
The reference CT image was mapped onto a T2-weighted MR image from the brain atlas of Mirrione et al. (12), and the same transformation was then applied to all registered scans (both CT–CT and PET–PET). Since the final step of alignment was identical for both CT–CT and PET–PET registered images, any differences between these sets are due to the original registration method.
A 3-dimensional mask image was produced from the Mirrione T2-weighted MR image, and all values outside the brain were set to zero. Although this masking has no effect on the values within the brain, it allows use of the implicit mask option in SPM (which was developed for human brain imaging and assumes that the highest signal will be in the brain). Finally, all images were converted to SUVs by scaling each image according to the ratio of body weight of each animal to the injected dose. The quantitative accuracy of the scanner was calibrated using a uniform cylinder of activity (similar in size to a mouse) as part of the regular quality control process.
This procedure resulted in 72 dynamic images: 12 mice scanned on 3 occasions and registered using 2 different schemes. Each image consisted of four 10-min frames, and all were registered to the same (Mirrione) atlas and displayed in units of SUV.
Image Processing and Statistical Analysis
Analysis of images was based on either ROIs or SPM. These are largely complementary techniques, which can be used to address different questions. ROI analysis is hypothesis-driven; that is, regions of the image are defined a priori, and the mean uptake in those regions is used to test various hypotheses. SPM, on the other hand, is a data-driven technique, which does not require regions to be defined in advance. However, the large number of voxels in a reconstructed image can lead to a multiple-comparisons problem, thereby increasing the probability of type I (false-positive) errors or, if these are controlled, a loss of sensitivity (i.e., an increase in type II errors). Thus, the most appropriate analysis technique depends on the question being asked, and both techniques were compared here.
ROI analysis was based on the mouse atlas of Mirrione et al. (11), with modifications to produce an 11-ROI template consisting of striatum, cortex, hippocampus, thalamus, cerebellum, basal forebrain and septum, hypothalamus, amygdala, caudal brain stem, olfactory bulb, and midbrain, along with a whole-brain ROI equaling the total of all the other ROIs.
Changes were measured using SUVs and whole-brain normalized values, in which the values for each ROI were divided by the value for the whole brain. Some comparisons were also made using units of %ID/g, more commonly used in preclinical and biologic research and effectively equivalent to SUVs but without normalizing with reference to the weight of the animal. All statistical tests were performed using SPSS (IBM), version 20.
SPM was applied for the unbiased analysis of region-specific reduction in brain metabolism with age across the group. Since the same animals were scanned at each age, analysis of registered images was based on paired t tests. We explored specifically the effect of applying smoothing to the images before SPM analysis, as well as modifying the length of each scan. We also contrasted the results of image scaling (SUVs vs. normalized to whole-brain activity) and registration method (PET–PET vs. CT–CT). As smoothing of images before SPM analysis can reduce errors caused by variability in registration, it can deliver a better signal-to-noise ratio (34). Increasing the length of each PET scan also enhances the signal-to-noise ratio, assuming the 18F-FDG signal is constant, which was tested by comparing the signal in the first and last frames. Therefore, we would expect optimal smoothing to depend on the length of the scan.
Because the aim of the present study was to optimize and validate protocols for measuring changes in metabolism, we did not endeavor to fully characterize regional changes in metabolism with age. The maximum T value (maxT) from the paired comparisons (as reported by SPM) in various brain regions was selected as a quantitative indicator for the performance of our methods. Assuming that changes detected are genuine, the optimal analysis method will maximize the significance of the results—that is, the T value (and consequently will minimize the P value). Analysis of regional reductions in metabolism from 6 to 10 mo, 10 to 14 mo, and 6 to 14 mo was performed. Since the number of animals (and therefore degrees of freedom) was the same in each group, the T values can be directly compared for each test.
Where a correction for multiple comparisons was applied, this was a familywise error correction with α set to a threshold of 5%. This correction gives relatively tight control of type I errors but at the cost of relatively low control of type II errors.
RESULTS
Despite the uniform handling of the subjects (i.e., all animals fasted, kept in warm dark boxes, and so forth) there was high variability in uptake of 18F-FDG from one mouse to the next (Fig. 1). Correlation analysis indicated a significant negative relationship between age and average whole-brain SUV (Pearson r = −0.398, P < 0.01 [2-tailed]). However, age accounted for only 16% of the variance in the data (R2 = 0.16), and no significant correlation was found between the whole-brain SUV measured at 6 mo and the whole-brain SUV measured at 10 or 14 mo (P > 0.1 in all cases). In other words, whereas the average SUV for the group decreased with age, an animal with (for example) higher than average SUV at 6 mo was no more likely to have a higher than average SUV at 10 or 14 mo, suggesting that much of the variability is not explained by differences between the animals.

Matched PET images from 4 representative mice used in this study. Warmer colors represent higher activity.
The trend in relative activity of different brain regions was the same regardless of whether uptake was expressed in units of %ID/g or SUV or was normalized to whole-brain activity (Fig. 2 gives the result for the 6-mo group as an example). However, SD over the 12 scans indicated that variance was significantly reduced by normalizing regional uptake relative to whole-brain uptake; that is, variance in SUVs is largely due to variability in global uptake rather than in the relative uptake in a region. Evidence of a small yet consistent reduction in activity over the course of the scan was also observed, with the average reduction in whole-brain SUV (with CT–CT registration) being 9% ± 5%. The difference in uptake between frames and between brain regions was highly significant (2-way repeated-measures ANOVA: effect of frame, F1.1, 11.7 = 46.9; effect of brain region, F3.2, 35.7 = 118.5; P < 0.001 in both cases). The interaction between region and frame was also significant (F30, 330 = 3.9; P < 0.05) for the normalized data but did not reach significance (P = 0.08) for SUV data because of the larger variance. Mauchly’s test of sphericity (35) was significant for both tests (P < 0.01) and therefore we have quoted the Greenhouse–Geisser adjusted values of significance and degrees of freedom here (36). SPM images from a paired t test comparing activity in frame 4 with that in frame 1 (Fig. 3) further confirm the progressive frame-dependent reduction in activity and regional differences thereof.

Comparison between %ID/g (A), SUV (B), and whole-brain normalized uptake (C) for 12 regions of Mirrione atlas and for each frame. Images were normalized using CT–CT registration, and results are for 6-mo group. Error bars indicate mean + SD of group.

SPM images (from left to right: coronal, sagittal, and horizontal axis) of reduction in uptake in frame 4, compared with frame 1 (for 6-mo CT–CT registered data). Images at top show complete spectrum of T values, images in the middle show threshold applied at level of uncorrected P < 0.001, and images at bottom show threshold applied at level of familywise error–corrected P < 0.05. SPM images are overlaid on T2 image from Mirrione atlas for anatomic reference, and same color scale (where warmest color represents T value of 20) was used for all images.
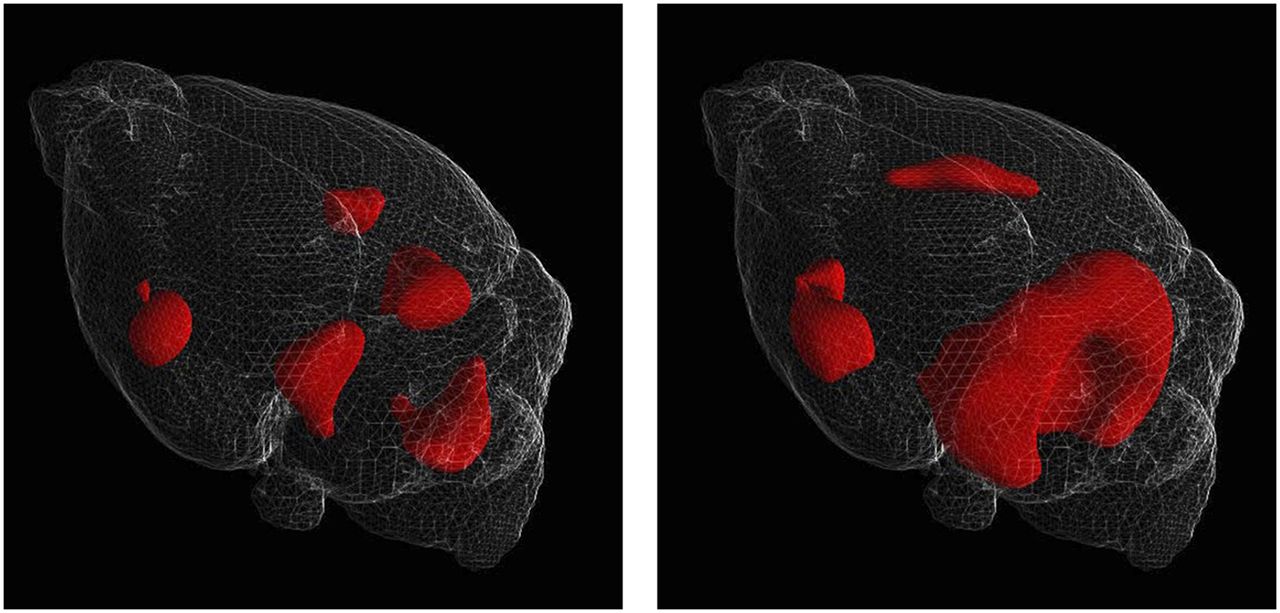
SPM-based methods were generally more sensitive and region-specific than methods based on SUV or %ID/g. For example, 1-way repeated-measures ANOVA on images registered using the CT–CT method failed to detect any significant difference in the mean normalized uptake from 6 to 10 mo in the cerebellum. However, SPM analysis of the same images highlighted small cerebellar regions with significant differences using a threshold of uncorrected P < 0.001 or a threshold of familywise error–corrected P < 0.05. When SPM was applied to test for age-related reduction in metabolism, a progressive phenotype was also observed, with clusters that were significant for the 6- to 10-mo comparison becoming larger and more significant when a 6- to 14-mo comparison was performed (Fig. 4).

Surface-rendered 3-dimensional SPM images depict reduction in metabolism for 6-mo vs. 10-mo groups (left) and 6-mo vs. 14-mo groups (right). Images were registered using CT–CT method and normalized to whole-brain activity, and 1.0 mm of smoothing was applied. A surface rendering of the T2-weighted MR image is provided to aid localization.
We also confirmed a strong correlation between maxT in the various brain regions for images that were expressed as SUV and those scaled to average whole-brain activity. As an example, Table 2 gives the results for the 6- to 10-mo comparison (Pearson r = 0.884 for CT–CT registration and 0.707 for PET–PET; yielded P < 0.05 [2-tailed] in both cases). However, the range of values for the normalized data was much higher than for SUV, showing the greater regional sensitivity.
Maximum T Scores in Various Brain Regions from SPM Analysis of Reduction in Metabolism from 6 to 10 Months
For the 2 age comparisons (6- to 10-mo and 10- to 14-mo), the following 5 regions always contained the highest maxT values: caudal brain stem, cerebellum, striatum, midbrain, and cortex. The maxT in these 5 regions was significantly higher for images that were normalized to whole-brain activity than for those expressed as SUV, regardless of whether CT–CT or PET–PET registration was used (P < 0.01 in both cases, 2-tailed paired t test).
To put the maxT scores into context, it should be noted that a threshold is applied to parametric maps in SPM to identify areas of significant difference. One common threshold is that corresponding to an uncorrected P < 0.001, equivalent in this case to T > 4.03. For this threshold, results based on images expressed as SUV would not produce any significant voxels for the 6- to 10-mo comparison (Table 2), but significant clusters would be identified using images scaled to whole-brain activity regardless of whether CT–CT or PET–PET registration were used. Another commonly used threshold in SPM (which provides tight control of type I errors at the expense of more type II errors) is a familywise error–corrected P < 0.05, corresponding to T > 7.43 in this case. On the basis of that threshold, there were no significant voxels for images expressed in units of SUV or for any images registered using the PET–PET method, but significant clusters were identified for images scaled to whole-brain activity and registered using the CT–CT method.
Further evidence for the advantage of using CT–CT versus PET–PET registration methods arose from a comparison of maxT values. For example, significant differences were obtained for the caudal brain stem (P < 0.05, paired t test over the 4 levels of smoothing: 0, 0.5, 1, and 1.5 mm) for all 4 scan lengths (10, 20, 30, and 40 min) and for both age comparisons (6- to 10-mo and 10- to 14-mo, Table 3).
Maximum T Scores in Caudal Brain Stem for 2 Age Comparisons with Different Scan Lengths and Smoothing Levels
In contrast, the effect of varying the scan length or the level of smoothing was not consistently significant. For example, a 2-way repeated-measures ANOVA, with factors of scan length and smoothing, on the CT–CT registered data (Table 4) showed no significant effect of scan length (P > 0.3 in both cases). The estimated marginal means for scan length for the 6- to 10-mo comparison were 6.7 ± 0.6 for 10 min, 6.3 ± 0.4 for 20 min, 6.6 ± 0.3 for 30 min, and 6.5 ± 0.4 for 40 min, confirming that any effect of scan length on the maxT values was small. The effect of smoothing was highly significant (2-way repeated-measures ANOVA: effect of smoothing: F3, 12 = 25.6; P < 0.01) for the 6- to 10-mo comparison but not for the 10- to 14-mo comparison (P > 0.5). The overall maxT was highest with a smoothing level of 1.5 mm for all 4 scan lengths for the 10- to 14-mo comparison, but for the 6- to 10-mo comparison the global maxT was achieved with no smoothing for the 10- and 20-min scans, 1-mm smoothing for the 30-min scan, and 0.5-mm smoothing for the 40-min scan. Overall we conclude that, in practice, the optimum smoothing level is likely to depend on the underlying change in signal and that comparisons should be made with a range of smoothing levels.
Maximum T Scores in Various Brain Regions from SPM Analysis of Reduction in Metabolism with Age for Various Scan Lengths and Smoothing Levels
DISCUSSION
This study established key parameters for preclinical PET/CT brain imaging, relevant for a range of applications. One of the challenges in developing and optimizing a protocol for a particular imaging task is the selection of an appropriate test object. Although phantoms have an advantage in that the true activity distribution is known, they rarely reflect the complexity encountered with real, biologic subjects. One step we investigated with this study was the registration of images to a template, the accuracy of which is dependent on the complexity of the subject. However, in electing to use mouse brain images, one must ensure that changes detected in images of mice of different ages or having other differences represent genuine alterations in metabolism. Although a given recording technique or analysis technique may reveal highly reliable differences for a specific region, it cannot automatically be concluded that this method is generally superior. Our study found areas of reduced activity in the caudal brain stem, cerebellum, and midbrain matching those identified in other studies (21). In addition, because the clusters of most significance were in the same place regardless of registration method and were away from the brain–skull interface, they were unlikely to be an artifact caused by misregistration, for example. Furthermore, in line with an age-dependent, progressive change in metabolism, regions of reduced metabolism increased in size and significance for the 6- to 14-mo comparison relative to the 6- to 10-mo comparison (Fig. 4). Because this finding is in agreement with our previous finding (17) of an age-dependent enlargement of metabolic changes in the PLB1Triple model of Alzheimer disease, it lends further strength to the notion that regions of reduced activity reflect genuinely reduced glucose uptake and that the methods identified here to produce the highest sensitivity are indeed optimal.
The ability to detect changes in absolute metabolism was limited in this study by the high degree of variability in brain uptake between the scans. Despite controlling for dietary state, time from injection to scanning, and the holding condition of the animals during the uptake period (warm, dark box), there still was considerable variability in uptake between animals or even within each subject at different ages. However, such differences are not unexpected given the individual history of each mouse. In addition, we did not control for any behavior during the uptake of 18F-FDG but noticed that although a couple of animals were awake and showed occasional activity, most tended to sleep or remain quietly withdrawn in a corner of the cage. Although removing the most active animals from the analysis did not improve the significance of the results in this study, we consider it likely that differences in behavioral condition before scanning can have a major impact on 18F-FDG uptake. It remains to be determined whether high motor activity leads to enhanced brain levels or whether 18F-FDG is enriched in skeletal muscles, heart, and lung and thus is overall lower in brain.
The cohort used in this study was of mixed sex, and there were also differences in weight gain during the study. Although the sample size was not large enough to test for differences due to sex or weight, it is possible that a more homogeneous uptake may be achieved by stricter inclusion criteria related to sex or body weight.
It has been noted that retention may be much more homogeneous under anesthesia (32,37); the drawback is a substantially reduced overall uptake of 18F-FDG such that small differences may not be detectable under this condition. It is nevertheless clear that with appropriate environmental control, 18F-FDG imaging can be exploited in cognitively active animals for both tumor imaging (32) and the detection of metabolism in performance-related brain centers (38–40), strongly supporting the notion that behavioral control after 18F-FDG administration may indeed increase the homogeneity of absolute radioactivity in the brain.
If 18F-FDG images are combined and aligned with CT images, however, high variability may not be of concern after all. It appears that absolute radioactivity has minor effects on postacquisition data processing when compensated for by proportional scaling. Toward this end, unbiased normalization of data to whole-brain activity outperformed SUV or %ID/g image analyses in all our datasets and is a widely used analysis technique in rodents (41) and humans (42). We accept that normalizing activity in this way removes the possibility of detecting changes in absolute uptake or metabolism and that activation of any ROI should be considered in terms of overall activity in whole brain and not based purely on a small selection of voxels. A consequence of this outcome is that a region that shows a statistically significant reduction in normalized activity from one age to the next could in fact have increased absolute metabolism if the overall metabolism of the whole brain also has increased.
Unexpected was the significant and consistent reduction in activity during the 40-min scanning session. The standard Sokoloff model for 18F-FDG uptake (2) consists of 4 rate constants that describe the pharmacokinetics of the tracer: K1 describes transport of 18F-FDG from the arterial blood to the tissue, k2 addresses the transport back to the blood, and k3 and k4 consider the phosphorylation and dephosphorylation of the tracer, respectively. It is generally accepted that 18F-FDG cannot undergo further metabolism beyond phosphorylation, and k4 is close to zero in humans and rats (2)—that is, when 18F-FDG plateaus, it accumulates in tissues over a period of about 1 h. This does not seem to be the case with mice, because a significant reduction (∼10%) in activity was observed in a region-specific manner (Fig. 3). Regional differences in the 18F-FDG kinetics of the mouse brain are unknown, but in a PET study of mouse brain metabolism, k3 and k4 proved to be small and of the same order of magnitude when derived from a 3-compartment model (43), suggesting that dephosphorylation indeed takes place and that 18F-FDG kinetics may differ among species. We consider the anesthetic recording condition to be an unlikely contaminant because at the time of narcosis, the amount of 18F-FDG in blood would be similarly low in other rodent species.
No significant advantage was found by increasing the length of the PET scan, with a 10-min scan having the same power to detect changes in metabolism as a 40-min scan. Because of the Poisson nature of PET data, one would normally expect the signal-to-noise ratio to increase as the length of the scan is increased. However, it appears that this effect was effectively cancelled out by the effect of the reduced (and changing) activity distribution from one frame to the next. This surprising result opens the possibility of reducing the length of the scan, and thus increasing throughput, without sacrificing accuracy.
The combination of short scanning times with CT–CT registration resulted in parametric images with higher T scores (and therefore a higher power for detecting changes in metabolism) than PET–PET registration. This result implies that heightened resolution of the CT images relative to PET and improved contrast between different regions (e.g., brain and skull) significantly improved the accuracy of image alignment. The reduced significance with PET–PET registration is most likely due to a blurring of the signal changes across subjects caused by increased variability in the registration. This variability may be particularly important for mice (with rather small brains) and be less of an issue when bigger mammals are examined.
No clear conclusions could be drawn about the optimum level of smoothing to apply before SPM analysis. The optimum level is related to the size of the signal (34), but this is unknown and typically not systematically varied in mouse brain studies. The optimum smoothing level is also likely to depend on the reconstruction algorithm used. We tested levels of smoothing in the range of 0–1.5 mm, and although there was at least one test in which the maximum T score was obtained with each smoothing level, it nevertheless was inconsistent and varied with age and brain structure. Overall, however, smoothing did not significantly distort scanning sensitivity, and increases in T scores were typically between 5% and 15%.
CONCLUSION
In this study, we systematically varied numerous recording and analysis parameters to determine the optimal conditions for 18F-FDG PET/CT data acquisition. Despite a high degree of variability in 18F-FDG retention between scans, proportional scaling to whole-brain activity increased homogeneity in datasets so that differences were readily revealed. Registration based on CT images has clear advantages in terms of sensitivity, compared with registration based purely on PET scans. No significant advantage was found by increasing the length of the scan beyond 10 min, and no clear conclusion could be drawn on the optimum smoothing level for SPM analysis. Both ROI- and SPM-based methods detected changes in brain metabolism, but SPM was generally more sensitive and region-specific.
DISCLOSURE
The costs of publication of this article were defrayed in part by the payment of page charges. Therefore, and solely to indicate this fact, this article is hereby marked “advertisement” in accordance with 18 USC section 1734. No potential conflict of interest relevant to this article was reported.
Footnotes
Published online Sep. 5, 2013.
- © 2013 by the Society of Nuclear Medicine and Molecular Imaging, Inc.
REFERENCES
- Received for publication February 8, 2013.
- Accepted for publication June 20, 2013.


