


Abstract
3′-Deoxy-3′-18F-fluorothymidine (18F-FLT) is a recently developed PET tracer to image tumor cell proliferation. We characterized 18F-FLT PET of brain gliomas and compared 18F-FLT with 18F-FDG PET in side-by-side studies of the same patients. Methods: Twenty-five patients with newly diagnosed or previously treated glioma underwent PET with 18F-FLT and 18F-FDG on consecutive days. Three stable patients in long-term remission were included as negative control subjects. Tracer kinetics in normal brain and tumor were measured. Uptake of 18F-FLT and 18F-FDG was quantified by the standardized uptake value (SUV) and the tumor-to-normal tissue (T/N) ratio. The accuracy of 18F-FLT and 18F-FDG PET in evaluating newly diagnosed and recurrent gliomas was compared. More than half of the patients underwent resection after the PET study and correlations between PET uptake and the Ki-67 proliferation index were examined. Patients were monitored for a mean of 15.4 mo (range, 12–20 mo). The predictive power of PET for tumor progression and survival was analyzed using Kaplan–Meier statistics. Results: 18F-FLT uptake in tumors was rapid, peaking at 5–10 min after injection and remaining stable up to 75 min. Hence, a 30-min scan beginning at 5 min after injection was sufficient for imaging. 18F-FLT visualized all high-grade (grade III or IV) tumors. Grade II tumor did not show appreciable 18F-FLT uptake and neither did the stable lesions. The absolute uptake of 18F-FLT was low (maximum-pixel SUV [SUVmax], 1.33) but image contrast was better than with 18F-FDG (T/N ratio, 3.85 vs. 1.49). 18F-FDG PET studies were negative in 5 patients with recurrent high-grade glioma who subsequently suffered tumor progression within 1–3 mo. 18F-FLT SUVmax correlated more strongly with Ki-67 index (r = 0.84; P < 0.0001) than 18F-FDG SUVmax (r = 0.51; P = 0.07). 18F-FLT uptake also had more significant predictive power with respect to tumor progression and survival (P = 0.0005 and P = 0.001, respectively). Conclusion: Thirty-minute 18F-FLT PET 5 min after injection was more sensitive than 18F-FDG to image recurrent high-grade tumors, correlated better with Ki-67 values, and was a more powerful predictor of tumor progression and survival. Thus, 18F-FLT appears to be a promising tracer as a surrogate marker of proliferation in high-grade gliomas.
Uncontrolled cellular proliferation is a hallmark of neoplasia. In primary brain gliomas, markers of proliferative potential applied to biopsy samples ex vivo have been among the most extensively studied molecular correlates of clinical outcome. Among these markers, the Ki-67 index has been best validated as the histopathologic correlate of clinical outcome (1–5).
Recently, the thymidine analog 3′-deoxy-3′-18F-fluorothymidine (18F-FLT) has been developed as a PET tracer to image proliferation in vivo (6). This tracer is retained in proliferating tissues through the activity of thymidine kinase. 18F-FLT uptake has been shown to reflect the activity of thymidine kinase-1 (TK1), an enzyme expressed during the DNA synthesis phase of the cell cycle (7). TK1 activity is high in proliferating cells and low in quiescent cells. Owing to the phosphorylation of FLT by TK1, negatively charged FLT monophosphate is formed, resulting in intracellular trapping and accumulation of radioactivity (8,9). 18F-FLT as a PET tracer has been investigated in several extracranial tumors, such as human lung cancer, colorectal cancer, melanoma, lymphoma, breast cancer, laryngeal cancer, and soft-tissue sarcomas (10–18). Significant correlations of quantitative 18F-FLT uptake with the immunohistochemistry marker of cell proliferation Ki-67 have been demonstrated in lung cancer, colorectal cancer, and lymphoma.
We designed a prospective study to characterize 18F-FLT uptake in brain gliomas and to investigate whether 18F-FLT PET is more sensitive and specific in detecting gliomas than 18F-FDG PET as well as how well 18F-FLT PET uptake in gliomas in vivo correlates with the Ki-67 proliferative marker ex vivo. Further, the predictive power of those 2 tracers for tumor progression and patient survival was evaluated and compared.
MATERIALS AND METHODS
Patients
Twenty-five patients with newly diagnosed or previously treated gliomas (17 men, 8 women; mean age, 47.1 ± 15 y; range, 24–68 y; Table 1) were prospectively studied. The distribution of cases based on the World Health Organization histopathologic classification was as follows: 7 patients had newly diagnosed glioma (2 grade II, 1 grade III, and 4 grade IV) and 15 were evaluated for recurrence (2 grade II, 3 grade III, and 10 grade IV). Three long-term patients (2 grade III, 1 grade IV) without progression were included as negative control subjects. Long-term patients without progression were defined as (a) no evidence of recurrence based on MRI, (b) not presently undergoing radiation or chemotherapy, and (c) stable clinically and by MRI for >3 y after surgery or last therapy. MRI studies of the brain, including T2- and T1-weighted images, before and after the administration of gadolinium-diethylenetriaminepentaacetic acid (Gd-DTPA), were acquired in all patients within 1 wk before the PET scans.
Patient Characteristics, Tumoral Tracer Uptake, and Proliferation Fraction (Ki-67 Index)
The majority of the patients (14/25) underwent surgical resection of the glioma after the PET study. The mean interval between PET and resection for these patients was 20 d (range, 2–75 d). In the other 11 patients, clinical follow-up and subsequent MR scans (obtained as routine clinical follow-up) were used for evaluating tumor progression based on established criteria (19). Progression was defined if any of the following occurred: (a) an ≥25% increase in the sum of products of all measurable lesions over baseline using the same techniques as baseline, (b) a clear worsening of any evaluable disease, (c) an appearance of any new lesion or site, or (d) a failure to return for evaluation due to death or deteriorating condition (unless clearly unrelated to the glioma). The time to tumor progression was the time interval from the date of the PET study to the date of first establishment of disease progression.
All patients gave written consent to participate in this study, which was approved by the UCLA Office for Protection of Research Subjects.
FLT Synthesis
FLT was synthesized by modifying a previously published procedure (20). Briefly, no-carrier-added 18F-fluoride ion was produced by 11-MeV proton bombardment of 95% 18O-enriched water via 18O (p,n) 18F nuclear reaction. This aqueous 18F-fluoride ion (∼18,500 MBq) was treated with potassium carbonate and Kryptofix 2.2.2. (Aldrich Chemical Co.). Water was evaporated by azeotropic distillation with acetonitrile. The dried K18F/Kryptofix residue thus obtained was reacted with the precursor of FLT (5′-O-[4,4′-dimethoxytrityl]-2,3′-anhydrothymidine) and then hydrolyzed with dilute HCl. The crude 18F-labeled product was purified by semipreparative high-performance liquid chromatography (HPLC) (Phenomenex Aqua column, 25 × 1 cm; 10% ethanol in water; flow rate, 5.0 mL/min) to give chemically and radiochemically pure 18F-FLT in 555–1,110 MBq (6%–12% radiochemical yield, decay corrected) amounts per batch. The chemical radiochemical purities of the product isolated from the semi-HPLC system were confirmed by an analytic HPLC method (Phenomenex Luna C18 column, 25 cm × 4.1 mm; 10% ethanol in water; flow rate, 2.0 mL/min; 287-nm ultraviolet and radioactivity detection; specific activity, ∼74 Bq/mmol) and found to be >99%. The product was made isotonic with sodium chloride and sterilized by passing through a 0.22-μm Millipore filter into a sterile multidose vial. The final product was sterile and pyrogen free.
PET
18F-FLT and 18F-FDG PET examinations were performed on consecutive days. PET was performed using a high-resolution, full-ring scanner (ECAT EXACT or ECAT HR+; Siemens/CTI), which acquires 47 or 63 contiguous slices simultaneously. No specific dietary instruction was given to the patients except for instructing them to drink plenty of water before and after the PET study (to accelerate 18F-FLT or 18F-FDG excretion)
For 18F-FLT PET, 141–218 MBq of 18F-FLT (mean, 174 MBq; 2.10 MBq/kg) were injected intravenously. A dynamic emission acquisition in 3-dimensional (3D) mode was used (5 × 1 min, 4 × 5 min, 2 × 10 min, 6 × 5 min frames). This 75-min dynamic protocol was used for the first 11 patients studied. An abbreviated dynamic protocol of 35 min (7 frames × 5 min) was used for the subsequent 14 patients.
18F-FDG PET was performed based on the standard clinical protocol: 30-min PET after a 60-min uptake period; 148–248 MBq of 18F-FDG (mean, 192 MBq; 2.11 MBq/kg) were injected 1 h before the PET scan. A dynamic scan of 30 min was acquired in 3D mode (6 frames × 5 min).
At the end of the 18F-FLT and 18F-FDG PET image acquisition, a 5-min transmission scan was acquired in all patients to correct for photon attenuation. PET emission data corrected for photon attenuation, photon scatter, and random coincidences were reconstructed using filtered backprojection and a Hanning filter with a cutoff frequency of 0.5 cycle per bin, yielding a full width at half maximum of 5 mm.
Immunohistochemistry
The tissue-embedded paraffin blocks were recut and serial sections of 3–4 μm were taken for immunohistochemical staining with monoclonal murine antibody MIB-1, an antibody to Ki-67 (1/100 dilution; DAKO Corp.). MIB-1 recognizes the Ki-67 antigen, a 345- and 395-kDa nuclear protein common to proliferating human cells (21).
Serial sections were reviewed by an experienced neuropathologist. An area with high cellularity was chosen for the evaluation of MIB-1 immunostaining of Ki-67. In tissue samples with malignancy, Ki-67 stains were evaluated and designated a score indicating the percentage of positively stained tumor cells per quartile of tumor tissue. All cells with nuclei staining of any intensity were defined as positive. The proliferative activity score, quantified as the percentage of MIB-1–stained nuclei per total nuclei in the sample, was estimated from a representative slide selected by the neuropathologist.
Image Analysis
The region of interest (ROI) of the tumor was defined in the following ways. First, the plane most representative of the tumor was determined by using MRI as the reference by image fusion as well as the determination of the maximum PET tracer uptake. The MRI region was used as a reference and a starting point with location of the tumor area of chief concern specified by the neurooncologist who was evaluating the patients without access to the PET data. This was important, especially in patients who had multiple resections and radiation treatments. The PET image was first fused with the most recent MR scan (MIMVista) obtained within the same week as the PET study (22). Then, specific ROIs were defined by drawing an isocontour on the chosen plane based on 80% of the maximum-pixel standardized uptake value (SUVmax). This excluded the central necrosis region of the tumors. Whether this was the plane with the maximum PET uptake in the ROI was further verified by evaluating the SUVs in the ROI through all planes. When there was disagreement, the PET plane with the maximum SUV was chosen. PET data were then summed on 3 consecutive slices with 1 plane above and 1 plane below the maximum plane for quantitative analysis.
To determine the time course of 18F-FLT uptake in tumors and determine the time window of optimal tumor uptake to background ratio, time–activity curves of 18F-FLT uptake were generated in the first 11 patients with 75-min dynamic scans. Uptake in tumor and cerebellum (the latter as the normal brain reference) was evaluated over the 75 min after injection. Time–activity curves were also generated using tumor-to-normal tissue (T/N) ratios. Time curves were averaged for all 11 patients. 18F-FLT uptake in tumors peaked at 5–10 min after injection and remained stable without a significant decline up to 75 min. On the basis of these data, a 35-min emission acquisition scan beginning at the time of injection was deemed sufficient for image acquisition for the subsequent 14 patients.
18F-FLT data were summed between 5 and 35 min to obtain static images. 18F-FDG data were summed for the 30 min according to the standard clinical protocol. Visual image analysis was performed by 2 experienced nuclear physicians. Activities visibly above background were considered abnormal for 18F-FLT or 18F-FDG uptake. Background was defined as the brain area immediately adjacent to the tumor. For quantitative image analyses, counts in the ROIs were normalized to injected dose per patient’s body weight by calculation of SUVs. The SUVmax and the mean SUVs in the voxels with the top 20% of the maximal SUV value (SUVmax20) were generated. The T/N ratio was determined by dividing the tumor SUVmax20 with the mean SUV of the contralateral normal tissue.
Statistical Analysis
The Student t test was used to compare the uptake values of high-grade versus low-grade gliomas, high-grade gliomas versus stable lesions, and low-grade gliomas versus stable lesions. 18F-FDG and 18F-FLT uptakes were compared using the Wilcoxon nonparametric test. The Ki-67 values and the SUVs for 18F-FLT and 18F-FDG were assessed with linear regression analyses. Sensitivity and specificity were calculated based on the PET data compared with the subsequent pathology and clinical follow-up data. Results were reported with 95% confidence intervals (CIs) when available. The Student t test was also used to compare the PET uptake values of those patients who died versus those who were alive. Receiver-operating-characteristic (ROC) curve analysis was used to identify the threshold of the PET uptake value for patients with longer survival. Kaplan–Meier analyses and log rank statistical tests were used to test the power of 18F-FLT and 18F-FDG PET for predicting time to tumor progression as well as patient survival. For the progression-free survival and survival curves, qualitative visual analysis of the PET study data was used (positive vs. negative).
RESULTS
18F-FLT Time–Activity Curves
To analyze the time course of 18F-FLT uptake in the tumor and normal brain as well as define the temporal window for the best tumor-to-normal image contrast, time–activity curves of 18F-FLT uptake of tumor and cerebellum were generated from the 11 patients with 75-min dynamic scans (Fig. 1A). Tumor showed rapid 18F-FLT uptake, reaching the peak between 5 and 10 min after injection. There was no significant decline through the 75-min scan. Cerebellum 18F-FLT uptake peaked in the first minute after injection and was followed by a sharp decline before reaching a constant low background level. The time course of image contrast (as assessed by tumor-to-contralateral normal tissue ratio), peaked slightly after 5–10 min following injection and remained constant through the 75-min scan (Fig. 1B). On the basis of these results, a 35-min emission acquisition was acquired for the subsequent 14 patients, and 18F-FLT uptake between 5 and 35 min was summed for quantitative uptake analysis.
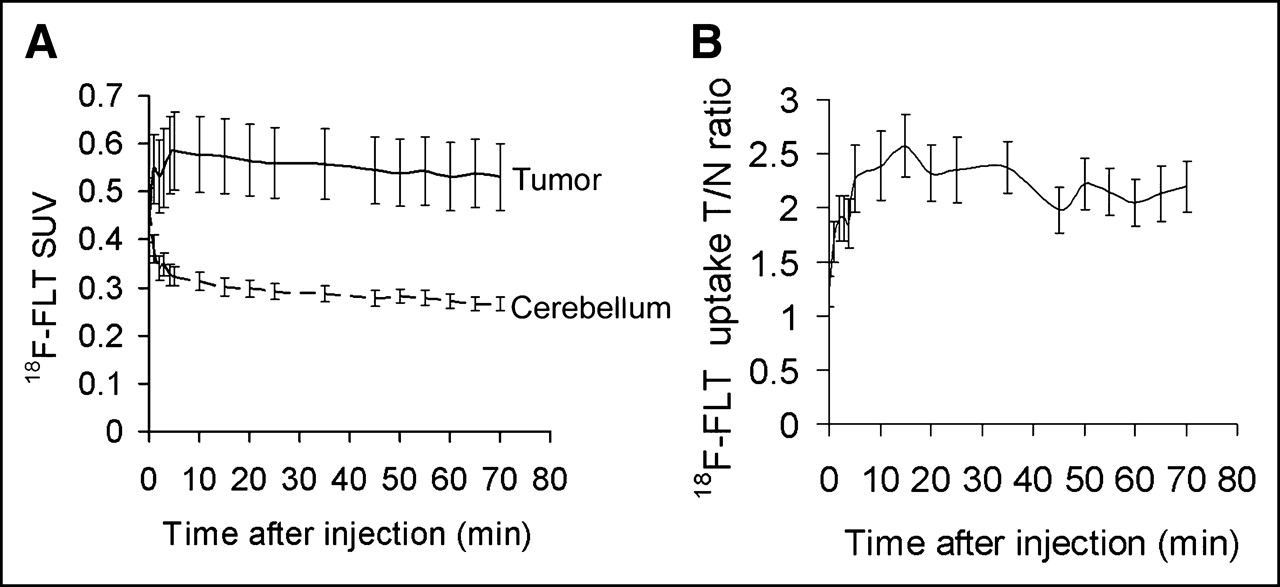
Time–activity curves of 18F-FLT uptake summarized for 11 patients over 75 min from time of injection. (A) Time course of 18F-FLT accumulation in tumor tissue (solid line) and cerebellum (dashed line). Tracer uptake is expressed using mean values of voxels with top 20% SUVs. Error bars denote 1 SE from mean uptake. (B) Time course of image contrast (tumor/contralateral normal tissue ratio). Error bars denote 1 SE from mean T/N ratios.
Visualization of High- and Low-Grade Gliomas with 18F-FLT and 18F-FDG
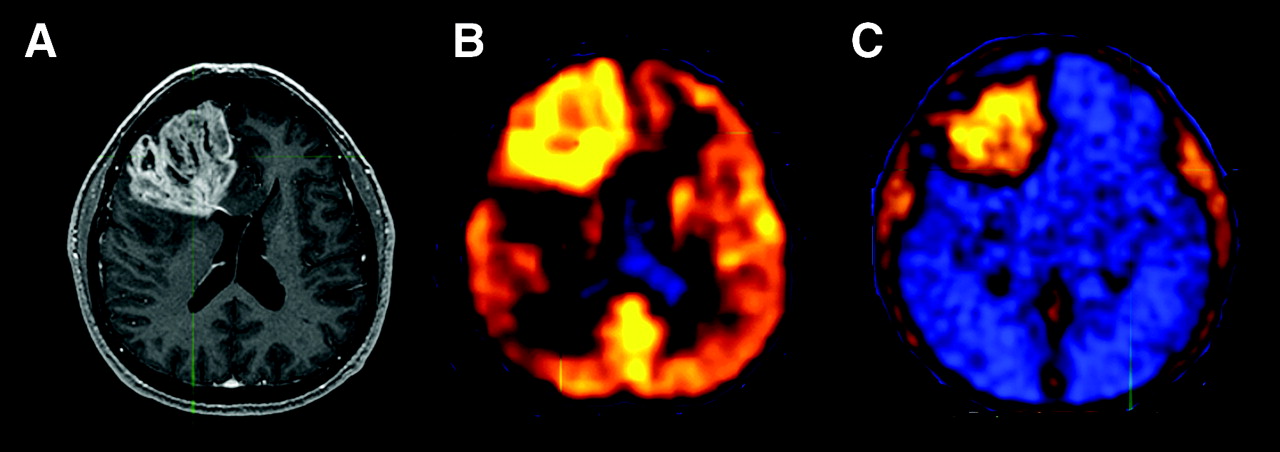
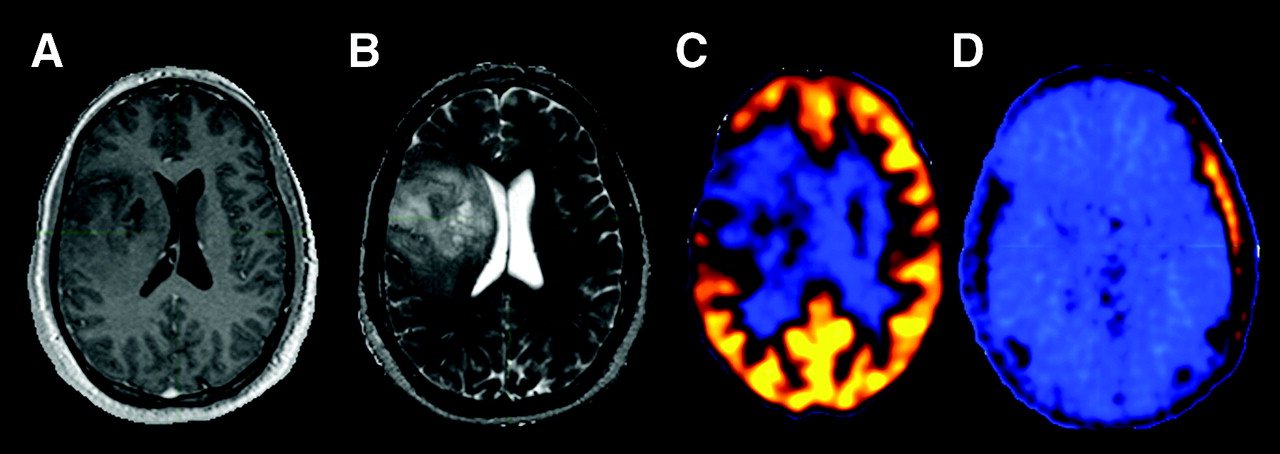
18F-FLT visualized all 18 high-grade tumors (Fig. 2). Low-grade tumors that did not show contrast enhancement on MRI with Gd-DTPA were not visualized (Fig. 3); neither were all 3 stable lesions in patients in long-term remission. Thus, 18F-FLT was 100% sensitive and specific in all high-grade gliomas in our study population. Five patients with previously treated high-grade gliomas were originally considered stable by MRI and clinical criteria for several months before the PET study. 18F-FLT PET studies were positive but 18F-FDG studies were negative. All 5 patients had tumor progression within 1–3 mo after the PET study (all 5 had tumor progression by subsequent MRI: 1 died in 2 mo, 2 had surgical resection of the recurrent glioma). Thus, 18F-FLT appeared more sensitive (sensitivity, 100%; specificity, 100%) in identifying recurrent high-grade glioma than 18F-FDG PET (sensitivity, 72%; 95% CI, 58%–94%; specificity, 100%).

Newly diagnosed glioblastoma (patient 7). (A) MRI (contrast-enhanced T1-weighted image) shows large area of contrast enhancement in right frontal lobe. Both 18F-FDG PET (B) and 18F-FLT PET (C) show increased uptake in same area.

Newly diagnosed grade II oligodentroglioma (patient 20). (A) T1-weighted MR image. (B) T2-weighted MR image. (C) 18F-FDG PET. (D) 18F-FLT PET.
Comparison of Quantitative 18F-FLT and 18F-FDG Uptake in High- and Low-Grade Gliomas
18F-FLT uptake in normal brain was very low with a mean SUV of 0.34 ± 0.13 (Table 2). The average 18F-FLT SUVmax in high-grade (grade III or IV) glioma (n = 18) was 1.33 ± 0.75 (Table 2). The average 18F-FLT SUVmax values in grade II glioma (n = 4; 0.31 ± 0.08) and stable lesions (3 patients in long remission; 0.28 ± 0.06) were not significantly higher than the background (T/N ratios, 1.01 ± 0.20 and 1.02 ± 0.08, respectively). 18F-FDG had much higher absolute SUVs than 18F-FLT, with average SUVmax values of 5.45 ± 3.19, 3.16 ± 0.96, and 1.97 ± 0.55 for high-grade, low-grade glioma, and stable lesions. However, the T/N ratio was higher with 18F-FLT (T/N ratios, 3.54 ± 1.03 for 18F-FLT and 1.28 ± 0.69 for 18F-FDG) in high-grade glioma (P = 0.001). The difference between 18F-FLT and 18F-FDG SUVmax in high-grade gliomas was statistically significant (P = 0.001; Wilcoxon nonparametric test).
18F-FLT and 18F-FDG Uptake Comparisons
There was a statistically significant difference between 18F-FLT uptake in high- and low-grade gliomas (P ≤ 0.0001). There was also a statistically significant difference between 18F-FLT uptake in high-grade glioma and stable lesions (P < 0.0001). Grade III gliomas showed an intermediate level of 18F-FLT uptake with an average SUVmax of 0.91 ± 0.28 (n = 4; SUVmax range, 0.60–1.27). However, the difference of 18F-FLT uptake between grade III and grade IV glioma was not statistically significant (P = 0.06). This may have been due to the relatively small number of grade III gliomas and the relatively wide range of 18F-FLT uptake in these tumors.
There was also a statistically significant difference between 18F-FDG uptake in high- and low-grade gliomas (P = 0.02) as well as a statistically significant difference between 18F-FDG uptake in high-grade glioma and stable lesions (P < 0.001). As with 18F-FLT studies, the difference of 18F-FDG uptake in grade III and grade IV gliomas in our study was not statistically significant (P = 0.82).
Ki-67 Immunohistochemistry
Histopathology was obtained for the 14 patients who underwent surgery after the PET study. In all tumors examined, linear regression analysis indicated a much more significant correlation of the Ki-67 score with 18F-FLT SUVmax (r = 0.84; P < 0.0001) than with 18F-FDG SUVmax (r = 0.51; P = 0.07) (Fig. 4).

Linear regression analysis of maximum tumoral SUVs of 18F-FLT and 18F-FDG and Ki-67 proliferation index. Maximum 18F-FLT SUV is significant for P < 0.0001 (r = 0.84). Maximum 18F-FDG SUV is significant for P = 0.07 (r = 0.51).
Tumor Uptake of Imaging Probes, Disease Progression, and Patient Survival
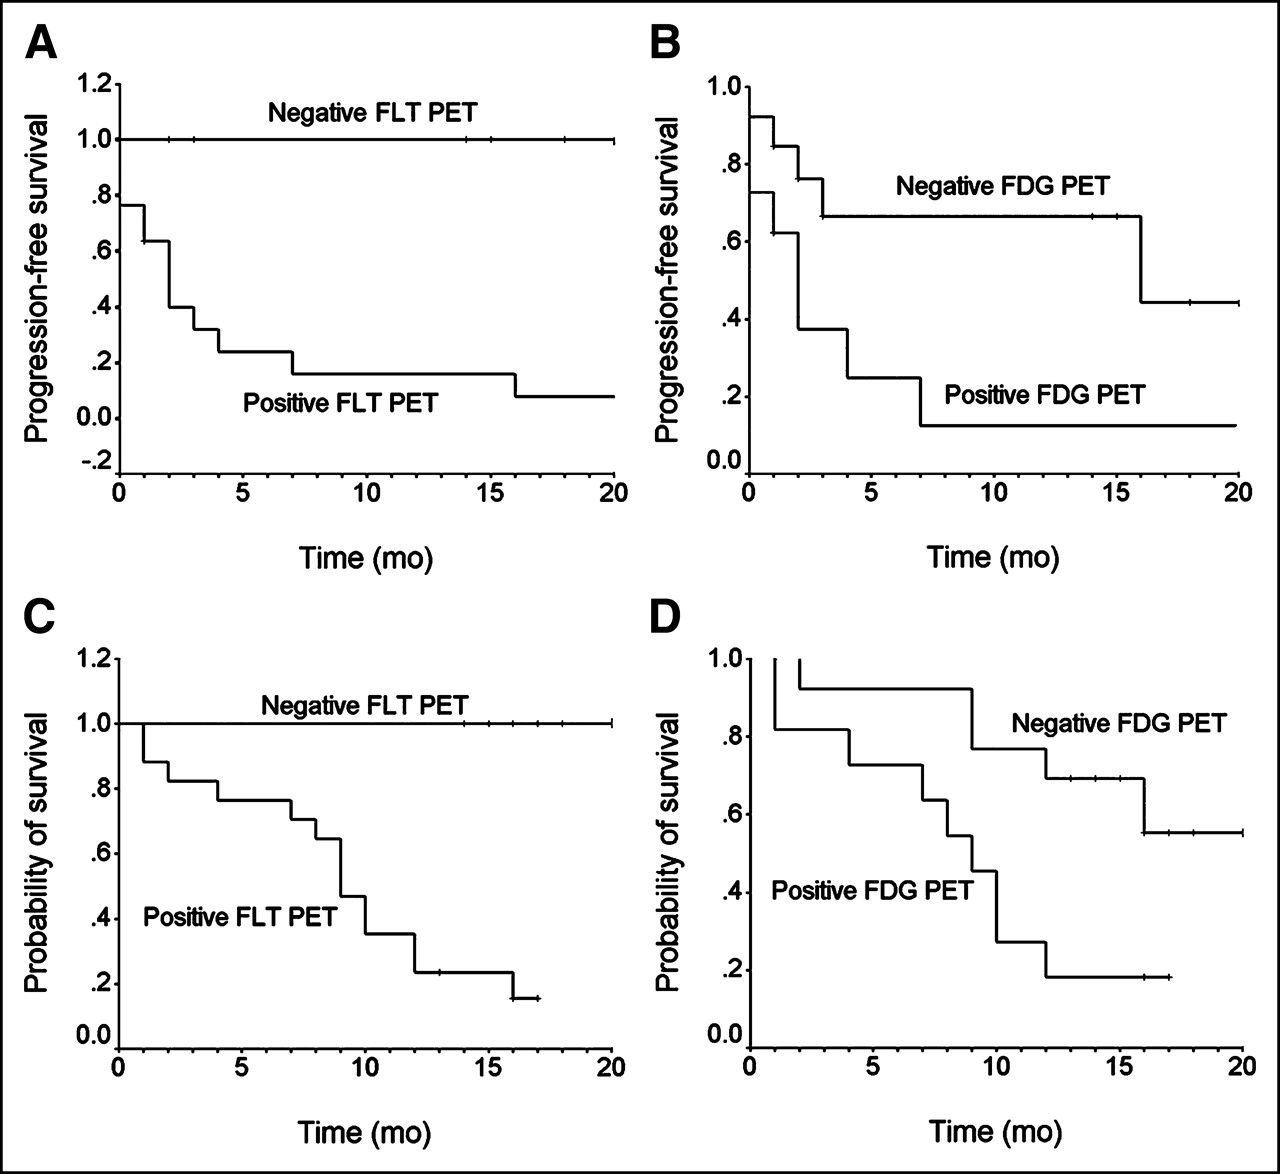
At the time of this writing, the clinical follow-up averaged 15.4 mo and ranged from 12 to 20 mo. The time to tumor progression was evaluated on the basis of the clinical MRI criteria in the follow-up studies. Using qualitative visual analysis of positive versus negative PET studies, Kaplan–Meier analysis demonstrated that 18F-FLT predicted the time to tumor progression (P = 0.0005; Fig. 5A) better than 18F-FDG PET (P = 0.03; Fig. 5B).

(A and B) Kaplan–Meier curves for progression-free survival for 25 patients comparing 18F-FLT and 18F-FDG PET results. (A) Predictive power of 18F-FLT for time to tumor progression (P = 0.0005). (B) Predictive power of 18F-FDG for time to tumor progression (P = 0.03). (C and D) Kaplan–Meier curves for survival for 25 patients comparing 18F-FLT and 18F-FDG PET results. (C) Predictive power of 18F-FLT PET for survival is significant for P = 0.001. (D) Predictive power of 18F-FDG PET for survival is significant for P = 0.06.
Fourteen patients (56%) died (mean time to death, 7.7 ± 4.5 mo) during this investigation. 18F-FLT uptake was twice as high for those patients who died compared with those who survived (1.29 ± 0.66 vs. 0.62 ± 0.36; P = 0.007). Similarly, 18F-FDG uptake was significantly higher for those patients who died than for the survivors (6.05 ± 3.48 vs. 3.42 ± 1.64; P = 0.03). ROC analysis demonstrated that 12 mo served as a useful break point for separating those who died versus those who lived with a threshold 18F-FLT SUVmax of 0.82 (sensitivity, 80%; specificity, 77.8%). A similar ROC analysis for 18F-FDG demonstrated a threshold SUVmax of 3.36 (sensitivity, 60%; specificity, 55.6%). Kaplan–Meier survival analysis demonstrated a more significant prognostic power of 18F-FLT PET (P = 0.005) than 18F-FDG PET (P = 0.08) in predicting significantly longer survival in patients with SUVmax below the thresholds than those above the thresholds.
The prognostic power of the 2 tracers in predicting patient survival can also be demonstrated using qualitative visual analysis of the PET data (positive vs. negative). Kaplan–Meier survival curves demonstrated a more significant power of 18F-FLT PET for patient survival (P = 0.001; Fig. 5C). 18F-FDG PET showed less power for predicting survival (P = 0.06; Fig. 5D).
DISCUSSION
To our knowledge, this is the first clinical study to systematically compare 18F-FLT PET with 18F-FDG PET in human gliomas in relation to sensitivity in evaluating recurrent high-grade glioma, Ki-67 proliferation indices, time to tumor progression, and patient survival. In this study, we demonstrated that glioma uptake of 18F-FLT was relatively rapid, peaking within 5–10 min. This peak activity was maintained for >1 h. Gliomas can be imaged with high-contrast 18F-FLT PET over 35 min without a delay between injection and imaging. Published studies of 18F-FLT PET in imaging extracranial tumors typically used similar uptake times as for 18F-FDG, starting at 60 min after injection. Our result is in accordance with reports by Pio et al. (23,24) and observations by Visvikis et al. (25) from dynamic 18F-FLT PET studies of breast cancer and colorectal cancers showing rapid tracer accumulation in the first 5–10 min followed by stable tracer retention. Thus, imaging can commence shortly after tracer injection and 35 min of imaging is sufficient to obtain excellent image quality.
18F-FDG PET has enjoyed wide popularity for imaging extracranial tumors. It has also been used extensively in brain tumor imaging (26). However, several studies have demonstrated diagnostic limitations of 18F-FDG PET for imaging brain tumors (26–28). 18F-FDG has shown particular difficulty in characterizing tumors in the brain due to the high basal glucose metabolic rate of normal brain tissue. 18F-FDG uptake of low-grade tumors is generally similar to that of normal white matter, and high-grade tumor uptake can be similar to that of normal gray matter, thus decreasing the sensitivity of lesion detection. We demonstrated that 18F-FLT PET uptake in gliomas had a lower SUV than 18F-FDG. However, the T/N ratio was higher than for 18F-FDG, resulting in higher image contrast, due to the low normal brain tissue uptake of 18F-FLT. This result is consistent with previously reported results (29–31) and is in contrast with 18F-FLT PET studies in extracranial tumors, where PET with 18F-FLT generally shows poorer lesion detection than with 18F-FDG. There was no detectable 18F-FLT in tumors that did not show contrast enhancement in MRI, consistent with the notion that 18F-FLT does not appear to readily cross the blood–brain barrier (29,30,32).
In this study we found that 18F-FLT was more sensitive than 18F-FDG for evaluating recurrent high-grade gliomas. It was shown previously that recurrent tumor 18F-FDG uptake could be lower than that of the normal white matter, and necrosis could have 18F-FDG uptake higher than that of the normal white matter (27,33). Thus, 18F-FLT PET has the advantage in detecting tumor recurrence since there is little uptake in normal brain. The sensitivity for detecting recurrent tumor in our studies with 18F-FDG was lower than that in some previously reported studies (33–35); this finding is likely due to the fact that one third of our study patients were considered “stable” clinically and radiographically for several months before the study. It is this patient population that frequently presents a diagnostic challenge. We found that 5 of these patients with negative 18F-FDG PET but positive 18F-FLT PET had tumor progression within 1–3 mo after the PET study. 18F-FLT PET may help to define tumor activity by imaging tumors with greater sensitivity than 18F-FDG PET. Consistently, as demonstrated by Kaplan–Meier analysis, 18F-FLT PET was a better predictor of tumor progression than 18F-FDG PET.
In this study, there was a close correlation between 18F-FLT SUVmax and Ki-67 (r = 0.84; P < 0.0001). Therefore, 18F-FLT could serve as a surrogate marker for proliferative activity in human gliomas—thus, adding to the rapidly growing list of human tumors examined with 18F-FLT PET in which a good correlation between 18F-FLT uptake and Ki-67 has been demonstrated. The 18F-FDG correlation with Ki-67 was relatively low (r = 0.51), in agreement with other studies (r = 0.41–0.73) (36,37).
A significant relationship between 18F-FLT uptake and survival was found in this study. Since proliferation has been demonstrated as the most important surrogate maker for survival of patients with gliomas (1–5), this finding provides further—though indirect—support for 18F-FLT as a marker of proliferation in vivo.
As a key limitation of the present study, it should be noted that only 3 patients with stable lesions in long-term remission as negative control subjects were available, because of the fact that most patients with high-grade gliomas generally have a fulminant clinical course and a cure is a relatively rare event. We also did not find a case of pure radiation necrosis, as the majority of our patients had high-grade gliomas and pure radiation necrosis is a relatively rare event in this patient group (38). Thus, our study provided very limited data on the specificity of 18F-FLT PET and on the use of 18F-FLT PET in the differential diagnosis of active tumor versus radiation necrosis. In addition, our study included only patients with a documented history of gliomas; thus, the specificity of 18F-FLT PET for patients with unknown brain lesions was not investigated. Finally, this study did not address the mechanism of 18F-FLT uptake. As 18F-FLT is only retained in brain tumors where there is breakdown of the blood–brain barrier, one potential concern is that 18F-FLT may be largely tracking the breakdown of the barrier. The excellent correlation of the 18F-FLT SUVs and the proliferation index, as well as the sustained uptake up to 75 min after injection, argues against this being the only process driving 18F-FLT uptake. Further study is needed to address this issue.
CONCLUSION
Prognostically useful 18F-FLT PET emission scans can be acquired beginning 5 min after injection over a 30-min period. In contrast with our experience and that of others in the study of extracranial tumors, the detection rate of gliomas was high, likely due to the very low background uptake in normal brain tissue. 18F-FLT PET was more sensitive in evaluating recurrent high-grade gliomas than 18F-FDG. 18F-FLT uptake correlated significantly better with the Ki-67 proliferation index than did 18F-FDG in brain gliomas. 18F-FLT PET also had better prognostic power than 18F-FDG to predict the time to tumor progression, as well as survival, and, therefore, may be particularly useful for assessment of therapy response (23,24,39–40). The study provided limited data on the specificity of 18F-FLT PET for nonneoplastic lesions.
Acknowledgments
This study was supported by grant P50 CA 086306 from the National Cancer Institute. The authors thank Amber Luke for administrative support, Michael Quinn for MRI database support, the UCLA Cyclotron staff for PET tracer production, and the UCLA Ahmanson Biological Imaging Center technologists Larry Pang, Jean-Richard Eugene, and Molly Lampignano for their technical support in PET acquisition.
Footnotes
Received Nov. 1, 2004; revision accepted Feb. 14, 2005.
For correspondence contact: Wei Chen, MD, PhD, Department of Molecular and Medical Pharmacology, Center for Health Sciences, AR-144, David Geffen School of Medicine, UCLA, Los Angeles, CA 90095-6942.
E-mail: weichen{at}mednet.ucla.edu
REFERENCES
In this issue


Jump to section
Related Articles
Cited By...
- STING-driven interferon signaling triggers metabolic alterations in pancreas cancer cells visualized by [18F]FLT PET imaging
- An activatable PET imaging radioprobe is a dynamic reporter of myeloperoxidase activity in vivo
- Repeatability of 18F-FLT PET in a Multicenter Study of Patients with High-Grade Glioma
- Noninvasive Evaluation of Cellular Proliferative Activity in Brain Neurogenic Regions in Rats under Depression and Treatment by Enhanced [18F]FLT-PET Imaging
- Although Non-diagnostic Between Necrosis and Recurrence, FDG PET/CT Assists Management of Brain Tumours After Radiosurgery
- Multimodality Brain Tumor Imaging: MR Imaging, PET, and PET/MR Imaging
- Efficient Radiosynthesis of 3'-Deoxy-3'-18F-Fluorothymidine Using Electrowetting-on-Dielectric Digital Microfluidic Chip
- 3'-Deoxy-3'-18F-Fluorothymidine PET Predicts Response to V600EBRAF-Targeted Therapy in Preclinical Models of Colorectal Cancer
- 3'-Deoxy-3'-18F-Fluorothymidine PET-Derived Proliferative Volume Predicts Overall Survival in High-Grade Glioma Patients
- Correlation of 18F-FLT Uptake with Tumor Grade and Ki-67 Immunohistochemistry in Patients with Newly Diagnosed and Recurrent Gliomas
- Measuring Oncogenic Signaling Pathways in Cancer with PET: An Emerging Paradigm from Studies in Castration-Resistant Prostate Cancer
- 18F-FDG PET Detects Inflammatory Infiltrates in Spinal Cord Experimental Autoimmune Encephalomyelitis Lesions
- Impact of 3,4-Dihydroxy-6-18F-Fluoro-L-Phenylalanine PET/CT on Managing Patients with Brain Tumors: The Referring Physician's Perspective
- 3'-Deoxy-3'-18F-Fluorothymidine PET and MRI for Early Survival Predictions in Patients with Recurrent Malignant Glioma Treated with Bevacizumab
- Imaging biomarkers of brain tumour margin and tumour invasion
- Multimodality Assessment of Brain Tumors and Tumor Recurrence
- Correlation of 6-18F-Fluoro-L-Dopa PET Uptake with Proliferation and Tumor Grade in Newly Diagnosed and Recurrent Gliomas
- Biodistribution and Uptake of 3'-Deoxy-3'-Fluorothymidine in ENT1-Knockout Mice and in an ENT1-Knockdown Tumor Model
- Kinetics of 3'-Deoxy-3'-18F-Fluorothymidine During Treatment Monitoring of Recurrent High-Grade Glioma
- Measuring Tumor Cell Proliferation with 18F-FLT PET During Radiotherapy of Esophageal Squamous Cell Carcinoma: A Pilot Clinical Study
- Prognostic Significance of Growth Kinetics in Newly Diagnosed Glioblastomas Revealed by Combining Serial Imaging with a Novel Biomathematical Model
- 18F-FDG PET/CT for Image-Guided and Intensity-Modulated Radiotherapy
- Molecular Imaging: 18F-FDG PET and a Whole Lot More
- Kinetic Analysis of 3'-Deoxy-3'-18F-Fluorothymidine (18F-FLT) in Head and Neck Cancer Patients Before and Early After Initiation of Chemoradiation Therapy
- Radiopharmaceuticals in Preclinical and Clinical Development for Monitoring of Therapy with PET
- Molecular Imaging of Therapeutic Response to Epidermal Growth Factor Receptor Blockade in Colorectal Cancer
- Integrin {alpha}v{beta}3-Targeted Radioimmunotherapy of Glioblastoma Multiforme
- Changes in Tumor Metabolism as Readout for Mammalian Target of Rapamycin Kinase Inhibition by Rapamycin in Glioblastoma
- Imaging of Cell Proliferation: Status and Prospects
- Antiangiogenesis Treatment for Glioblastoma Multiforme: Challenges and Opportunities
- Glioma Proliferation as Assessed by 3'-Fluoro-3'-Deoxy-L-Thymidine Positron Emission Tomography in Patients with Newly Diagnosed High-Grade Glioma
- Dynamic Small-Animal PET Imaging of Tumor Proliferation with 3'-Deoxy-3'-18F-Fluorothymidine in a Genetically Engineered Mouse Model of High-Grade Gliomas
- Predicting Treatment Response of Malignant Gliomas to Bevacizumab and Irinotecan by Imaging Proliferation With [18F] Fluorothymidine Positron Emission Tomography: A Pilot Study
- Taming Glioblastoma: Targeting Angiogenesis
- 18F-FDOPA Kinetics in Brain Tumors
- Clinical Applications of PET in Brain Tumors
- 18F-FLT PET Does Not Discriminate Between Reactive and Metastatic Lymph Nodes in Primary Head and Neck Cancer Patients
- Imaging-Guided Gene Therapy of Experimental Gliomas
- In vivo Biological Activity of the Histone Deacetylase Inhibitor LAQ824 Is detectable with 3'-Deoxy-3'-[18F]Fluorothymidine Positron Emission Tomography
- Chaperoning Drug Development with PET
- 18F-Fluoro-L-Thymidine and 11C-Methylmethionine as Markers of Increased Transport and Proliferation in Brain Tumors
- Potential of PET in oncology and radiotherapy