


Abstract
Multiple sclerosis (MS) is a heterogeneous disease with respect to lesion pathology, course of disease, and treatment response. Imaging modalities are needed that allow better definition of MS lesions in vivo. The aim of this study was to establish an MRI- and PET/CT-based imaging modality and to evaluate approved and promising PET tracers in experimental autoimmune encephalomyelitis (EAE), the animal model of MS. Methods: MRI and PET/CT scans were obtained in Dark agouti rats with EAE and healthy control rats. The PET tracers 2-18F-fluoro-2-deoxy-d-glucose (18F-FDG), 3′-deoxy-3′-18F-fluorothymidine (18F-FLT), and O-(2-18F-fluoro-ethyl)-l-tyrosine (18F-FET) were used as surrogate markers of glucose utilization, proliferative activity, and amino acid transport and protein biosynthesis. Immediately after the PET/CT scan, animals were sacrificed for autoradiography, histologic work-up, or RNA expression analysis. Results: EAE lesions were predominantly located in the spinal cord. With MRI, we were able to detect inflammatory lesions in diseased rats, which correlated well with inflammatory infiltrates as determined by histology. Increased 18F-FDG uptake was observed in spinal cord lesions in all diseased rats. Further investigation by volume-of-interest analysis demonstrated a correlation between the density of histologically proven cellular infiltrates and the 18F-FDG signal intensity in PET (FDF=3 = 5.9, P = 0.001) and autoradiography (FDF=3 = 4.2, P = 0.008). With 18F-FET and 18F-FLT, no definite uptake could be observed on PET scans, whereas autoradiography showed slight radiotracer accumulation in some lesions. Conclusion: Spinal cord inflammatory lesions in the EAE model can be noninvasively visualized in vivo using MRI and 18F-FDG PET/CT. Localized 18F-FDG uptake correlates better with a histologically proven abundance of inflammatory cells as a critical marker of disease activity than MRI. Neither 18F-FET nor 18F-FLT seems to be a suitable marker for the in vivo detection of inflammatory lesions.
Multiple sclerosis (MS) is considered a chronic inflammatory disease of the central nervous system (CNS) of autoimmune origin (1). The pathologic hallmarks of the disease are focal inflammatory lesions in the brain and spinal cord, leading to blood–brain barrier breakdown, demyelination, and axonal damage (2,3). MS is the most frequent nontraumatic cause for disability among young adults in Northern America and Europe (4). However, the course and underlying lesion pathology seem to be quite heterogeneous (5,6). Fortunately, within recent years several disease-modifying drugs have been discovered that ameliorate the course of disease (7). Yet, therapies with high efficiency often come with potentially severe side effects, making it necessary to carefully weigh their risks and benefits. On the other hand, clinical trials have demonstrated that the long-term effect of disease-modifying drugs is high at the beginning of the disease and vanishes by the time the secondary progressive phase of the disease is reached (8,9). This observation is supported by findings that show intense inflammatory activity at the early stages of the disease process that decreases over time (10). Patients and physicians are challenged to make early treatment decisions with long-term impact, often in young patients with little or no disability. Therefore, we need sensitive tools to stratify MS patients before initiation of therapy and to monitor disease activity and response to therapy in vivo.
MRI is the gold standard in imaging MS pathology in vivo (11). For routine practice T2-weighted images, T1-weighted images with and without contrast agent, and fluid-attenuated inversion recovery images provide excellent anatomic information on lesion location and blood–brain barrier leakage. Furthermore, new MRI techniques have been developed that allow the detection of specific pathologic changes of disease (12,13). Nevertheless, MRI provides only limited information on metabolic changes or signal alterations on the molecular level. Because inflammatory processes go along with several changes in metabolic activity, the aim of the present study was to evaluate the potential of multiple PET tracers as part of a multimodal imaging study to characterize inflammatory lesions in an animal model of MS (experimental autoimmune encephalomyelitis [EAE]). EAE-diseased rats and healthy rats for control (HC) were examined with MRI and PET/CT. For verification of the MRI and PET signal, an ex vivo autoradiography and histologic work-up or RNA expression analysis were accomplished.
PET typically depicts tissue metabolism, depending on the tracer being applied. The most widely used PET tracer is the radiolabeled glucose analog 2-18F-fluoro-2-deoxy-d-glucose (18F-FDG). It is known that activation of T lymphocytes and macrophages leads to a rapidly increased glucose uptake in these cells mainly via the glucose transporter 1, which is independent of insulin (14–16). Of note, glucose can diffuse through the intact blood–brain barrier.
In addition, inflammation may go along with proliferation of inflammatory cells (17). The thymidine analog 3′-deoxy-3′-18F-fluorothymidine (18F-FLT) has recently been suggested as a surrogate marker of DNA replication. It depicts cellular proliferation through phosphorylation and trapping by the thymidine kinase 1, which is the rate-limiting enzyme in the thymidine salvage pathway (18). In oncology, 18F-FLT has been established as a specific marker for the in vivo assessment of cell proliferation (19), and it has been suggested as a potential probe for imaging lymphocyte proliferation in autoimmunity (20). Therefore, we investigated whether 18F-FLT enables visualization of proliferative activity of immune cells in the formation of EAE lesions.
Because 18F-FET uptake was observed in patients with tumefactive MS lesions, we also investigated the tracer O-(2-18F-fluoro-ethyl)-l-tyrosine (18F-FET) (21). 18F-FET uptake correlates with amino acid transport (22) and represents a marker to measure increased protein biosynthesis.
MATERIALS AND METHODS
Animals and Induction of EAE
Female dark agouti rats were obtained from Janvier. All experiments were approved by the governmental agencies for animal research and were performed in accordance with the local guidelines for animal experimentation. At the time of immunization, rats were 10–12 wk old. Animals were immunized at the base of the tail with 60 μg of recombinant rat myelin-oligodendrocyte-glycoprotein per animal intradermally in complete Freund adjuvant supplemented with inactivated Mycobacterium tuberculosis H37RA (0.75 mg/mL) (Difco). Clinical signs of EAE were assessed using the following EAE score: 0, no signs of disease; 1, loss of tone in the tail; 2, hind limb paresis; 3, hind limb paralysis; 4, tetraplegia; and 5, moribund. For imaging studies only, rats with a disease duration of 10–14 d and an EAE score between 2 and 3.5 were used to ensure a comparable stage of disease. These rats had experienced at least 1 relapse. Healthy, nonimmunized animals served as a control.
MRI
MRI was performed with a Philips 3-T Achieva scanner. Before the MRI scanning, animals were anesthetized by intramuscular injection at the right hind leg with a mixture containing 50 μg of medetomidine (Pfizer), 600 μg of midazolam (Ratiopharm), and 1.5 μg of fentanyl (Delta-Select). As a contrast agent, 300 μL of gadopentetate-dimeglumine (Magnograf; 0.5 mmol/mL [Marotrast]) were injected intravenously into the tail. Two EAE animals did not receive contrast agent, and therefore no T1 image was acquired. First, axial images of the brain were obtained with a resolution of 220 μm × 280 μm × 1 mm for T2 images and 320 μm × 320 μm × 1 mm for T1 images after the injection of contrast. Afterward, scans of the spinal cord were obtained in the sagittal direction using a resolution of 360 × 250 × 500 μm for T2 and 300 × 190 × 500 μm for T1 after the injection of contrast.
PET/CT
On the same day as the MRI scan, EAE animals underwent imaging with PET and, for better anatomic localization, CT coregistration using an Inveon small-animal PET/CT scanner (Siemens Preclinical Solutions). For PET/CT, isoflurane inhalation anesthesia was applied. About 13 MBq of the 18F-labeled tracer were injected intravenously, and dynamic images were acquired for 75 min. PET spatial resolution was 1.4 mm3. 18F-FDG, 18F-FET, and 18F-FLT were produced at the Department of Nuclear Medicine according to current good manufacturing practices. Immediately after the PET/CT scan, animals were sacrificed for either autoradiography and histology or RNA work-up.
Image Processing and Volume-of-Interest (VOI) Analysis
For image reconstruction of PET/CT scans, the ordered-subset expectation maximization 2-dimensional algorithm was applied. Image processing of PET/CT and MRI scans and VOI analysis was performed using Inveon Research Workplace software (Siemens Preclinical Solutions). VOIs were delineated in 3 dimensions on T2-weighted MR images and CT images. Coregistration of PET images was used to ensure consistency of anatomic localization. VOIs were drawn of each spinal cord segment (C1–C7, T1–T13, and L1–L3). The spinal disk and intervertebral space (for T2 and CT images, respectively) were used to define the height of the spinal cord segment. For technical reasons, VOI analysis was not possible for T2 images in 1 EAE animal and for T1 images after contrast administration in 2 EAE animals. To compare RNA expression levels and image signal intensities, the VOIs of the same 4 spinal cord segments, which were used for RNA extraction, were applied.
Autoradiography
Ex vivo autoradiography was done immediately after the PET scan. The brain and spinal cord were cut into 12-μm sagittal sections on a cryostat (Leica Microsystems) and covered with a scintillation foil (Decon DC Science Tec). Digital autoradiography images with a resolution of 25 μm were acquired for 12 h on a μ-Imager (Biospace Lab). Data were processed with β-Vision+ software (Biospace Lab).
Histopathology and Immunohistochemistry
The same sections that had been used for autoradiography were stained with hematoxylin and eosin (HE) to assess inflammation. In adjacent sections, immunohistochemistry was performed with antibodies against CD4-positive T cells (CD4, clone W3/25; AbDserotec) and against macrophages and activated microglia (CD68, clone ED1; AbDserotec). Briefly, acetone-fixed sections were preincubated with 10% bovine serum albumin and afterward with peroxidase blocking solution (Dako). Sections were incubated with the primary antibody diluted 1:400 in 1% bovine serum albumin overnight. After being washed, the biotinylated secondary antibody diluted 1:200 in 1% bovine serum albumin was applied for 2 h at room temperature (Abcam). Finally, bound antibodies were visualized with extravidin peroxidase (ExtrAvidin-Peroxidase; Sigma-Aldrich) and the liquid DAB+ substrate Chromogen System (Dako) according to the manufacturer’s instructions. Counterstaining was performed with hematoxylin. Control sections were incubated in the absence of primary antibodies and with isotype control antibodies.
Localization of lesions was determined blinded in a descriptive manner and semiquantitatively. Following a published semiquantitative scoring system (23), the density of cellular infiltrates for each vertebral segment was determined using a score with 4 categories: 0, no lesions; 1, mild infiltrate; 2, moderate infiltrate; and 3, severe infiltrate. Scores were assessed in HE-stained tissue and adjacent sections of anti-CD4– and anti-CD68–stained tissue separately. The length of each vertebral segment was determined by the corresponding T2 MR images. For comparison of histologically proven cellular infiltrates with the VOI signal intensity, data scores of the HE-stained tissue were applied.
RNA Isolation and Real-Time Polymerase Chain Reaction (PCR)
For RNA isolation, the CNS was divided into the following segments: cerebrum right side, cerebrum left side, cerebellum and brain stem, and 4 distinct spinal cord segments. The isolation of RNA (RNeasy; Qiagen) and its quantification and the reverse transcription reactions (High-Capacity RT Kit; Applied Biosystems) were performed according to established protocols. Expression of messenger RNA of target genes and the endogenous control gene glyceraldehyde-3-phosphate dehydrogenase were assessed by real-time PCR using TaqMan Gene Expression Assay products on a StepOne Plus PCR System (Applied Biosystems) according to manufacturer’s recommendations. Expression levels for each gene of interest were calculated by normalizing the quantified messenger RNA amount to glyceraldehyde-3-phosphate dehydrogenase. Relative gene expression was determined for the spinal cord segments of each animal using the upper spinal cord segment as a reference. The following gene expression assays (Applied Biosystems) were used: CD4 (Rn00562286_m1) and CD68 (Rn01495632_g1).
Statistical Analysis
Analyses were performed using PASW statistics software (release 18.0.1; SPSS Inc.). To allow comparison between animals, VOI signal intensity data of each imaging modality were standardized via z-transformation. Therefore, group differences in z scores can be interpreted as relative distances, measured on the scale of SD (e.g., a z score group difference of 1 corresponds to a difference of 1 within-group SD). Linear mixed-regression models (LMM) were used to analyze differences in VOI signal intensity in consideration of numerous measurements per individual. On the basis of the results of the LMM analysis, marginal means and SEs were estimated for the cell-density groups being compared. Box plot figures were used to display the interquartile range, median, minimum, and maximum of measured intensity values within subgroups, noting that marginal mean estimates of the LMM model might slightly differ from the raw median values. Omnibus group comparisons (overall tests) were conducted using the LMM models, and the corresponding P values and F statistics, with degrees of freedom, were reported. Post hoc pairwise tests of all possible group contrasts were corrected by the Holm–Bonferroni method (24). To warrant a global α-error level of 5%, only adjusted 2-sided P values less than 0.05 were considered statistically significant.
RESULTS
18F-FDG
Thirteen EAE and 6 HC animals underwent MRI and 18F-FDG PET/CT. Five EAE and 3 HC animals were used for ex vivo 18F-FDG autoradiography and histology. In 6 EAE and 3 HC animals, RNA expression analysis was performed. Lesions were predominantly located in the spinal cord and less frequently in the brain stem and cerebellum. A summary of identified lesions is displayed in Table 1. Representative T1-postcontrast and T2 MRI and 18F-FDG PET/CT scans are shown in Figure 1. In 12 of 13 EAE animals, inflammatory lesions were detected by MRI. One EAE animal had no detectable lesions on the MRI scan. Increased focal 18F-FDG uptake, as interpreted visually by reading tomographic sections of the brain and spinal cord, was observed in the spinal cord of all EAE rats but in none of the HCs. Even EAE animal 9, whose MRI findings were negative, had a PET scan showing slightly increased focal 18F-FDG uptake in the spinal cord. Because of a high background signal only in 2 of 5 animals with histologically proven infiltrates of the brain stem, lesions in the brain were observed with 18F-FDG PET. In cases for which focal 18F-FDG enhancement was seen in the fossa cranii posterior, no precise anatomic localization could be determined with 18F-FDG PET/CT, although lesions were observed by MRI. To further verify the observed PET signal, ex vivo autoradiography was performed.
Summary of Lesions in EAE and HC Animals

(A) Representative scan of spinal cord (EAE animal 5) with T1-postcontrast MRI, T2 MRI, 18F-FDG PET, and 18F-FDG PET/CT. T2 lesions and contrast-enhanced T1 lesions are seen reaching from lower thoracic spinal cord to conus. Increased focal 18F-FDG uptake corresponding to this MRI signal is seen. In addition, in upper thoracic spine slight, gadolinium-negative signal change can be observed with T2-weighted MRI and PET. (B) Relative signal intensity in VOIs of same EAE animal on 18F-FDG PET, T1-postcontrast MRI, and T2 MRI. Analysis confirms increase of 18F-FDG uptake in lower thoracic spinal cord and conus. In contrast, in HC animals PET signal decreases from cranial to caudal spinal cord. Mean and SD are given for HC animals (n = 3).
The signal intensity and signal distribution of 18F-FDG autoradiography was identical to histologically determined cellular infiltrates seen on HE-stained sections and on CD68 and CD4 immunohistochemistry (Fig. 2A). None of the HC animals exhibited a focal increase of the radioactive signal on 18F-FDG ex vivo autoradiography (Fig. 2B).

18F-FDG ex vivo autoradiography of EAE-diseased rat 5 (A) and HC (B). Immediately after PET scan, brain stem, cerebellum, and spinal cord were cut into 12-μm sagittal sections. (C) Same sections that had been used for autoradiography were stained with HE to assess inflammation (×20). Immunohistochemistry of CD68-positive (D) and CD4-positive (E) cells was performed in adjacent sections. Signal intensity and signal distribution of 18F-FDG autoradiography was identical to localization and density of histologically proven cellular infiltrates. The arrow in A marks the area of which the histologic analysis is shown in C–E.
Lesions that extended over several segments on the MRI and PET scans were often detected as 2 or more independent lesions by histochemistry. Therefore, counting the number of lesions to assess sensitivity or specificity was not feasible. To quantify and to further evaluate the 18F-FDG uptake, we chose an analysis with VOIs for each vertebral segment and each imaging modality. In histology, the density of cellular infiltration was determined semiquantitatively using a score ranging from 0 to 3. We performed a blinded single-subject analysis and an analysis for the EAE and HC groups. In all of the HC animals, the signal intensity of the T1 and T2 MRI signal remained constant over the spinal cord, but the 18F-FDG PET signal decreased from the cranial to the caudal spinal cord. Diseased rats showed a focal increase of the T1, T2, and PET signals in areas of inflamed tissue (Fig. 1B).
On a group level, standardized 18F-FDG PET signal intensity was significantly different in the 4 categories of histologically determined cellular infiltrates (FDF=3 = 5.9, P = 0.001) (Fig. 3). In tissue without histologically proven infiltrates, the mean 18F-FDG PET signal was −0.201 (SE, 0.188); in VOIs with mild infiltrates, the mean 18F-FDG PET signal was −0.091 (SE, 0.186); in VOIs with moderate infiltrates, the mean 18F-FDG PET signal was 0.651 (SE, 0.236); and in areas with severe infiltrates, the mean 18F-FDG PET signal was 0.771 (SE, 0.324). In HCs, the mean 18F-FDG PET signal was −0.023 (SE, 0.015).
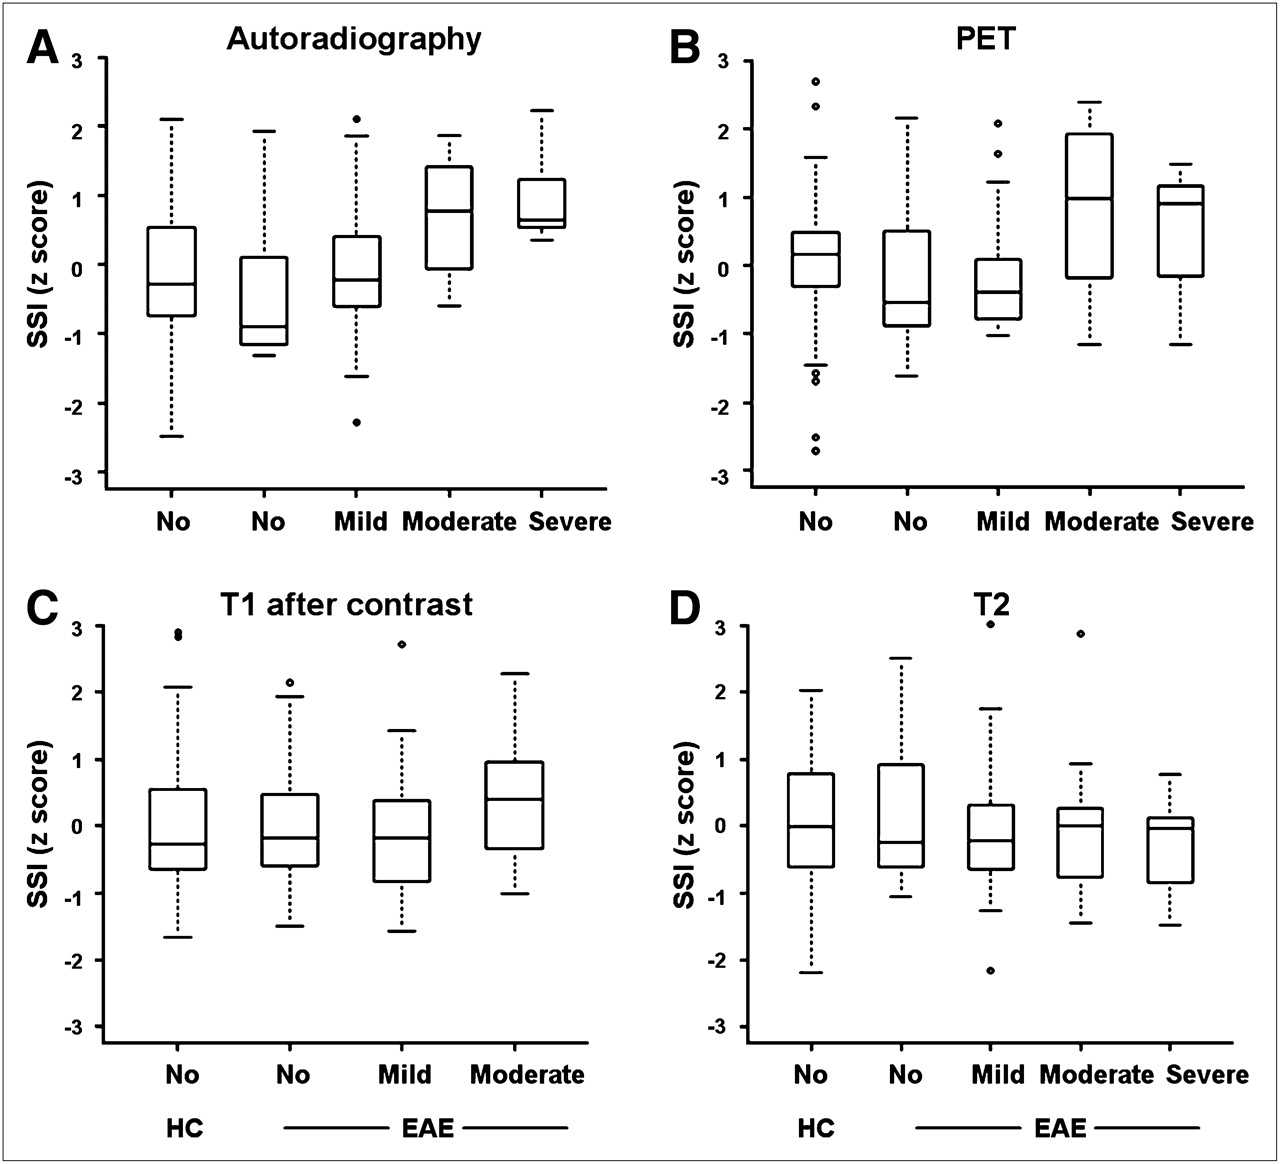
Standardized signal intensity (SSI) for different imaging modalities is correlated with density of infiltrating cells in HE staining. VOIs for each vertebral segment and each imaging modality were acquired: 18F-FDG autoradiography (EAE, n = 5; HC, n = 3), 18F-FDG PET (EAE, n = 5; HC, n = 3), T1-postcontrast MRI (EAE, n = 3; HC, n = 3), and T2 MRI (EAE, n = 4; HC, n = 3). Box plot figures display interquartile range, median, minimum, and maximum of measured intensity values within subgroups. 18F-FDG signal intensity in autoradiography (A) and PET (B) was significantly different in 4 categories of histologically determined cell density, whereas only a trend was observed with T1- and T2-weighted MRI scans (C and D).
Analysis of 18F-FDG autoradiography also showed a significant difference in 18F-FDG uptake within the 4 histologic categories of cellular infiltration (FDF=3 = 4.2, P = 0.008) (Fig. 3). The mean 18F-FDG autoradiography signal of tissue without inflammatory infiltrates was −0.260 (SE, 0.187). In tissue with mild infiltrates, the mean 18F-FDG signal was −0.137 (SE, 0.185); in tissue with moderate infiltrates, the mean 18F-FDG signal was 0.238 (SE, 0.256); and in tissue with severe infiltrates, the mean 18F-FDG signal was 0.997 (SE, 0.347). In HCs, the mean 18F-FDG autoradiography signal was −0.154 (SE 0.128).
Neither T1-postcontrast nor T2 signal intensities were statistically different among the groups defined by the extent of cellular infiltrates (P = 0.476 and 0.813, respectively), although a tendency toward a higher signal in the groups with denser cellular infiltrates could be observed. For T1, mean signal intensity was −0.027 in unaffected tissue (SE, 0.196), −0.086 in mildly affected tissue (SE, 0.192), and 0.392 in moderately affected tissue (SE, 0.351). In HCs, the mean T1 signal was 0.004 (SE, 0.006). T2 returned a mean signal intensity of 0.116 in unaffected tissue (SE, 0.192), −0.063 in mildly affected tissue (SE, 0.200), −0.061 in moderately affected tissue (SE, 0.298), and −0.243 in severely affected tissue (SE, 0.388). In HCs, the mean T2 signal was 0.010 (SE, 0.006).
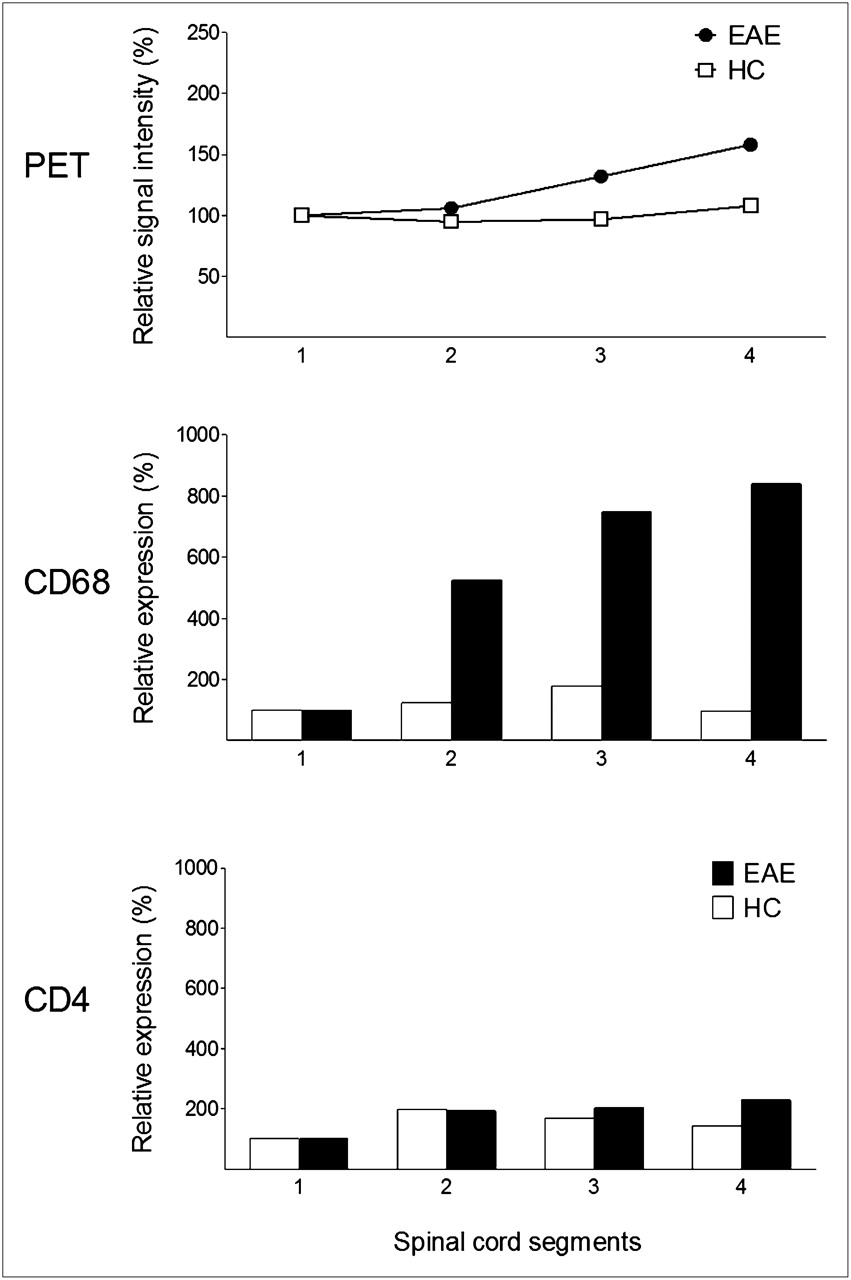
However, in the multiple pairwise post hoc comparisons, only differences in autoradiography z-values between severely affected tissue and tissue without histologically proven infiltrates (P = 0.013) and between severely affected tissue and mildly affected tissue (P = 0.0499) yielded statistically significant results (Supplemental Table 1; supplemental materials are available online only at http://jnm.snmjournals.org). RNA expression analysis showed in 4 of 6 animals a relative increase of CD4 and CD68 expression in spinal cord segments. In 2 of the 4 animals with positive results, the 18F-FDG PET signal of the corresponding VOI was increased (Fig. 4), whereas in the other 2 animals no increase of the 18F-FDG uptake in the corresponding VOI was observed. On a group level, there was no significant correlation of the VOI value and the RNA expression level for any imaging modalities (P = 0.426).

CD4 and CD68 RNA expression analysis in 4 definite spinal cord segments and corresponding VOIs of 18F-FDG showed increase mainly of CD68-expressing cells corresponding to PET signal (representative EAE animal 8).This increase was not observed in any HCs.
18F-FLT
In 7 EAE animals, MRI and 18F-FLT PET was applied. Inflammatory lesions were verified with either histologic work-up (n = 4) or RNA expression analysis (n = 3). Six HCs were measured as a control. In 2 EAE animals with only a marginal increase of messenger RNA expression levels of CD4 and CD68, no lesions were detected with MRI. Apart from 1 EAE animal, PET showed a slight focal increase of the 18F-FLT signal in the spinal cord, which was not observed in HCs. However, definite lesion detection with 18F-FLT PET was not possible. 18F-FLT autoradiography showed rather diffuse radiotracer accumulation in some histologically proven lesions, which was not seen in control rats (Supplemental Fig. 1). Tracer uptake in affected tissue was up to 3.5-fold more than in nonaffected tissue and was restricted to severely infiltrated lesions.
18F-FET
The results for 18F-FET were similar to those described for 18F-FLT. Nine EAE rats underwent imaging with 18F-FET. In 4 of these animals, histology and ex vivo autoradiography were performed, and in 5 of these animals RNA expression levels were investigated. Six HCs served as a control. Despite the obvious inflammatory infiltrates seen on histology, the RNA expression levels, and the MRI findings, no reliable lesion detection was possible with 18F-FET. Some of the EAE animals had a slight (up to 2-fold) and rather diffuse increase of the 18F-FET signal on ex vivo autoradiography, corresponding to the locations of the severe infiltrates seen on histology (Supplemental Fig. 2).
DISCUSSION
MS is a chronic and often debilitating disease. However, during the course of the disease, inflammatory activity in the CNS often remains clinically silent. New markers are needed to measure disease activity in MS. Ideally, new imaging techniques should allow visualization of lesion pathology, elucidation of disease processes, and monitoring of disease activity in clinical and preclinical settings. In the field of oncology, introduction of the imaging of biochemical processes with PET probes has strongly improved the monitoring of treatment response (25). Although the inflammatory process of MS involves changes in metabolic activity, so far only a few PET studies have been undertaken with approved PET tracers to image inflammatory lesions in vivo (26–28). Radu et al. were the first to investigate the radiolabeled glucose analog 18F-FDG in the EAE model (26) as a marker of cellular glucose uptake and glucose phosphorylation. Their work provides evidence that 18F-FDG accumulates in the CNS of EAE animals but not in control animals. However, no direct correlation of 18F-FDG PET with histology, autoradiography, or MRI was applied.
Thus, in the present study we investigated a multiparametric approach toward molecular imaging of neuroinflammation in a well-characterized rat EAE model of MS. We demonstrate retention of the glucose analog 18F-FDG in inflammatory CNS lesions using histopathology and autoradiography or RNA expression levels of CD4- and CD68-positive cells as a reference. Spinal cord infiltrates were observed in all diseased EAE rats. Thus, the sensitivity of 18F-FDG for lesion detection in the spinal cord was high. The amount of focal 18F-FDG uptake correlates with the density of cellular infiltration in spinal cord lesions as determined by histology, especially with the accumulation of CD68-positive cells. Because of a high background signal, sensitivity for lesion detection with 18F-FDG in the brain was low. Besides histology, we chose RNA expression levels of CD4 and CD68 as a reference. To do so, the CNS had to be divided into distinct segments. However, RNA expression levels of CD4 and CD68 revealed in only 4 of 6 animals an increase in the spinal cord segments that we had chosen. Thus, it appears that segments were too large to allow detection of small lesions, which is also possibly why no significant 18F-FDG uptake was seen in the RNA VOI analysis group. Despite clear visualization of EAE lesions with MRI, VOI analysis of T1-postcontrast and T2 signal intensities were not significantly different in histologic categories, possibly because of a high variability in intensity values within groups. Moreover, the MRI signal of MS lesions does not necessarily reflect infiltration of inflammatory cells but can also be attributed to edema, demyelination, or gliosis (29). Nevertheless, as expected, MRI enabled better structural resolution of inflammatory lesions. Therefore, combined PET/MRI will be of advantage.
Because 18F-FDG shows a high background activity in the CNS due to the high physiologic glucose consumption of the brain, we aimed to investigate 2 other approved PET tracers that might accumulate more specifically in inflamed tissue. Whereas 18F-FDG rapidly passes the intact blood–brain barrier (30), 18F-FET crosses the intact blood–brain barrier via a specific stereoselective amino acid transport system at only low levels (<3% of the injected dose) (22). 18F-FLT transport mechanisms across the blood–brain barrier are not yet defined; however, 18F-FLT uptake is known to be low in the normal brain (31).
Therefore, 18F-FLT, a molecular marker of proliferation, has been studied in the EAE model. Whereas 18F-FLT seems highly specific for imaging of S-phase fraction and, hence, proliferative activity of malignant tumors (32), tracer uptake in inflammatory lymph nodes of the head and neck has also been reported (33). However, no specific retention of 18F-FLT could be noticed on noninvasive PET images in the EAE model. The more sensitive autoradiography revealed specific tracer retention in larger, severely affected CNS lesions. This finding indicates that some proliferation may occur in inflammatory lesions, but this process seems to be below the threshold of detection of noninvasive imaging with PET. Because the 18F-FLT uptake was quite diffuse, it may depict rather proliferation of oligodendrocytes and astrocytes in the demyelinated lesion than proliferation of immune cells.
18F-FET is a surrogate marker of amino acid transport and therefore is of interest for studying the metabolic activity of inflammatory lesions. In addition, 18F-FET shows significantly lower background activity in the CNS than does the glucose analog 18F-FDG. Similar to our findings using 18F-FLT, no retention of 18F-FET in inflammatory CNS lesions could be detected by PET, and only mild and diffuse tracer retention was observed with autoradiography. We cannot rule out the possibility that the observed accumulation of 18F-FLT and 18F-FET in autoradiography was caused solely by blood–brain barrier leakage of EAE lesions.
CONCLUSION
In vivo imaging of molecular processes of inflammatory lesions in the EAE model is possible as shown with 18F-FDG PET. This approach might be useful to evaluate disease activity before structural changes have occurred as measured by MRI. An ideal PET tracer for imaging inflammatory MS lesions would pass also through the intact blood–brain barrier, it would enrich specifically in the inflamed tissue with no background signal of the surrounding healthy tissue, and it would provide a sensitive signal of changes in the degree of inflammatory activity. Thus, imaging biochemical processes with PET might also contribute to evaluating pathophysiologic processes in preclinical research.
DISCLOSURE STATEMENT
The costs of publication of this article were defrayed in part by the payment of page charges. Therefore, and solely to indicate this fact, this article is hereby marked “advertisement” in accordance with 18 USC section 1734.
Acknowledgments
We appreciate the expert contributions of Sybille Reder and Marco Lehmann from the Preclinical Imaging Laboratory at the Department of Nuclear Medicine and Hortenzia Jacobi from the Laboratory of the Department of Neurology at TUM. We also thank Reingard Senekowitsch-Schmidtke for her great help and valuable discussions. The study was supported by the German Research Foundation (He2386/7-1 and KO 2964/3-1). No other potential conflict of interest relevant to this article was reported.
Footnotes
↵* Contributed equally to this work.
Published online Jun. 27, 2012.
- © 2012 by the Society of Nuclear Medicine and Molecular Imaging, Inc.
REFERENCES
- Received for publication January 1, 2012.
- Accepted for publication April 4, 2012.


