


Abstract
PET studies have been performed using the amyloid binding radiotracer Pittsburgh Compound B (PIB). Previous quantitative analyses using arterial blood showed that the Logan graphical analysis using 90 min of emission data (ART90) provided a reliable measure of PIB retention. This work reports on simplified methods of analysis for human PIB imaging. Methods: PIB PET scans were conducted in 24 subjects (6 Alzheimer’s disease [AD], 10 mild cognitive impairment [MCI], 8 controls) with arterial blood sampling. Retest scans were performed on 8 subjects (3 AD, 1 MCI, 4 controls) within 28 d. Data were analyzed over 60 and 90 min using the Logan analysis and (a) metabolite-corrected input functions based on arterial plasma (ART60, ART90), (b) carotid artery time–activity data with a population average metabolite correction (CAR60, CAR90); and (c) cerebellar reference tissue (CER60, CER90). Data also were analyzed using the simplified reference tissue method (SRTM60, SRTM90) and a single-scan method based on late-scan ratios of standardized uptake values (SUVR60, SUVR90). Results: All methods of analysis examined effectively discerned regional differences between AD and control subjects in amyloid-laden cortical regions, although the performance of the simplified methods varied in terms of bias, test−retest variability, intersubject variability, and effect size. CAR90 best agreed with ART90 distribution volume ratio (DVR) measures across brain regions and subject groups and demonstrated satisfactory test−retest variability (±7.1% across regions). CER90 and CER60 showed negative biases relative to ART90 in high-DVR subjects but had the lowest test−retest variability. The single-scan SUV-based methods showed the largest effect sizes for AD and control group differences and performed well in terms of intersubject and test−retest variability. Conclusion: Of the simplified methods for PIB analysis examined, CAR90 provided DVR measures that were most comparable to ART90; CER90 was the most reproducible and SUVR90 produced the largest effect size. All simplified methods were effective at distinguishing AD and control differences and may be effectively used in the analysis of PIB. SUVR60 data can be obtained with as little as 20 min of PET emission data collection. The relative strengths and limitations of each method must be considered for each experimental design.
Recent advances in antiamyloid therapeutics have motivated the development of PET and SPECT agents for noninvasive imaging of amyloid deposits (1–4). Recently, our group reported the preclinical development of such an agent, [N-methyl-11C-2-(4′-methylaminophenyl)-6-hydroxybenzothiazole, or more simply named Pittsburgh Compound B (PIB) (5). We and others have extended preclinical studies to include proof-of-concept trials in human Alzheimer disease (AD) subjects (6–8). Proof-of-concept PIB PET studies of mild AD (n = 16) and healthy control subjects (n = 9) showed greater standardized uptake values (SUVs) in brain areas of AD patients, relative to controls (e.g., frontal cortex, >2-fold; P < 0.002), known to contain significant amyloid deposits in AD (6). Fully quantitative PIB PET studies that included MRI, arterial input function determination, and 90 min of PET data acquisition have recently been performed (9). These studies (5 AD, 5 mild cognitive impairment [MCI], and 5 control subjects) verified that the level and pattern of the SUV measures were consistent with those observed for the quantitative PIB retention measures (e.g., distribution volume [DV]) and showed marked differences in the magnitude and distribution of PIB binding measures in AD subjects as compared with controls, whereas MCI subjects were found to have either “control-like” or “AD-like” patterns of PIB retention. Both compartmental and graphical analyses showed the most significant differences in PIB retention between AD and controls in posterior cingulate gyrus, parietal cortex, and frontal cortex, whereas nonspecific PIB retention was similar for both groups (9). Variability and difficulty in the estimation of small compartmental parameters (e.g., k4 in areas of low signal) favored the use of Logan graphical analysis and the distribution volume ratio (DVR) outcome measure for the assessment of PIB retention. These studies demonstrated that it is feasible to obtain the fully quantitative PIB PET data that are needed for the validation of simplified methods of analysis. The application of simplified methods would be advantageous in studies with larger subject populations or with populations that are difficult to study (e.g., severe AD subjects).
This paper describes our efforts to extend the quantitative PIB studies of Price et al. (9) to include an evaluation of simplified methods of analysis with 9 additional subjects (n = 24). The simplifications included a shorter scan duration, the use of image-derived cerebellar or carotid time–activity data in lieu of an arterial input function, and a single late-scan SUV-based method.
MATERIALS AND METHODS
Human Subjects
AD subjects (n = 6), controls (n = 8), and MCI subjects (n = 10) were recruited and evaluated through the University of Pittsburgh Alzheimer Disease Research Center (ADRC) as previously reported (9). Table 1 describes the subject characteristics including age, Mini-Mental State Examination (MMSE) score, and sex. All subjects or their caregiver provided informed consent for both the ADRC examination and the PET protocol. This study was approved by the Institutional Review Board of the University of Pittsburgh.
Subject Demographics
Radiosynthesis
The radiosynthetic method used to produce PIB underwent considerable refinement during the course of these studies. In a subset of the initial studies (n = 7), PIB was synthesized using methods previously described by our group (2,5). Later studies (n = 17) were conducted using the refined method of Wilson et al. (10) as described in Price et al. (9). The average injected doses and specific activities (SAs) were similar between the 8 healthy controls (dose, 488.4 ± 107.3 MBq; SA, 47.8 ± 21.7 GBq/μmol), 10 MCI patients (dose, 510.6 ± 77.7 MBq; SA, 45.9 ± 24.9 GBq/μmol), and 6 AD patients (dose, 514.3 ± 96.2 MBq; SA, 31.3 ± 18.1 GBq/μmol).
Imaging
MRI and PET was performed as previously described (9). Briefly, PET data were acquired using a Siemens/CTI ECAT HR+ scanner (3-dimensional [3D] mode, 63 image planes, 15.2-cm axial field of view [FOV]) after the injection of 370–555 MBq of high-SA (>21.4 GBq/μmol) PIB. PET data were acquired over 90 min (34 frames: 4 × 15 s, 8 × 30 s, 9 × 60 s, 2 × 180 s, 8 × 300 s, 3 × 600 s). Emission data were corrected for attenuation, scatter (11), and radioactive decay and reconstructed using filtered backprojection. The reconstructed image resolution was ∼6-mm full width at half maximum in the transverse and axial planes. Test−retest variability was assessed for 8 subjects (Table 1) who completed a second PIB imaging session within 8–28 d of the baseline study. Before the PET session, a spoiled gradient recalled (SPGR) MR scan was obtained for each subject for MRI/PET image coregistration and anatomic region-of-interest (ROI) definition. A 2-component MRI-based partial-volume correction was used to correct the PET data for the dilutional effect of expanded cerebrospinal fluid (CSF) spaces associated with normal aging and disease-related atrophy (12,13).
Image Coregistration and ROI Definition
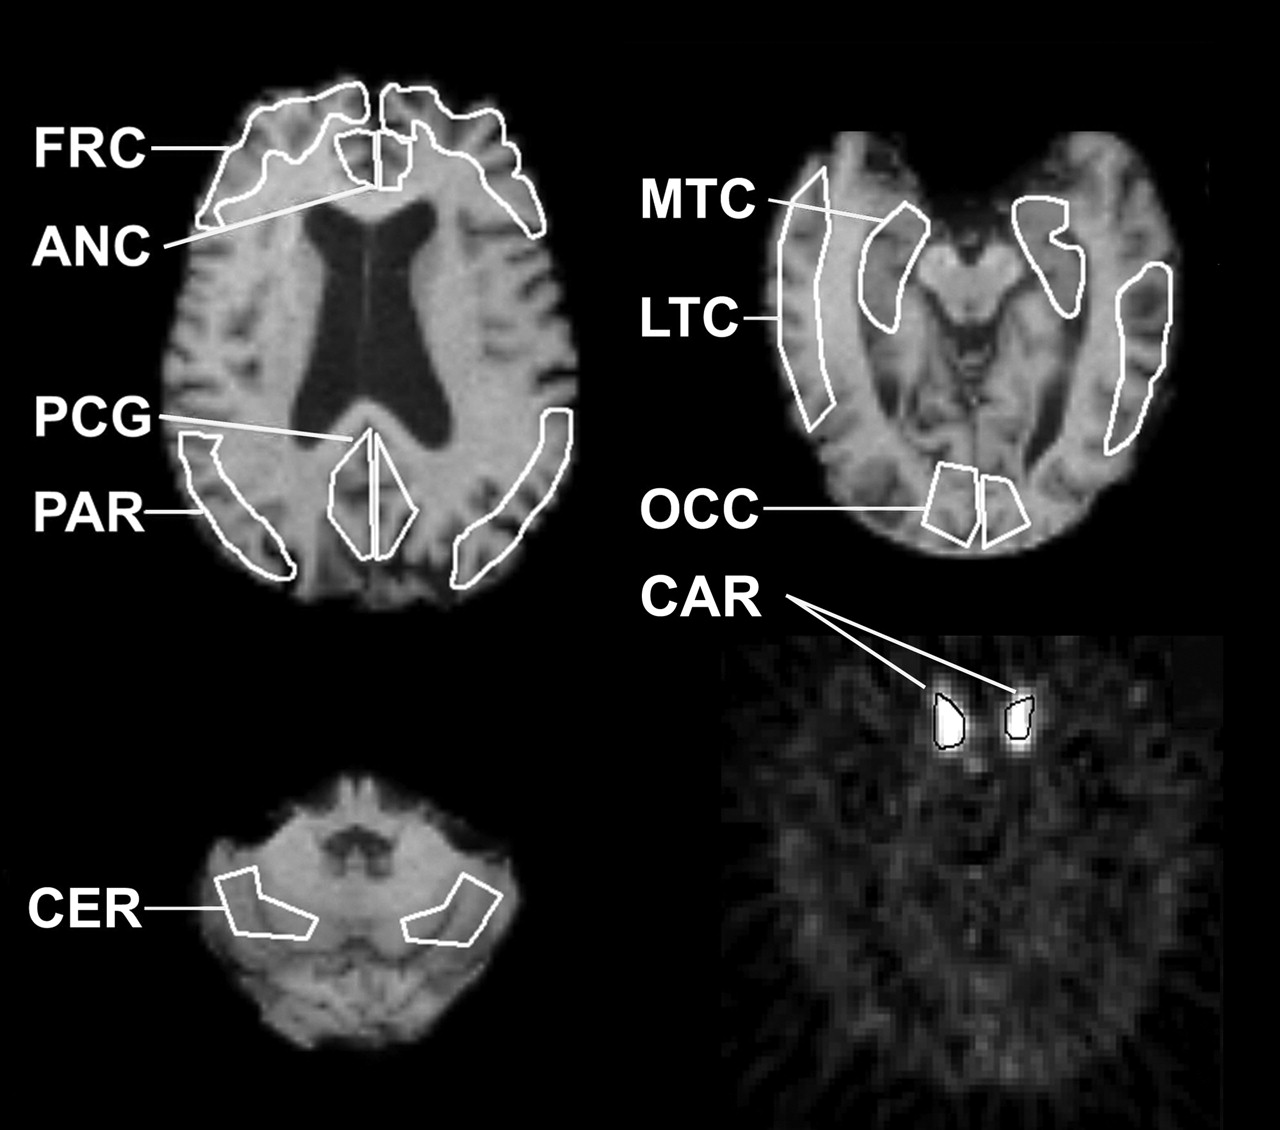
MRI/PET image registration was performed using the automated methods of Minoshima et al. (14) and Woods et al. (15), as previously described (9). Volumes of interest (VOIs) were defined on the coregistered MR image and included sensory motor cortex (SMC), subcortical white matter (SWM), frontal cortex (FRC), anterior cingulate gyrus (ACG), posterior cingulate gyrus/precuneus (PCG), lateral-temporal cortex (LTC), mesial-temporal cortex (MTC), parietal cortex (PAR), pons (PON), caudate (CAU), and cerebellum (CER). The MTC region included the amygdala, hippocampus, entorhinal cortex, and other portions of the parahippocampal gyrus (Fig. 1). VOIs defined on coregistered MR images were used to sample the dynamic PET data to obtain regional time–activity radioactivity concentrations based on a calibrated phantom standard.

Representative VOIs defined on an SPGR MR image of an AD subject (A-3). Shown in white are enhanced examples of cortical ROIs examined in this study: ANC = anterior cingulate; FRT = frontal; LTC = lateral temporal; MTC = mesial temporal; OCC occipital; PAR = parietal; PCG = posterior cingulate. Also shown is CER (cerebellum reference region) and a carotid ROI (CAR) defined bilaterally over internal carotid artery on an early summed PIB PET scan (initial 45 s of acquisition).
Input Function Determination
Plasma-Based Arterial Input Function.
Before PET, a catheter was inserted into the radial artery for arterial blood sampling. Approximately 35 hand-drawn samples (0.5 mL) were collected over 90 min (20 collected during first 2 min). Additional blood samples (3.0 mL) were collected at 5 or 6 time points over 90 min to determine the unmetabolized fraction of PIB in plasma. Details associated with PIB input function determination have been previously described in detail (9).
Image-Based (Carotid) Arterial Input Function.
PET images were summed over the first 45 s after injection when radioactivity concentration in the vasculature is greatest and best visualized. ROIs were traced on the summed images around the left and right internal carotid arteries, across 3 contiguous planes. The resulting VOIs were used to sample the dynamic PET data and to generate carotid time–activity curves. For this study, metabolite correction of the carotid time–activity data was performed in a manner analogous to that described for the analysis of the dopamine D2 receptor radioligand 18F-fallypride (16) by applying a population average (n = 24) of the unchanged fraction of PIB that was determined from arterial sampling.
Data Analysis
Simplified methods of analysis were applied to the time–activity data and compared with Logan graphical analysis (17) with arterial input function data and 90 min of data acquisition (ART90). This method was selected as the benchmark as it was found to provide robust and reproducible measures of PIB retention in a prior comparative analysis of arterial-based methods (9). This previous study also indicated that the CER region was an appropriate reference region for the PIB data analyses, as no group differences in CER DV values were observed. Furthermore, the CER has been shown to contain negligible levels of fibrillar amyloid (18) and similarly low levels of PIB binding in postmortem binding studies of control, severe AD, and non-AD demented subjects (2,6). The regional results were normalized to the results obtained in the reference region to minimize the influence of nonspecific effects.
The simplified methods included analyses over a shorter PET scan duration and use of image-derived estimates of radioactivity concentration in CER tissue and carotid arteries as input to analyses that are appropriate for reversible ligand-binding kinetics (9).
Outcome Measures.
The data were analyzed by summing PET data, graphical analyses, or the simplified reference tissue method (SRTM) to respectively yield outcome measures of the SUV (unitless), DV (mL/mL), (DVR, unitless), and binding potential (BP, unitless). The DV and BP measures can be directly related to the free binding-site pool (Bmax) and the ligand dissociation constant (Kd) (19). The DVR is closely related to the BP and can be computed from DV estimates for a region (DVROI) and reference tissue (DVREF), where DVR = DVROI/DVREF = BP + 1. To facilitate the direct comparison of simplified methods the DVR was selected as a common outcome measure, as it provides a reliable nonnegative measure across AD, MCI, and control subjects. To express all results (with the exception of the SUV ratio [SUVR]) in terms of DVR required the derivation of this parameter by 1 of 3 methods: (a) as the ratio of regional and CER DV values (arterial and carotid input); (b) from the slope of the linear regression of graphical variables that included CER time–activity data as an implicit representation of the input function (Logan graphical analysis, CER input); and (c) by adding 1 to the direct estimation of the BP parameter (SRTM, CER input).
SUV.
The SUVR was determined using the summed regional radioactivity concentration (ROIsum) determined over 40–60 min (SUVR60) or 40–90 min (SUVR90) after injection, injected dose (ID), and participant mass normalized to the CER SUV value: SUV = ROIsum (kBq/g)/[(ID (kBq)/mass (g)] (20). This calculation assumed an average brain tissue density of 1 g/mL. The SUVR measures are equivalent to simple late-scan tissue ratios, as the common factors of ID and body mass cancel.
Logan Graphical Analyses.
To assess specific PIB retention, linear graphical regression analyses were applied. Linear regression of the Logan graphical variables yields slope values that are equivalent to the total radiotracer DV (17). A variation of the Logan graphical analysis allows for the substitution of image-derived reference tissue data in place of the plasma radioactivity input function, yielding slope values equivalent to the radiotracer DVR (21).
The graphical analyses were performed for both the 35- to 60-min (5 points) and 35- to 90-min (8 points) intervals using input functions derived from arterial sampling (ART60, ART90), carotid VOI placement (CAR60, CAR90), and CER tissue radioactivity (CER60, CER90). The performance of the graphical analyses was assessed on the basis of the value of the regression correlation coefficient (r2), which reflects the extent to which the data agreed with the basic method assumptions. The CER90 method was also implemented using a constraint for the tissue efflux constant, k2, that was fixed to an average CER value of k2 determined from 2-tissue compartment, 4-parameter (2T-4k) compartmental analyses (k̄2 = 0.149 min−1; data not shown) (9).
Parametric images were generated by applying the Logan analysis on a voxel-by-voxel basis (35- to 90-min interval) to PET images that were coregistered to the MR data. No CSF correction was applied to the parametric images.
SRTM.
SRTM is an image-based analysis method that uses reference ligand kinetics in a reformulation of the compartmental model equations that does not require an arterial input function (22). Application of SRTM to dynamic PET data results in the estimation of 3 parameters: the BP ([Bmax/Kd]f2), the local rate of radiotracer delivery relative to the reference tissue (RI), and the effective tissue efflux rate constant (k2). A basis function method was used to estimate these parameters from regional and CER time–activity data (23). Boundary values for the nonlinear term θ3 were set by determining the maximum BP value and the minimum and maximum observed rates of tissue clearance (k2) across all regions and subjects from prior compartmental analyses of a subset of the subject group (n = 15; data not shown) (9). Constraining θ3 to the range 0.0007/s < θ3 < 0.004/s was found to be a suitable choice for the analysis of PIB data using the basis-function implementation of SRTM.
Statistical Methods.
Descriptive statistics included the arithmetic mean, coefficient of variation (CV [%] = (SD/mean)·100), and the coefficient of determination (r2). Least-squares linear regression was used to determine the correlation between simplified outcome measures and those obtained using ART90. The strength of the correlation is expressed in terms of r2, and in each case the same number of points (n = 24) were included in the regression. The statistical significance of group differences was tested for each ROI using the Wilcoxon signed rank test (α = 0.05, 1-sided, exact inference), which was used (rather than ANOVA) because of the small sample sizes and violation of the assumption of normality (24). The P values for group differences were corrected for multiple comparisons using a false-discovery-rate (FDR) correction (25). The nonparametric Wilcoxon test minimizes the influence of outliers as it is based on the rank order of the subjects in the comparison groups rather than the magnitude of differences in group mean values. As a result, this method imposes a minimum possible P value for the dataset and yields conservative P values that might be considerably more significant using parametric methods, such as the Student t test. In the present study, the smallest attainable P value was P = 0.001.
The intrasubject variability measures used herein are described in detail by Price et al. (9). Briefly, the test−retest variation was assessed using a percentage difference measure corresponding to the absolute value of the percentage difference between retest (R) and test (T) DVR values: Test/retest (%) = absolute{[(R − T)/T]·100}.
Cohen’s effect size (d), which is a statistical index of the difference between 2 groups, was calculated as the difference between the group mean values normalized to the pooled SD of the 2 groups (26). An effect size of zero indicates complete overlap of the 2 groups, whereas increasingly larger effect sizes indicate differences that are of greater statistical significance. Although the assumption of normality may not be adequately met for these small sample sizes, the effect size measure allowed us to examine the potential capability of a given method to discern differences between AD and control subjects for future larger studies. The effect size computed herein was determined using the pooled SD and corrected for artifacts that can arise in small sample sizes (27). The pooled SD was deemed valid on the basis of similarity of the control and AD relative SDs (P > 0.2).
Evaluation Criteria
The simplified methods were evaluated with respect to the following criteria:
Rank Order.
Rank order of the DVR or SUVR values was examined with respect to region and subject. For each region and subject group, the average outcomes were ranked in descending order (1 = highest, 11 = lowest). The regional rank order was examined for its consistency with the expected deposition of amyloid in AD and for its consistency across methods. The subject rank order was also compared across methods to verify consistency in the ordering and classification of subjects across the methods.
Test–Retest Variability.
The intrasubject variability in the test−retest data was evaluated using the test–retest percentage difference.
Bias and Correlation.
The ART90 DVR was used as the standard benchmark measure of PIB retention for this work. A percentage bias measure was determined for all methods as the difference between the simplified DVR (or SUVR) and the ART90 DVR, normalized to the ART90 value: % bias = [(Method –ART90)/ART90] × 100%. To examine whether the percentage bias was uniform across the dynamic range of a method, the mean percentage bias ± SD was calculated for both low-DVR subjects (ART90 PCG DVR < 1.8; n = 13) and high-DVR subjects (ART90 PCG DVR > 1.8; n = 11). The low-binding subjects were all controls and M-2, -5, -6, -9, and -10. The high-binding subjects were all AD and M-1, -3, -4, -7, and -8. Correlations between the ART90 method and the simplified methods were calculated using linear regression analysis (r2 and slope).
Effect Size.
The impact of intersubject variability on the determination of significant group differences was examined for PCG, FRC, PON, and MTC regions, using the Cohen’s effect size metric (26).
RESULTS
Imaging
Average regional CSF correction factors are shown in Table 2. The regional CSF correction factors that were determined from each individual subject’s SPGR MR data showed no significant differences for any group comparison using the 1-sided nonparametric Wilcoxon rank test after FDR correction.
Average Regional CSF Correction Factors
Input Function Comparisons
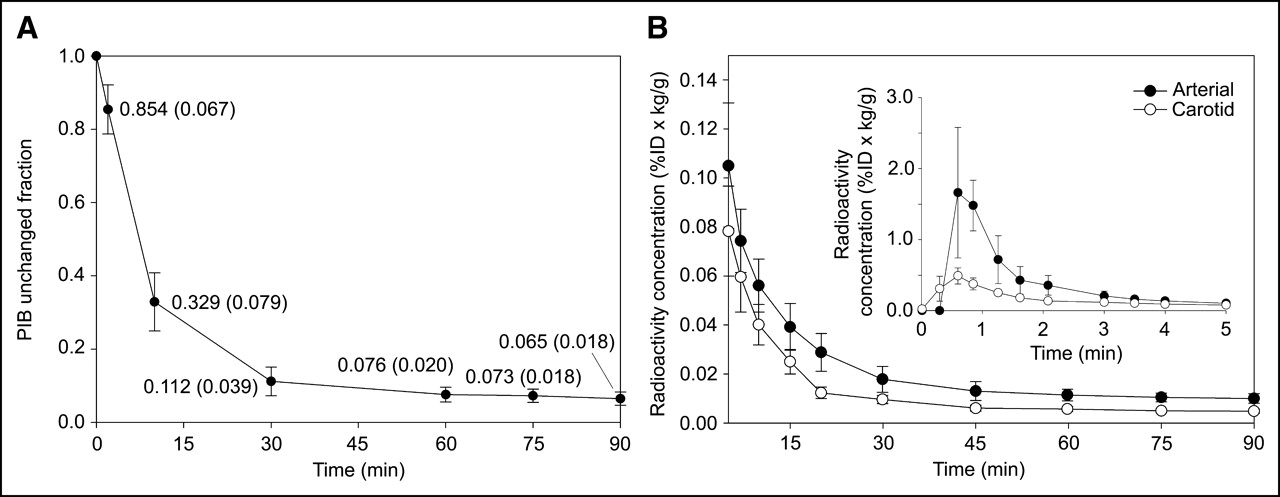
The input functions determined via hand-drawn arterial samples were compared with those derived by carotid VOI placement. Metabolite-corrected input functions determined by arterial sampling and carotid VOI placement were corrected for ID and body mass (%ID × kg/g) to allow population-average input functions (n = 24) to be generated for the purpose of comparison (Fig. 2). The average arterial input function was found to peak at a value of 1.66 ± 0.92 %ID × kg/g, whereas the average carotid input function peaked at a value of 0.49 ± 0.11 %ID × kg/g. The peak value in both cases occurred in the third frame of acquisition (midpoint, 36 s after injection). At early times (<5 min), the carotid input function underestimated the arterial input function by as much as a factor of ∼4 on average. At later times (>5 min), the carotid input function reflected the shape of the arterial input function more closely, converging somewhat with the latter to maintain a constant ratio between the methods of ∼2.

(A) Population average PIB unchanged fraction in plasma determined in 16 subjects with complete metabolite data. (B) Average (n = 24) PIB input functions normalized for ID and body mass (%ID × kg/g) derived from both external arterial sampling and a carotid VOI. Population average PIB unchanged fraction was used to correct the carotid time–activity curve for metabolism, whereas individual data were applied to total plasma radioactivity measurements to perform metabolite correction of arterial input function.
Data Analysis
Comparisons of the mean PIB retention measures focused on differences between the AD and control subject groups because PIB retention for the 10 MCI subjects was found to range across control and AD levels—that is, MCI subjects do not represent a homogeneous group distinct from either controls or AD subjects.
Tissue Data.
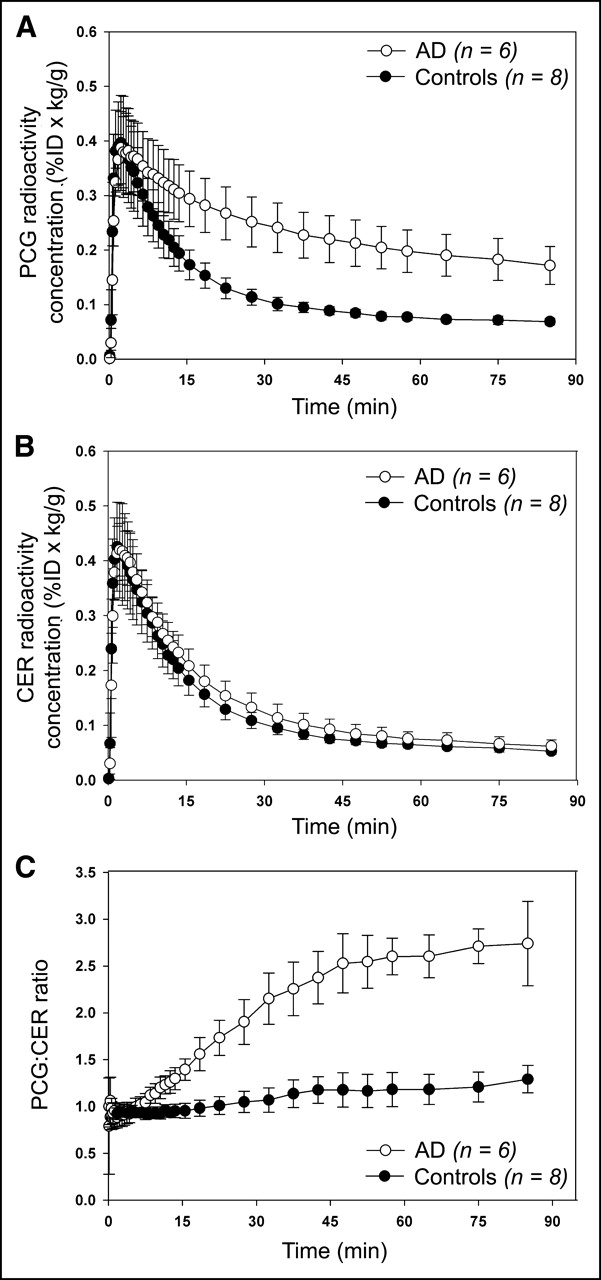
Tissue-to-CER radioactivity concentration ratios were computed for each brain region. In PCG, which showed the highest degree of PIB retention in AD subjects, the VOI-to-CER ratios reached a plateau at a value of approximately 2.5:1 after 45 min. Control subjects maintained ratios of approximately 1:1 for all primary amyloid-binding areas (Fig. 3). On average, the tissue-to-CER ratios began to plateau at about 35 min in controls and 45–50 min in AD subjects.

Average (±1 SD) brain radioactivity concentrations normalized for ID and body mass (%ID × kg/g) after injection of PIB. Shown are PCG (A) and CER (B) regions for AD (n = 6) and control (n = 8) subjects as well as PCG-to-CER radioactivity concentration ratio (C).
Overall Results.
Table 3 lists the mean values measured in AD and control subjects, for each method, across the 11 regions. All methods yielded significantly higher DVR or SUVR values for AD subjects compared with controls in regions known to contain amyloid in AD. The most significant differences (P < 0.001) were generally observed in PCG, ACG, FRC, PAR, LTC, and CAU (Table 3). Lesser differences (0.001 < P < 0.05) were observed for OCC, SMC, and MTC. There were no significant differences in PIB retention between AD and control subjects in regions that are known to be virtually free of amyloid pathology in mild-to-moderate AD subjects, such as SWM and PON (P > 0.20). No method yielded significant group differences in the CER DV or SUV value for AD patients relative to controls (P > 0.25). Figure 4 shows scatter plots of the individual subject DVR and SUVR values, for the PCG and FRC, for the various analysis methods and subject groups.
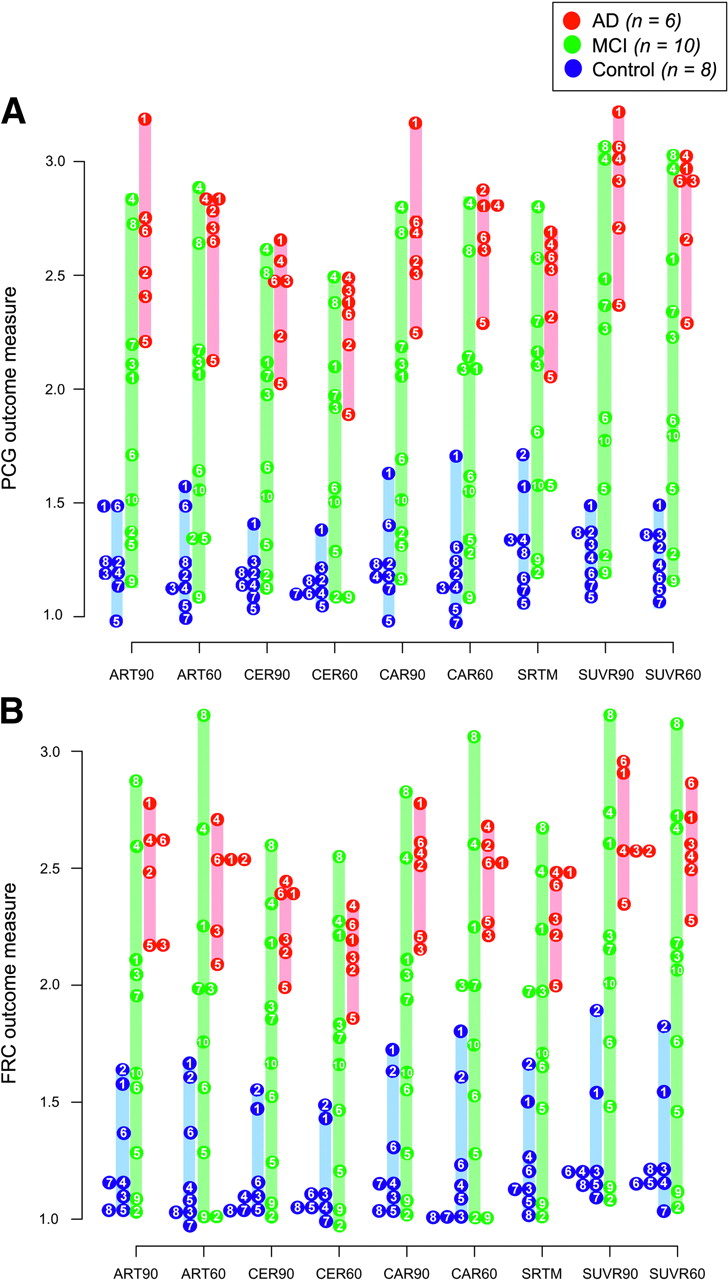
Shown are outcome measures for individual AD (n = 6; red), MCI (n = 10; green), and control (n = 8; blue) subjects across all methods of analysis for PCG (A) and FRC (B). Outcome measure represented for all methods is the DVR, with the exception of SUVR90 and SUVR60 methods, for which tissue-to-CER ratio over 40–60 min or 40–90 min is shown. Numbered circles represent individual subjects (Table 1), whereas colored bars denote range of values within the group. Subjects with overlapping values are placed adjacent to one another.
Outcome Measures
Three of the MCI subjects (M-2, -5, and -9) showed patterns of PIB retention that were indistinguishable from those of the control group, whereas 5 (M-1, -3, -4, -7, and -8) demonstrated patterns of retention that were characteristic of the AD subject group. Two MCI subjects (M-6 and -10) tended to be intermediate between controls and AD subjects in PCG or FRC (Fig. 4).
SUV.
The single (summed) late-scan tissue ratios that were computed over either 40–60 min (SUVR60) or 40–90 min (SUVR90) were found to be in agreement for both the AD and the control subject groups. In controls, regional SUVR60 ratios ranged from 1.11 ± 0.13 (CAU) to 1.80 ± 0.13 (PON), whereas SUVR90 tissue ratios ranged from 1.14 ± 0.13 (CAU) to 1.76 ± 0.14 (PON). In AD subjects, the regional SUVR60 values ranged from 1.38 ± 0.19 (MTC) to 2.80 ± 0.28 (PCG) and the SUVR90 values ranged from 1.40 ± 0.20 (MTC) to 2.88 ± 0.30 (PCG).
Logan Graphical Analyses.
The Logan graphical analysis generally provided estimates of DV (arterial or carotid input) and DVR (CER input) values with high regression correlations (r2) in 10 of 11 regions that generally exceeded 0.99. For the SWM, correlations were generally lower (0.7 < r2 < 0.99) than for other regions, particularly when the dataset was truncated to 60 min.
Parametric images of DVR measures obtained using the ART90 and CER90 analyses show similar patterns and levels of PIB retention (Fig. 5) in a healthy control (C-4), a control with evidence of FRC amyloid deposition (C-2), an MCI subject with no significant amyloid deposition (M-2), an MCI subject with intermediate levels of PIB retention (M-10), an MCI-subject with a characteristic AD pattern of PIB retention (M-4), and a representative AD subject (A-2).
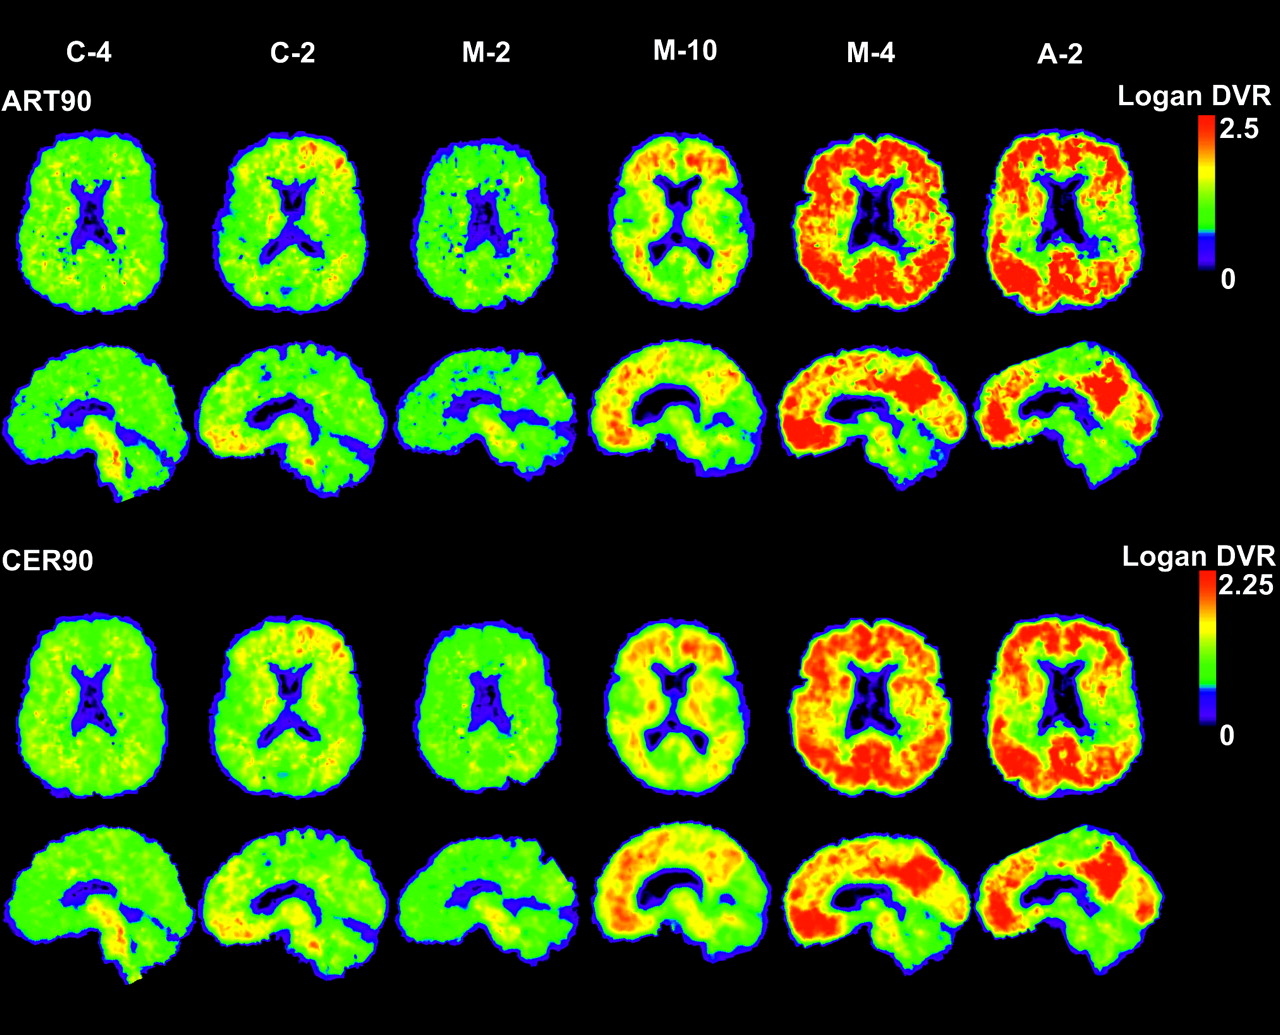
Parametric images of Logan DVR using 90 min of emission data and either arterial data (ART90; top) or CER tissue (CER90; bottom) as input. Shown are a young control (C-4), a control with detectable amyloid deposition in FRC (C-2), an amyloid-negative MCI subject (M-2), an MCI subject with intermediate levels of PIB retention (M-10), an amyloid-positive MCI subject with levels of PIB retention characteristic of AD (M-4), and a typical AD subject (A-2).
SRTM.
The use of SRTM with only 60 min of data occasionally resulted in spuriously overestimated values and deviations in regional rank order (relative to other methods), yielding highly variable outcome measures. For this reason, only SRTM results obtained using 90 min of data (SRTM90) are reported. SRTM90 detected significant differences (P < 0.001) in DVR values between control and AD subjects in several cortical and subcortical regions (Table 3). For the 90-min dataset, average RI values in control subjects ranged from 0.40 ± 0.20 (SWM) to 0.99 ± 0.15 (OCC). RI values in AD subjects were comparable to controls in most regions, ranging from 0.35 ± 0.08 (SWM) to 0.97 ± 0.09 (OCC). In both AD and control subjects, only MTC and SWM showed RI values consistently lower than 0.75. The most notable group difference in average RI values was evident for PAR (controls, 0.86 ± 0.06 versus AD, 0.74 ± 0.08), whereas PCG was more similar (controls, 0.91 ± 0.06 versus AD, 0.85 ± 0.10). These RI values were not corrected for partial-volume effects.
Evaluation Criteria
Rank Order.
The regional rank order of outcome measures averaged for the 6 AD subjects was well conserved across all 9 simplified methods, as each identified PCG as the region with the greatest PIB retention, followed by ACG and other cortical regions, including PAR, FRC, and LTC (Table 4). PIB binding in CAU exceeded that of SMC, OCC, and MTC. White matter–containing regions, such as PON and SWM, were among the lowest in terms of regional rank order in AD subjects. In control subjects, white matter–containing regions such as PON and SWM occupied the highest ranks.
Average Rank Order of Regional Outcome Measures by Method of Analysis
The individual subject rank order was also maintained across methods and regions. In general, CAR90 showed the best agreement with ART90 in terms of individual subject rank order (Figs. 4A and 4B), although all simplified methods completely separated AD and control subjects by their respective outcome measures (DVR or SUVR) and no method resulted in subject misclassification. Also, all simplified methods distinguished the “AD-like” MCI subjects (M-1, -3, -4, -7, and -8) from the “control-like” MCI subjects (M-2, -5, and -9) consistently in both FRC and PCG (Figs. 4A and 4B). However, differences in the subject rank order were observed between ART90 and some simplified methods. For instance, ART90 and CAR90 identified subject A-1 as the AD subject with the greatest degree of PIB retention in PCG, which was far in excess of that observed for all other AD subjects (Fig. 4A). The CER90, SRTM, and SUVR90 methods also showed A-1 as having the highest degree of PIB retention in PCG, although by a smaller margin. Methods that involved the truncation of the dataset to 60 min (ART60, CER60, CAR60, SUVR60) identified other subjects, A-4 or A-2, as the AD subject with the greatest PIB retention rather than A-1.
Among the control subjects, the ART90 DVR values indicate subjects C-1 and C-6 as having elevated levels of PIB retention relative to other controls in PCG, whereas subjects C-1 and C-2 appear to have elevated PIB retention in FRC (Figs. 4A and 4B). All simplified methods examined distinguished C-1 from other controls in both PCG and FRC and C-2 in FRC. However, only ART60 agreed with ART90 with regard to the elevated status of C-6. Interestingly, inspection of the late summed PET images showed only subjects C-1 and C-2, among controls, to have a visually discernible pattern of cortical PIB retention indicating FRC amyloid deposition (Fig. 5).
Test–Retest Variability.
Table 5 summarizes the variability measures and shows that favorable margins of test–retest variability were observed that were generally within ±10% across methods and regions, except for SWM (6.0%–23.8%). For most regions, the CER60 and CER90 methods showed the lowest test−retest variability with averages within ±4.4% and ±4.6%, respectively. Interestingly, the CER-based SRTM90 method showed somewhat greater variation than either CER60 or CER90, averaging ±6.2% across all regions. The SUV-based methods were reproducible as well, averaging ±5.3% and ±5.0% across regions for SUVR60 and SUVR90, respectively. The greatest test–retest variability was observed for the arterial- based methods. Greater variability was observed with a shorter scan duration, as is the case for CAR60 (±12.9%) and ART60 (±9.2%), whereas that for the 90-min measures was less (ART90, ±6.9%; CAR90, ±7.1%).
Test–Retest Variability of Simplified Methods of Analysis
Bias and Correlation.
Bias in the PIB retention measures in relation to the ART90 benchmark method was examined over low-DVR (ART90 PCG DVR < 1.8; n = 13) and high-DVR (ART90 PCG DVR > 1.8; n = 11) groups (Fig. 4A). Box plots of the individual and mean percentage bias measures are shown for PCG in Figure 6A, which were similar to those observed for other cortical regions (data not shown). The lowest and most uniform percentage bias across the low- and high-DVR data was observed for the arterial-based methods. Greater percentage biases were observed for the SUVR and CER results. The CAR90 PCG DVR measures most closely agreed with ART90 PCG DVR measures in low-DVR (% bias = 0.11% ± 3.44%) and high-DVR (% bias = 0.19% ± 1.86%) subjects. Slightly greater percentage bias and variation in this percentage bias was observed for the shorter scan duration methods of ART60 and CAR60. The CER methods showed the greatest negative percentage bias, and greater negative percentage bias was observed for the high-DVR group relative to the low-DVR group. The SUVR methods showed the greatest positive percentage bias, but the percentage bias was fairly similar between low- and high-DVR subjects. For a given method, the largest difference in percentage bias between low-DVR and high-DVR groups was found for SRTM90 (low, 6.03% ± 14.47%; high, −2.65% ± 6.37%).
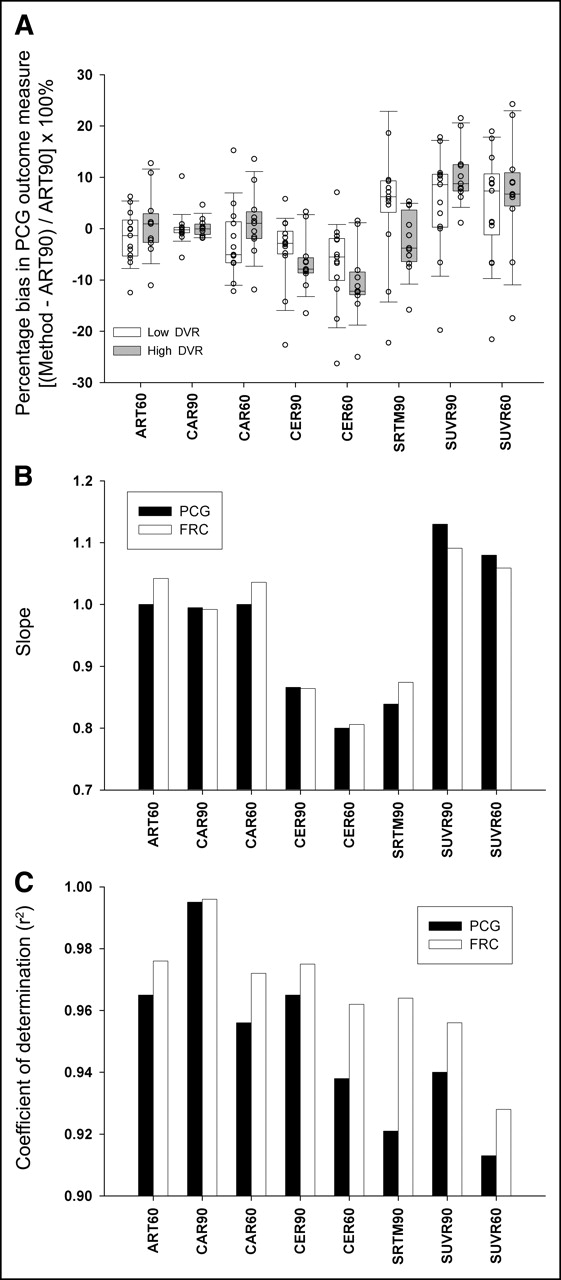
Bias and correlation measures of various simplified methods with ART90. (A) Box plot shows percentage bias in simplified outcome measures relative to ART90 in PCG. Subjects were divided into high-binding (ART90 PCG DVR > 1.8) and low-binding (ART90 PCG DVR < 1.8) groups to determine whether methodologic bias was consistent across the spectrum of PIB retention for all simplified analysis methods. Boxes denote the interquartile range (50% of subjects) and median value (solid line), whereas box whiskers indicate 10th and 90th percentile. ○, Individual subject values. (B) Slopes of linear correlations between ART90 and simplified methods. (C) Coefficient of determination (r2) for correlations between ART90 and simplified methods.
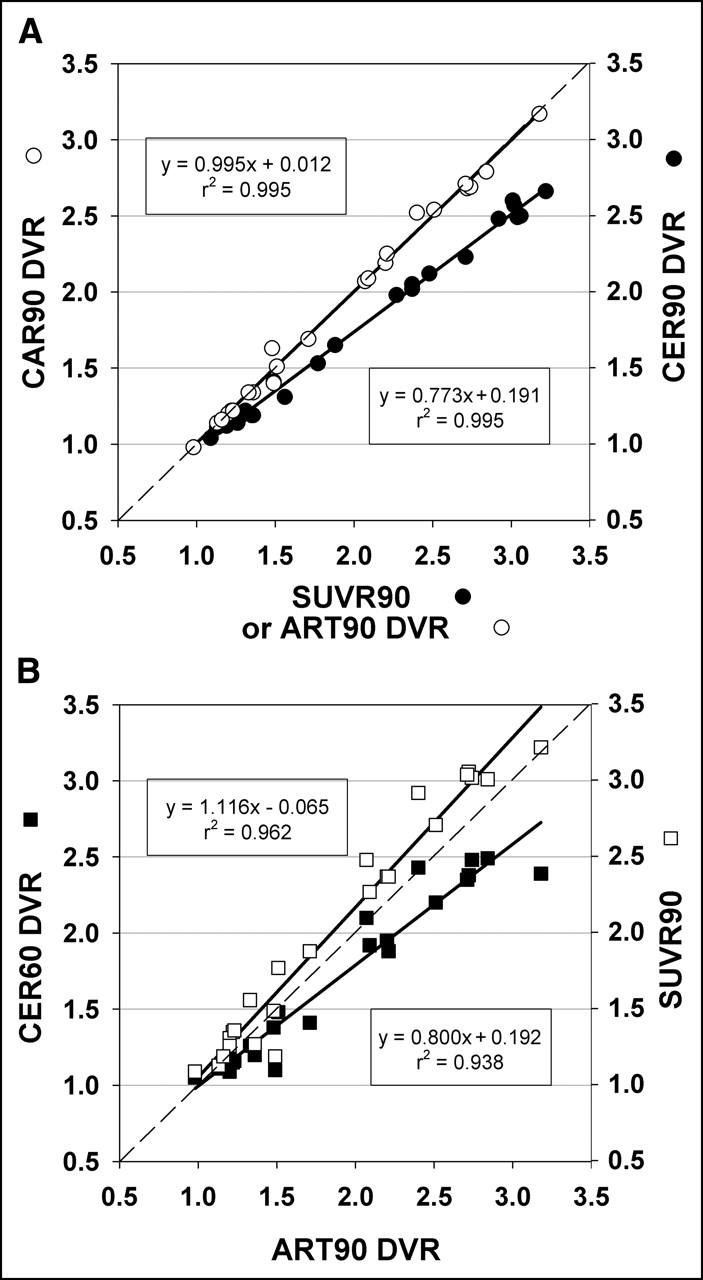
Across all subjects (n = 24), the PCG and FRC DVR values determined using each simplified method were highly correlated (r2 = 0.913–0.995) with the ART90 DVR values (Fig. 6C). Regression slopes ranged from 0.80 to 1.13 (Fig. 6B). The regression slopes tracked closely with percentage bias with the exception of the SRTM90 method (Figs. 6A and 6B). CAR90 produced near perfect correlations with ART90 (r2 = 0.995; slope = 0.995; Fig. 7A). Of the methods examined, the SUVR60 results correlated most poorly with ART90 (r2 = 0.913; slope = 1.083; Figs. 6B and 6C), the CER60 method had the lowest slope (r2 = 0.938; slope = 0.800; Fig. 7B), and the SUVR90 method had the highest slope (r2 = 0.962; slope = 1.116; Fig. 7B). In an effort to determine if shared “noise” could explain the good correlation between arterial methods and poorer correlation with other methods, 2 nonarterial methods were compared: CER90 and SUVR90. A correlation as strong as that between the arterial methods (r2 = 0.995; Fig. 7A) was found, although the slope of this correlation was relatively low (slope = 0.773), suggesting a large bias between these methods.

(A) Graph shows correlation of ART90 and CAR90 (○, solid line) and SUVR90 and CER90 (•, solid line) outcome measures. (B) Graph shows correlation between ART90 and CER60 (▪, solid line) and ART90 and CER60 (□, solid line) outcome measures. The equation describing the linear regression is shown for each comparison in the form y = mx + b as well as the coefficient of determination (r2). The thin dashed line in both graphs represents the line of unity.
Effect Size.
The effect size measure reflects the level of variation of a given measure across subjects (intersubject variability) and separation of the group mean PIB retention values. It was often noted that arterial-based methods tended to be more variable than CER-based methods and the 60-min data tended to be more variable than the 90-min data. For the controls, CER60 was generally associated with the least variation in DVR across subjects that was <10% for all regions except ACG (14%) and FRC (16%). ART60, CAR60, and SRTM90 yielded CV (%) values that were greater than 10% for 9 of 11 regions (excluding CER) (Table 3). For the AD group, greater DVR CVs were most often observed for ART90 and ART60, ranging from about 10% to 20% in primary areas of interest.
All methods consistently separated control and AD groups and resulted in large Cohen’s effect sizes for regions with high PIB retention. The greatest Cohen’s effect sizes (d) were observed in the PCG and ranged from about 6.9 (SUV methods) to 4.6 (SRTM90). The magnitude of the effect sizes reflects that clear separation of mean PIB retention values is achieved between control and AD subjects. Table 6 lists the range of effect sizes in PCG, FRC, MTC, and PON. The PON region is not expected to differ between AD and control subjects and, thus, has an effect size that varies about zero.
Effect Size Measurement for Selected Regions*
DISCUSSION
This work compares simplified methods and analyses for novel in vivo assessments of brain amyloid deposition using PIB PET. Four levels of simplification were examined: (a) shortening the scan period from 90 to 60 min; (b) substituting an arterial input function derived from a VOI defined over the carotid artery for an arterial plasma−based input function (CAR60/90); (c) replacing arterial input analyses completely with an image-driven analysis method, such as the noninvasive Logan analysis (CER60/90) and SRTM90; and (d) use of a late single-scan measure of the radioactivity distribution (SUVR60/90). Within each level of simplification, performance was compared with the benchmark quantitative method, ART90. It is acknowledged that the ART90 method is a “relative” benchmark, as there are currently no postmortem measures of the true amyloid deposition in these subjects against which different measures of PIB retention can be independently compared.
Shortened Scan Interval
In general, analysis methods that used 90 min of emission data performed better than when 60 min was used, although 60 min of emission data yielded useful data, as judged by the evaluation criteria. The most notable exception was the application of SRTM using 60 min of data, which resulted in spurious values, high intersubject variability, and aberrations of regional rank order. A shorter scan duration was associated with substantially higher test–retest variability in the case of ART60 and CAR60 (Table 5), although for ART60 this measure was still within the ±10% margin generally considered acceptable for most PET radiotracers (28,29). This may be of greatest concern for longitudinal studies that require reliable repeated measures of PIB retention. Truncation to 60 min did not result in a significant change in the level of methodologic bias for CAR60 or SUVR60, but CER60 showed a larger negative percentage bias compared with CER90 (Fig. 6A). Intersubject variability was only substantially higher in the ART60 and CAR60 datasets in SWM, which is likely a result of the failure to reach tissue-to-plasma equilibrium in this brain region. In general, effect size (with respect to the separation of AD and control subjects) was not adversely affected by truncation of the dataset to 60 min (Table 6).
Carotid VOI-Derived Arterial Input Function
Important limitations of the carotid VOI methods include the inability to assess the unchanged fraction of PIB in plasma and the inherent underestimation of the arterial input function as a result of partial-volume averaging effects. The latter resulted in a systematic overestimation of regional and CER DV values by approximately a factor of 2 (e.g., CAR90 CER DV in Table 3). Other studies have applied corrections to address the underestimation of peak plasma radioactivity in a carotid VOI that results from partial- volume averaging and coarse temporal sampling (30,31). No corrections were made to recover the peak radioactivity concentration in the present study. Nevertheless, the carotid VOI methods provided regional DVR estimates that most closely reflected ART90 DVR values and were the least biased relative to ART90 for both low- and high-DVR subjects (Figs. 6A and 7A). This suggests that the use of a population average metabolite correction may be an appropriate substitute for individual data and that CER normalization effectively reduces the impact of the carotid VOI bias on the regional DVR measures. Studies are underway to assess whether radiometabolite correction factors determined from venous blood can effectively replace arterial-based correction factors on an individual basis.
The CAR90 results were very comparable to ART90 in terms of test−retest variability (∼7%; Table 5) and effect size (∼5; Table 6). Despite the fact that the ART90 and CAR90 effect sizes were among the smallest of the 9 methods studied in this work (mostly due to higher SDs of the group means), these methods yielded very robust group differences that effectively distinguished AD and control subject groups. To put this in perspective, the use of a parametric test of significance (2-tailed t test) showed that even the lowest PCG effect size of 4.6 corresponded to a highly significant difference between the AD and control group means with a P value of <0.0000001. It is important to note that these 2 methods (ART90 and CAR90) may share inaccuracies generated by the use of arterial-based metabolite corrections, although the influence of individual inaccuracies should be minimized by the use of the population average metabolite correction in the CAR90 method. It is acknowledged that full realization of this simplification in future studies will require further validation of the population approach, as the present sample size lacks sufficient statistical power to evaluate potential group differences in the metabolism of PIB.
Reference Tissue-Based Input Function
The CER60 and CER90 methods resulted in DVR estimates that were negatively biased with respect to ART90 DVR measures (Fig. 6), particularly in high-DVR subjects. This bias appeared to be unrelated to the tissue efflux constant k2, as it remained whether or not a constraint was imposed based on the population average k2 value. As suggested by Logan et al. (21), the k̄2 constraint in the noninvasive Logan analysis may be omitted without resulting in a significant bias in the DVR measure when the ratio of the target to the reference tissue radioactivity concentration (C(t)/Cr(t)) remains constant for a protracted period. For PIB, this condition appears to be satisfied, as evidenced by stable tissue-to-CER ratios after 45 min in high-DVR regions (Fig. 3). The negative bias observed in high-DVR subjects using CER input methods likely reflects relative differences in CER and plasma clearance rates (32). This effect appears to be less important in subjects with lower levels of amyloid deposition. Previous fully quantitative PIB studies showed that the CER data were inadequately described by a 1-tissue (2 parameter) compartment model and required 2 tissue compartments. Although this fact raises concern regarding the application of SRTM for the analysis of PIB data, SRTM90 DVR values were slightly less biased in high-binding subjects compared with CER90 and considerably less biased relative to CER60.
The noninvasive Logan methods (CER60 and CER90) showed the lowest test–retest variability of any method examined (∼5%) across all regions. SRTM90 showed slightly higher test–retest variability (∼6% across regions), though this level of variability would be considered to represent a satisfactory level of performance for a PET agent. Intersubject variability in the control group was substantially higher for SRTM90 than for either CER60 or CER90, although in the AD group the methods were more comparable. This fact largely explains the larger effect sizes observed for CER60 and CER90 compared with that for SRTM90.
Late Single Scan Measure
Because of its simplicity, the SUV measure is frequently used in clinical studies where it can be impractical to use quantitative analysis methods that require dynamic imaging or input function determination. To eliminate a major source of variability in the determination of SUV, the time interval for the evaluation of the SUV parameter must be chosen such that the change in the SUV value over the interval is relatively small in comparison to the SUV value itself (33).
In the case of in vivo PET studies, the SUVR reflects the relative contributions of specific and nonspecific binding to the measured signal and, therefore, is more comparable to the DVR value. For the PIB data, the ratio of tissue (amyloid containing) to CER radioactivity was relatively constant beyond 40 min after injection in both AD and control subjects (Fig. 3) and, therefore, consistent with the determination of the SUV ratios after this time. The ratio also eliminates other sources of variability, such as body composition and inaccuracies in determining the ID (e.g., partial extravasation), which may adversely impact the calculation of SUV (20). Both SUVR60 and SUVR90 showed strong positive biases in PCG relative to ART90 that were similar in the low- and high-DVR subjects (Fig. 6A). Test–retest variability for the SUVR methods was among the lowest of the methods examined, likely a result of the cancellation of mutual sources of variability in the ratio (32). The SUV- based methods showed the greatest dynamic range and mean difference between control and AD subjects of all methods examined, which, coupled with reasonably low intersubject variability, produced the largest effect sizes of any method as well (Table 6).
Reference Region Considerations
It must be acknowledged that all of the reported methods share a common potential shortcoming in their reliance on CER measures of PIB retention, whether it be in the implicit representation of the input function (CER90, CER60, SRTM90) or in the computation of the DVR outcome measure. As advanced AD subjects were not included in this investigation, the degree to which CER fibrillar amyloid deposits in these advanced subjects will contribute to the DVR or SUVR outcome measure is not known. Of the methods that do not require arterial sampling, the carotid-based methods are advantageous in that it is possible to assess CER PIB retention on an individual basis. In the event that CER amyloid emerges as a concern in more advanced AD subjects, it may be necessary to consider alternative methods of assessing PIB retention across the AD disease spectrum. Such alternatives may include statistical methods that account for differences in nonspecific binding through covariate adjustment and consideration of other potential sources for the reference kinetics. In addition, the assessment of CER PIB retention requires careful consideration of subject placement in the PET scanner given the nonuniform axial sensitivity of PET tomographs operating in 3D mode. A further consideration is the placement of the CER VOI, as any artifacts generated by erroneous CER VOI placement (e.g., contamination of PIB CER measure by adjacent white matter signal) could contribute bias to regional DVR and SUVR outcome measures.
Evaluation of Putative Emerging Cases
Several individual cases afford a special opportunity to cross-check the consistency of methods with respect to subjects whose PIB retention measures suggest subtle amyloid deposition. Figure 4 indicates that patients C-1, C-2, M-6, and M-10 invariably fall at or above the upper limits of the control range in the PCG or the FRC. C-6 often falls near this upper end as well and will be discussed separately below. Visual inspection of the parametric and late-summed images in these cases reveals mild, often focal, but convincing patterns of cortical PIB retention that are consistent with those seen in AD subjects. C-2 and M-10 show predominantly frontal retention, although M-10 has more widespread retention. The retention in C-2 is mostly seen in the left FRC. C-1 and M-6 show a mild, generalized pattern that is most apparent in the PCG, with the retention in M-6 being more apparent than that in C-1. No method stands out as being obviously superior in segregating these cases from the remaining controls, although the SUVR methods may perform somewhat better in this regard. C-6 is unusual because the elevation above the other controls is observed only with the arterial-based methods (ART60/90 more so than CAR60/90) and not with the CER- or SUV-based methods, suggesting that this difference was related to the arterial input function of C-6. This case demonstrates that discrepancies in subject rank between arterial and CER methods can arise that might be explained by either an erroneous estimate of the arterial input function or true physiologic variability to which the CER-based methods are less sensitive. Review of the C-6 input function showed unusually rapid plasma clearance of PIB that did not appear to be attributable to a technical error.
Selecting a Method of Choice
Each method has certain advantages and disadvantages for specific purposes. Selection of a method of choice will depend on the nature of the particular application. All methods proved very capable of distinguishing AD and control subjects, but the SUVR90 method showed a small advantage in effect size. When a short scan time is most desirable (e.g., severe AD patients), the SUVR methods are advantageous because PIB retention measures can be obtained with the subject in the scanner for a period as short as 20 min (SUVR60). Other advantages of the SUVR method include simplicity of application (making it more applicable to routine clinical studies), superior PCG effect size (6.9), very good test–retest reproducibility (5.0%), and a large dynamic range. In studies that correlate amyloid load with other variables (e.g., neuropsychologic measures), the method with the most uniform bias across the full range of amyloid deposition (i.e., CAR90) is likely to perform best—although at the expense of higher test−retest variability. Test–retest reliability is most important when longitudinal examinations of PIB retention are made in the same subject to study the natural history of disease progression or the response to antiamyloid therapies. Although the CER methods (CER60/90) have the best test–retest reliability, one must again consider whether this advantage is offset by the inherent bias in these methods. If the bias that accompanies the use of CER as input is unacceptable, it may be necessary to use the CAR90 method. However, the superior test−retest variability of CER90 makes it an attractive method for detecting small treatment effects, particularly in cases with low levels of amyloid deposition that must ultimately be the principal target of these therapies.
CONCLUSION
When it is not possible or desirable to obtain arterial-based input data, several simplified methods can be shown to be valid alternatives to quantitative arterial-based analyses of PIB data. The SUVR90 method may be the method of choice when simplicity of calculations and in-scanner time are the overriding concerns. The CAR90 method may be the method of choice when comparisons involve a large range of PIB retention values. The CER90 method may be the method of choice for natural history studies and treatment trials, particularly when the detection of small interval changes is paramount. In practice, if PIB data are acquired over the full 90-min interval, the decision regarding method of choice does not necessarily have to be made beforehand.
Acknowledgments
This work was supported by grants from the National Institutes of Health (R01AG018402, P50AG005133, K02AG001039, R01AG020226, R01MH070729, K01MH001976), the Alzheimer’s Association (TLL-01-3381), the U.S. Department of Energy (DE-FD02-03 ER63590), and GE Healthcare, Inc. We thank our University of Pittsburgh colleagues at the ADRC and PET facility for their efforts in conducting and analyzing these studies and Dr. Lisa Weissfeld for her statistical comments. We also thank the volunteers and their families for their commitment to further discovery into the causes and treatment of Alzheimer’s disease evidenced by their efforts in this and other related studies. Disclaimer: GE Healthcare (formerly Amersham Health, Chalfont St. Giles, U.K.) entered into a license agreement with the University of Pittsburgh based on the technology described in this article. Drs. Klunk and Mathis are coinventors of PIB and, as such, have a financial interest in this license agreement.
Footnotes
Received Jun. 13, 2005; revision accepted Aug. 23, 2005.
For correspondence or reprints contact: Brian J. Lopresti, BS, Department of Radiology, PET Facility, 200 Lothrop St., Room B938, Pittsburgh, PA 15213.
E-mail: loprestibj{at}upmc.edu
REFERENCES
In this issue


Jump to section
Related Articles
Cited By...
- Quantitative Brain Amyloid PET
- Longitudinal Association of Mid-Life Ten Year Cardiovascular Disease Risk Score with Brain Biomarkers of Alzheimers Disease, Neurodegeneration and White Matter Hyper Intensities in Cognitively Unimpaired Older Adults: Heart SCORE Brain Study
- The RSNA QIBA Profile for Amyloid PET as an Imaging Biomarker for Cerebral Amyloid Quantification
- CSF sphingomyelins in Alzheimers disease, neurodegeneration, and neuroinflammation
- MRI-Visible Perivascular Spaces in the Centrum Semiovale Are Associated with Brain Amyloid Deposition in Patients with Alzheimer Disease-Related Cognitive Impairment
- Predicting resistance to amyloid-beta deposition and cognitive resilience in the oldest-old
- Proper names from story recall are associated with beta-amyloid in cognitively unimpaired adults at risk for Alzheimers disease
- Total A{beta}42/A{beta}40 ratio in plasma predicts amyloid-PET status, independent of clinical AD diagnosis
- Magia: Robust automated image processing and kinetic modeling toolbox for PET neuroinformatics
- Plasma and CSF neurofilament light: Relation to longitudinal neuroimaging and cognitive measures
- Generation of Structural MR Images from Amyloid PET: Application to MR-Less Quantification
- Midlife insulin resistance, APOE genotype, and late-life brain amyloid accumulation
- Optimal Reference Region to Measure Longitudinal Amyloid-{beta} Change with 18F-Florbetaben PET
- Standardized Expression of 18F-NAV4694 and 11C-PiB {beta}-Amyloid PET Results with the Centiloid Scale
- In Vivo Tau, Amyloid, and Gray Matter Profiles in the Aging Brain
- Visualization and Quantification of 3-Dimensional Stereotactic Surface Projections for 18F-Flutemetamol PET Using Variable Depth
- Visual Versus Fully Automated Analyses of 18F-FDG and Amyloid PET for Prediction of Dementia Due to Alzheimer Disease in Mild Cognitive Impairment
- Performance of 11C-Pittsburgh Compound B PET Binding Potential Images in the Detection of Amyloid Deposits on Equivocal Static Images
- A Semiautomated Method for Quantification of F 18 Florbetapir PET Images
- Relative 11C-PiB Delivery as a Proxy of Relative CBF: Quantitative Evaluation Using Single-Session 15O-Water and 11C-PiB PET
- Establishing Amyloid PET Imaging Biomarkers: Ongoing Efforts
- Voxelwise Relationships Between Distribution Volume Ratio and Cerebral Blood Flow: Implications for Analysis of {beta}-Amyloid Images
- Measurement of Longitudinal {beta}-Amyloid Change with 18F-Florbetapir PET and Standardized Uptake Value Ratios
- Automated Quantification of 18F-Flutemetamol PET Activity for Categorizing Scans as Negative or Positive for Brain Amyloid: Concordance with Visual Image Reads
- Amyloid Burden, Neuroinflammation, and Links to Cognitive Decline After Ischemic Stroke
- Cerebral perfusion alterations and cerebral amyloid in autosomal dominant Alzheimer disease
- Apathy correlates with prefrontal amyloid {beta} deposition in Alzheimer's disease
- Longitudinal Amyloid Imaging Using 11C-PiB: Methodologic Considerations
- Implementation and Validation of an Adaptive Template Registration Method for 18F-Flutemetamol Imaging Data
- Brain {beta}-amyloid load approaches a plateau
- Amyloid is linked to cognitive decline in patients with Parkinson disease without dementia
- Cognitive Profile of Amyloid Burden and White Matter Hyperintensities in Cognitively Normal Older Adults
- Indicators of amyloid burden in a population-based study of cognitively normal elderly
- Short-term clinical outcomes for stages of NIA-AA preclinical Alzheimer disease
- Subacute Ischemic Stroke Is Associated With Focal 11C PiB Positron Emission Tomography Retention But Not With Global Neocortical A{beta} Deposition
- Relative Equilibrium Plot Improves Graphical Analysis and Allows Bias Correction of Standardized Uptake Value Ratio in Quantitative 11C-PiB PET Studies
- Clinical Validation of 18F-AZD4694, an Amyloid-{beta}-Specific PET Radioligand
- Performance Characteristics of Amyloid PET with Florbetapir F 18 in Patients with Alzheimer's Disease and Cognitively Normal Subjects
- Distinct clinical and metabolic deficits in PCA and AD are not related to amyloid distribution
- Dual-Biomarker Imaging of Regional Cerebral Amyloid Load and Neuronal Activity in Dementia with PET and 11C-Labeled Pittsburgh Compound B
- Early 11C-PIB Frames and 18F-FDG PET Measures Are Comparable: A Study Validated in a Cohort of AD and FTLD Patients
- In Vivo Imaging of Amyloid Deposition in Alzheimer Disease Using the Radioligand 18F-AV-45 (Flobetapir F 18)
- Specific estrogen sulfotransferase (SULT1E1) substrates and molecular imaging probe candidates
- Increased fibrillar amyloid-{beta} burden in normal individuals with a family history of late-onset Alzheimer's
- 11C-PIB binding is increased in patients with cerebral amyloid angiopathy-related hemorrhage
- {beta}-Amyloid burden in the temporal neocortex is related to hippocampal atrophy in elderly subjects without dementia
- Basal Cerebral Metabolism May Modulate the Cognitive Effects of A{beta} in Mild Cognitive Impairment: An Example of Brain Reserve
- Relationships between biomarkers in aging and dementia
- Follow-up of [11C]PIB uptake and brain volume in patients with Alzheimer disease and controls
- Disruption of Functional Connectivity in Clinically Normal Older Adults Harboring Amyloid Burden
- Characterizing the Appearance and Growth of Amyloid Plaques in APP/PS1 Mice
- Phase 1 Study of the Pittsburgh Compound B Derivative 18F-Flutemetamol in Healthy Volunteers and Patients with Probable Alzheimer Disease
- Comparison of 18F-FDG and PiB PET in Cognitive Impairment
- In vivo mapping of amyloid toxicity in Alzheimer disease
- Fibrillar amyloid-{beta} burden in cognitively normal people at 3 levels of genetic risk for Alzheimer's disease
- Consideration of Optimal Time Window for Pittsburgh Compound B PET Summed Uptake Measurements
- Cortical Hubs Revealed by Intrinsic Functional Connectivity: Mapping, Assessment of Stability, and Relation to Alzheimer's Disease
- Detection of Alzheimer Pathology In Vivo Using Both 11C-PIB and 18F-FDDNP PET
- Microglial activation and amyloid deposition in mild cognitive impairment: A PET study
- Amyloid load in Parkinson's disease dementia and Lewy body dementia measured with [11C]PIB positron emission tomography
- Imaging amyloid deposition in Lewy body diseases
- Voxel-Based Analysis of 11C-PIB Scans for Diagnosing Alzheimer's Disease
- Dynamics of the Microglial/Amyloid Interaction Indicate a Role in Plaque Maintenance
- Amyloid Deposition Begins in the Striatum of Presenilin-1 Mutation Carriers from Two Unrelated Pedigrees
- Imaging {beta}-amyloid burden in aging and dementia
- 11C-PIB PET imaging in Alzheimer disease and frontotemporal lobar degeneration
- Visual Assessment Versus Quantitative Assessment of 11C-PIB PET and 18F-FDG PET for Detection of Alzheimer's Disease
- 2-(2-[2-Dimethylaminothiazol-5-yl]Ethenyl)-6- (2-[Fluoro]Ethoxy)Benzoxazole: A Novel PET Agent for In Vivo Detection of Dense Amyloid Plaques in Alzheimer's Disease Patients
- Amyloid, hypometabolism, and cognition in Alzheimer disease: An [11C]PIB and [18F]FDG PET study
- Voxel-based analysis of PET amyloid ligand [11C]PIB uptake in Alzheimer disease
- [11C]PIB in a nondemented population: Potential antecedent marker of Alzheimer disease