


Abstract
11C-Pittsburgh compound B (PiB) marks Aβ amyloidosis, a key pathogenetic process in Alzheimer disease (AD). The use of 11C-PiB is limited to centers with a cyclotron. Development of the 18F-labeled thioflavin derivative of PiB, 18F-flutemetamol, could hugely increase the availability of this new technology. The aims of this phase 1 study were to perform brain kinetic modeling of 18F-flutemetamol, optimize the image acquisition procedure, and compare methods of analysis (step 1) and to compare 18F-flutemetamol brain retention in AD patients versus healthy controls in a proof-of-concept study (steps 1 and 2). Methods: In step 1, 3 AD patients (Mini-Mental State Examination, 22–24) and 3 elderly healthy controls were scanned dynamically during windows of 0–90, 150–180, and 220–250 min after injection of approximately 180 MBq of 18F-flutemetamol, with arterial sampling. We compared different analysis methods (compartmental modeling, Logan graphical analysis, and standardized uptake value ratios) and determined the optimal acquisition window for step 2. In step 2, 5 AD patients (Mini-Mental State Examination, 20–26) and 5 elderly healthy controls were scanned from 80 to 170 min after injection. To determine overall efficacy, steps 1 and 2 were pooled and standardized uptake value ratios were calculated using cerebellar cortex as a reference region. Results: No adverse events were reported. There was a strong correlation between uptake values obtained with the different analysis methods. From 80 min after injection onward, the ratio of neocortical to cerebellar uptake was maximal and only marginally affected by scan start time or duration. AD patients showed significantly increased standardized uptake value ratios in neocortical association zones and striatum, compared with healthy controls, whereas uptake in white matter, cerebellum, and pons did not differ between groups. Two AD patients were 18F-flutemetamol–negative and 1 healthy control was 18F-flutemetamol–positive. Conclusion: 18F-flutemetamol uptake can be readily quantified. This phase 1 study warrants further studies to validate this 18F-labeled derivative of PiB as a biomarker for Aβ amyloidosis.
Alzheimer disease (AD) is neuropathologically characterized by synapse loss, neuritic Aβ amyloid plaques, and neurofibrillary tangles. Making an accurate and reliable diagnosis of AD at the earliest disease stages is challenging and becomes increasingly important as disease-modifying therapies, such as those aimed at lowering Aβ amyloid, appear on the horizon.
In 2004, Klunk et al. presented a novel method for the in vivo detection of Aβ amyloid plaques in the brain using the thioflavin-T analog PET tracer 11C-Pittsburgh compound B (PiB) (1). In vitro binding of this ligand to brain homogenates correlates tightly with total insoluble Aβ and Aβ1–42 levels (2,3). In vivo 11C-PiB uptake in AD or Lewy body disease correlates with the topography and intensity of Aβ amyloid aggregates measured neuropathologically in the same brains (4–7). 11C-PiB PET marks not only parenchymal Aβ but also Aβ deposits in vessel walls (4,8–11). At the low or subnanomolar administered concentrations of PET ligands in vivo, PiB does not bind to neurofibrillary tangles (2,10) or α-synuclein fibrils (12).
Having a good 18F Aβ tracer would increase the availability of this new technology by more than 10-fold (13). 18F-flutemetamol (previously known as 18F-GE067) (14) is a PiB derivative radiolabeled with 18F. Extensive validation of the PiB parent molecule is an important advantage on the way toward validation of 18F-flutemetamol (13). Other 18F-labeled amyloid imaging agents for clinical use in humans include the naphthol 2-(1-{6-[(2-[18F]fluoroethyl)(methyl)amino]-2-naphthyl}ethylidene)malononitrile (18F-FDDNP), which labels both Aβ amyloid plaques and neurofibrillary tangles (15,16), and, more recently, the stilbenes 18F-BAY94-9172 (18F-AV1) and 18F-AV45 (17).
The biodistribution and internal radiation dosimetry of an intravenous injection of 18F-flutemetamol have been reported before (14). The primary aims of the current phase 1 study were to perform brain kinetic modeling of 18F-flutemetamol, select the optimal image acquisition window, and compare different methods of analysis (step 1) and to contrast 18F-flutemetamol brain retention in AD patients versus healthy controls in a proof-of-concept study (steps 1 and 2).
MATERIALS AND METHODS
Subjects
Eight patients with early-stage clinically probable AD were recruited via the academic memory clinic of the University Hospitals Leuven. Three participated in step 1, and 5 in step 2. Subjects had to fulfill the criteria of the National Institute of Neurological and Communicative Disorders and Stroke and of the Alzheimer's Disease and Related Disorders Association for clinically probable AD (18) and the DSM-IV criteria for dementia of Alzheimer type (19). Mini-Mental State Examination scores had to lie between 18 and 26 of 30, and the Clinical Dementia Rating (20) between 0.5 and 2, with a score lower than 4 on the Modified Hachinski Ischemic scale. Patient demographics and neuropsychologic test results are listed in Table 1. All patients were receiving stable treatment with a cholinesterase inhibitor, 5 were taking a selective serotonin-reuptake inhibitor, and 1 was receiving quetiapine, 100 mg once a day.
Demographics and Neuropsychologic Results
Eight healthy controls, 5 men and 3 women, were recruited through an advertisement in a local newspaper asking for volunteers to participate in a scientific study with brain imaging. Three participated in step 1, and 5 in step 2. The subjects had to be older than 50 y, with a Mini-Mental State Examination score above 27 and a Clinical Dementia Rating of 0. Abnormalities on detailed neuropsychologic testing and 2 or more first-degree relatives with a diagnosis of AD were among the exclusion criteria for participation as a healthy control.
All participants gave written informed consent in accordance with the Declaration of Helsinki. The protocol was approved by the Ethical Committee of the University Hospitals Leuven.
Radiochemical Production of 18F-Flutemetamol
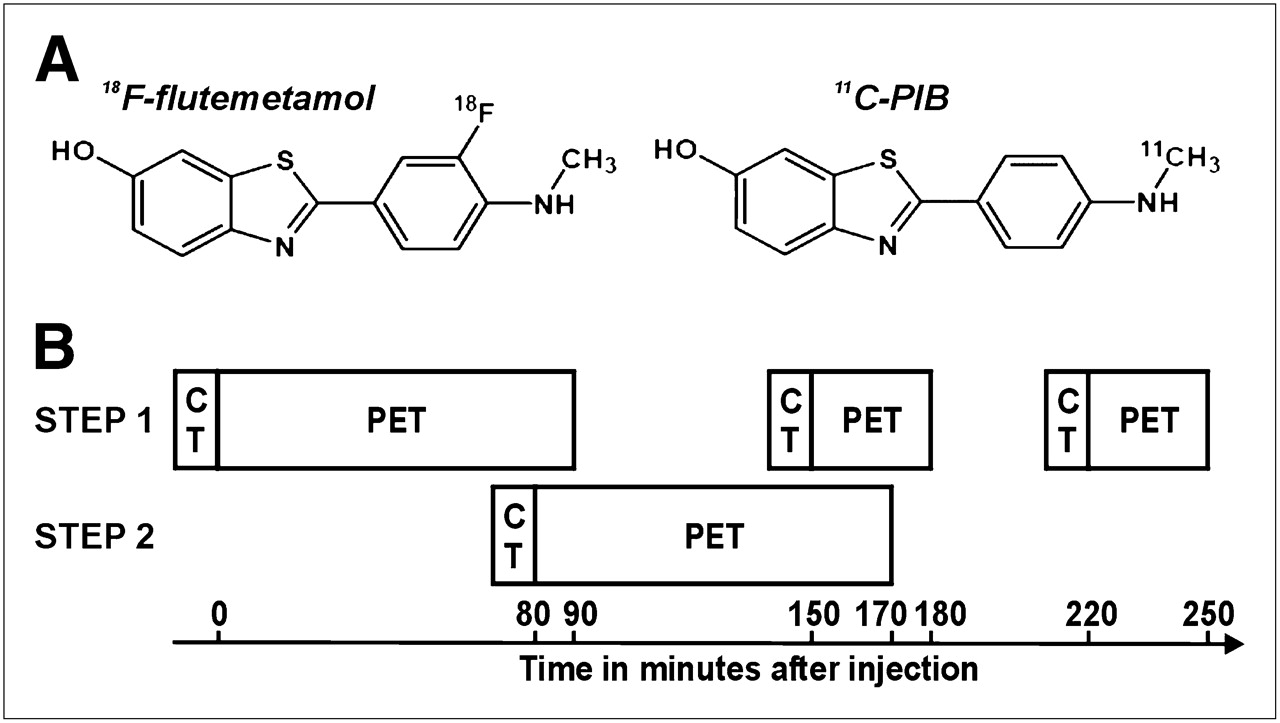
The investigational medicinal product 18F-flutemetamol (Fig. 1A) (containing the drug substance AH110690) was batch-manufactured according to good manufacturing guidelines (EudraLex, volume 4, annex 3) at the Cyclotron Research Centre, University of Liège, using a TracerLab-FXF-N chemistry platform (GE Healthcare). The chemical and radiochemical purity of the test item were assessed by an analytic high-performance liquid chromatograph equipped with an ultraviolet and radioactivity detector. The total AH110690 chemical content was 0.7 ± 0.3 μg/mL, and the radiochemical purity was 98.1% ± 1.2%. The identity of the radiolabeled product was confirmed by coelution on high-performance liquid chromatography of a cold analytic standard of AH110690.

(A) Chemical structure of 18F-flutemetamol and 11C-PiB parent molecule. (B) Acquisition scheme in steps 1 and 2.
18F-flutemetamol was supplied as a ready-to-inject solution with an upper limit fixed at 10 μg of cold AH110690 per dose, in line with good manufacturing guidelines, and the solution for injection contained 7% ethanol (v/v) and 0.5% polysorbate 80 (w/v) in phosphate buffer (0.015 M).
PET Acquisition
18F-flutemetamol was injected intravenously as a slow bolus in an antecubital vein (AD patients: 180.9 ± 5.4 MBq (mean ± SD), with a range of 171.5–187.6 MBq; healthy controls: 179.6 ± 3.8 MBq, with a range of 172.5–184.7 MBq). Dynamic brain scanning was performed using a 16-slice Biograph PET/CT scanner (Siemens) in 3-dimensional list mode.
In step 1 of the study, PET data acquisition was started at the time of tracer injection and lasted for 90 min; a second period of data acquisition ran from 150 to 180 min, and a third ran from 220 to 250 min. Before the start of each PET epoch, subjects were repositioned in the scanner and a low-dose CT scan was obtained (Fig. 1B).
In step 2, the acquisition procedure was simplified on the basis of time–activity curves obtained in step 1: data acquisition was limited to 80–170 min after injection, with the option of aborting the scan at 140 min, which was requested by 2 healthy controls. A low-dose CT scan was acquired before the PET scan (Fig. 1B).
PET data were corrected for attenuation (based on the CT scan), randoms, and scatter using the manufacturer's software. Data were reconstructed using Fourier rebinning and 2-dimensional ordered-subsets expectation maximization (81 axial slices, 5 iterations and 8 subsets, 128 × 128 matrix, 2.5× zoom, 2.13-mm pixels, 2-mm slice thickness, 2-mm slice separation, gaussian postsmoothing with a full width at half maximum of 5 mm, and no smoothing in the axial direction). Full dynamic data acquired in step 1 were reconstructed as 4 × 30, 6 × 60, 4 × 180, 8 × 300, 3 × 600, 3 × 600, and 3 × 600 s time frames. Step 2 data were reconstructed as 18 × 300 s frames.
MRI Acquisition
MRI scans were acquired with an Intera 1.5-T scanner (Philips) within 30 d before the subject's PET scan. The scanning protocol included a high-resolution structural T1-weighted image (3-dimensional magnetization-prepared rapid gradient echo, 10-s repetition time, 4-ms echo time, 20-ms inversion time, 500-ms delay time, 10° flip angle, 256 × 256 matrix, and 1-mm3 voxels) and a fluid attenuation inversion recovery scan (coronal 5-mm slices, 5-s repetition time, 110-ms echo time, 1,850-ms inversion time, 256 × 256 matrix, 200-mm field of view, and 2 acquisitions). For technical reasons, the T1-weighted image was not available for 2 subjects.
Discrete Blood Sampling and Parent Analysis
In step 1, arterial blood samples (3 mL) were collected at 10-s intervals during the first minute, at 15-s intervals during minutes 2 and 3, and at 4, 8, 15, 30, 45, 60, 90, 120, 180, and 240 min after injection. Red blood cells were removed by centrifugation. The counts/s were measured with a well counter and translated into activity concentration data in Bq/mL, decay-corrected to the time of tracer administration.
In addition, arterial blood samples (2 mL) were collected at 2, 5, 20, 60, and 180 min after injection to determine the percentage of radioactive parent compound and metabolites. Blood samples were centrifuged, and the separated plasma supernatant was collected. The plasma was mixed with a solution of reference flutemetamol in acetonitrile and then injected onto the high-performance liquid chromatography system (LaChrom Elite; Hitachi) equipped with a Chromolith Performance RP-18e (100 × 3 mm) column (Merck). Separation was performed with a gradient elution protocol. With guidance by the ultraviolet signal, 3 fractions were collected (before, during, and after the 18F-flutemetamol peak), and the radioactivity was measured in the γ-sample changer.
Image Preprocessing
The 3 dynamic PET scans of step 1 were concatenated. For steps 1 and 2, the voxel values of all frames were decay-corrected to the time of 18F-flutemetamol administration. All PET frames were realigned using an automated method (21), and a PET sum image was created. The MRI scan was coregistered to the PET summed image using a mutual information–based method (22). The MRI scans were spatially normalized into Montreal Neurologic Institute space using a second-order polynomial transformation and normalized mutual information as the cost function (23). The normalization matrix was then applied to the coregistered PET scans.
Volume-of-Interest (VOI) Analysis
Twelve VOIs were drawn on an MRI template in Montreal Neurologic Institute space. VOIs included the lateral frontal cortex, medial temporal cortex, lateral temporal cortex, lateral parietal cortex, occipital cortex, striatum, sensorimotor cortex, anterior cingulate, posterior cingulate, pons, subcortical white matter, and cerebellar cortex. In addition, a composite cortical VOI was defined by taking the volume-weighted average of lateral frontal, lateral temporal, lateral parietal, anterior, and posterior cingulate regions. For each subject, the VOIs were checked against the subject's spatially normalized MR image, and adjustments were made if necessary. Time–activity curves were generated from bilateral homologous VOIs. As in previous Aβ amyloid-imaging PET studies (1,17,24), the cerebellar cortex was selected as the primary reference region because it is notably free of fibrillary plaques. Because Aβ amyloid plaques are absent in the pons (25), and 11C-PiB uptake in this area is similar in AD patients and controls (1), we also evaluated whether similar results could be obtained with the current compound if the pons was used as a reference region.
Compartmental Modeling of Step 1 Data
A 2-tissue-compartment model, arterial input function (2TC-4k) (26), was applied to the step 1 data to characterize the influx (K1, mL·cm−3·min−1) and efflux (k2, min−1) across the blood–brain barrier (first compartment), and binding (k3, min−1) and release (k4, min−1) (second compartment) of 18F-flutemetamol within the defined VOIs. The general assumption was that free and nonspecific tracer compartments were indistinguishable. Constant cerebral blood volumes were assumed (0.02 in pons and subcortical white matter, 0.035 in striatum, 0.05 in cerebellar and occipital cortex, and 0.04 in the remaining cortical regions (27)). Using the arterial input function (corrected for the presence of metabolites) and regional time–activity curves as model inputs, we established the kinetic rate constants by iterative curve fitting. The most important parameters derived from the 2TC-4k model, reflecting specific tracer binding, were the total distribution volume, VT, which equals K1/k2(1 + k3/k4), and the distribution volume ratio, DVR, which is a normalization of the regional VT by the nonspecific retention in the reference region. For comparison, the special cases in which k4 = 0 or k3 = k4 = 0 were also studied. The performance of different model configurations was assessed using the Akaike information criterion (AIC) expressed as percentages, that is, how much lower (better) a model's AIC was than the AIC of the comparison model.
Graphical Analysis of Step 1 Data
An alternative quantification approach is the Logan graphical analysis method (28), which is appropriate for reversible in vivo kinetics. This method linearizes the kinetics of brain uptake of the tracer in tissue after it has equilibrated with the tracer in plasma. Logan analysis was applied over the 60- (or 70-) to 250-min PET scan interval of the step 1 data. Constant cerebral blood volumes were assumed (as above), and the equation of the linear function was estimated by least-squares linear regression.
The slope of the linearization is equivalent to either the tracer VT or the DVR, depending on whether the input function is the arterial input function (“input-Logan” approach) or the time–activity curve of a reference region acting as an indirect input function (“reference-Logan” approach), respectively.
Standardized Uptake Value (SUV) Ratio Analysis of Pooled Step 1 and Step 2 Data
The SUV ratio is a semiquantitative measure of tracer uptake, normalized for the mean uptake in a reference region, and does not require arterial blood sampling or dynamic imaging. SUV ratio is defined as the ratio of SUV in the VOI to SUV in a reference region, with SUV being the integrated activity over a given period per unit of injected dose and body weight.
To maximize the data available for analysis, a common time epoch (85–170 min) was interrogated from the combined step 1 and step 2 data. Because step 1 data were acquired from 0 to 90, 150 to 180, and 220 to 250 min after injection, an exponential function was fitted to the time–activity curves and used to interpolate regional brain uptake over the 90- to 150-min interval.
We also evaluated the impact of scanning start time after injection and scanning length on discrimination between the healthy control and AD groups: for each combination of start times (85–165 min) and window lengths (5–40 min), SUV ratios were calculated for each VOI and subject, and the discrimination between the groups was analyzed. For start times toward the end of the interval, the maximum window length was constrained to never overflow the end of the interval (170 min).
Statistical Analysis
Least-squares linear regression was used to evaluate the relationships between DVR and SUV ratios in the step 1 data, and the strength of the correlation was assessed by means of the coefficient of determination (r2). A 1-sided Wilcoxon/Mann–Whitney nonparametric test was used to assess whether AD scans showed higher uptake in the VOIs relative to the control scans (steps 1 and 2 combined). Statistical tests used a 0.05 significance level, and analyses were performed using the software “R,” version 2.8.0 (http://www.R-project.org).
Voxel-Based Analysis
Voxel-based analysis was used to determine the topography of tracer binding in an unbiased manner. SUV ratio images were calculated by summing normalized PET data over 80–90 min and dividing every voxel value by the mean value in the cerebellar cortex. Before statistical analysis, SUV ratio images were smoothed with an isotropic gaussian kernel of 12 mm in full width at half maximum. Voxelwise 2-sample t tests (SPM2, Statistical Parametric Mapping, Wellcome Department of Cognitive Neurology) were used to determine differences between AD patients and the control group, thresholded at a voxel-level P < 0.05 corrected for the whole brain volume.
RESULTS
Step 1: Optimization of Acquisition and Comparison of Analysis Procedures
Plots of the 18F-flutemetamol arterial plasma activity concentration as a function of time were similar across groups, and a reasonable representation of the bolus peak was obtained for all step 1 subjects. The parent analysis showed polar metabolites and similar metabolism in AD patients and healthy controls. The amount of intact 18F-flutemetamol decreased rapidly over time and was 84.7% ± 4.8% (control) and 77.5% ± 2.7% (AD) after 2 min, 23.8% ± 1.0% (control) and 27.0% ± 2.4% (AD) after 20 min, and 12.2% ± 1.9% (control) and 15.3% ± 3.4% (AD) after 60 min. After about 180 min, the amount was 7.3% ± 1.9% (control) and 13.4% ± 0.6% (AD), but counting statistics were poor. The arterial input function was obtained by correcting the arterial plasma activity for the amount of intact 18F-flutemetamol.
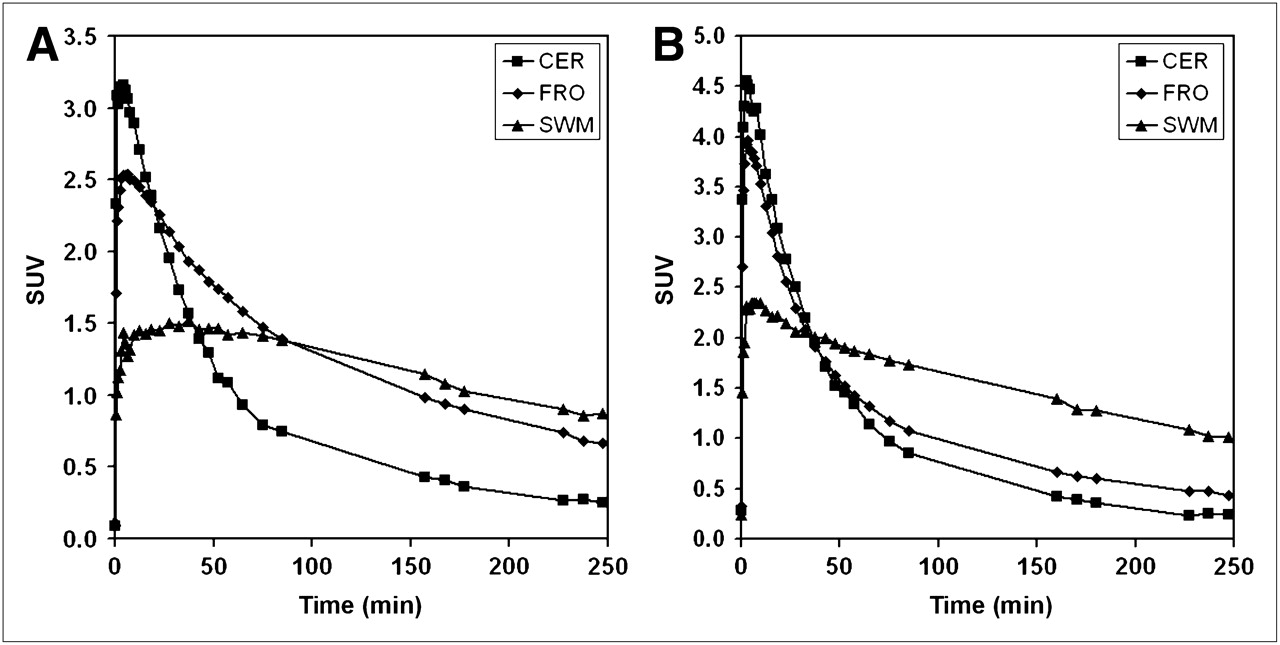
Time–activity curves (Fig. 2) indicated that at 80 min after injection the ratio of cortical versus cerebellar SUV was maximal in AD patients and healthy controls and remained approximately constant over the following 90 min.

Representative examples of time–activity curves for cerebellum (CER), frontal cortex (FRO), and subcortical white matter (SWM) in AD patient 2 (A) and healthy control 2 (B). SUV is activity concentration in VOI/(injected dose/subject weight).
Compartmental Modeling of Step 1 Data
The cortical and striatal regional time–activity curves were well described by the 2TC-4k compartment model. Setting k4 to 0 (assuming irreversible tracer binding) clearly did not fit the data as well (AIC = 16% ± 4% when all cortical regions and subjects were considered), indicating that the specific binding of 18F-flutemetamol to these tissues was reversible. In cerebellum, the 2TC-4k modeling of the time–activity curve showed only a marginal improvement in quality of fit over the simpler 1-tissue-compartment model (1TC-2k) modeling result in 3 subjects (AIC = 3.1% ± 3.7%). For the remaining 3 subjects, the 2TC-4k modeling result was better (AIC = 11% ± 2%) and the k3/k4 > 0 component was assigned as nonspecific retention since uptake levels in cerebellum were similar in controls and AD patients and specific binding was negligible. The same assignment could be made for the second compartment (k3, k4) for pons and subcortical white matter.
Graphical Analysis of Step 1 Data
Table 2 lists DVR values obtained by the 2TC-4k model and by the input-Logan and reference-Logan approaches, using cerebellum as the reference region. Logan graphical analysis produced adequate linearization over the studied time window for all regions across subjects.
Regional DVRs of 18F-Flutemetamol in AD Patients and Healthy Controls Using 3 Modeling Approaches
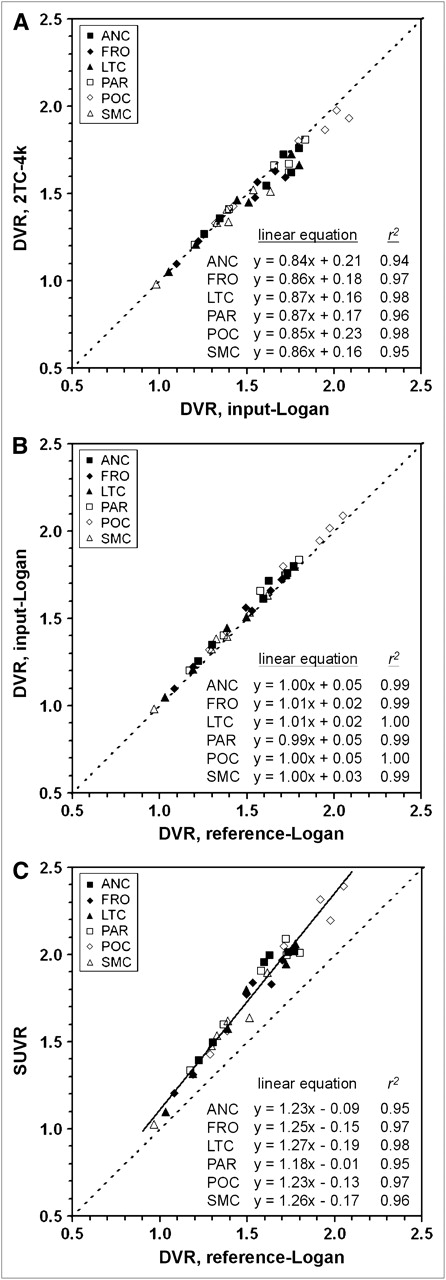
The correlation between DVRs obtained with 2TC-4k and input-Logan (Fig. 3A), as well as with input-Logan and reference-Logan (Fig. 3B), was determined for all VOIs across all 6 subjects. The 3 methods were highly correlated overall, with a regression slope of 0.88 (2TC-4k vs. input-Logan) and 1.01 (input-Logan vs. reference-Logan) for all regions and subjects taken together.

Data for step 1. Correlation plots for cortical regions showing highest 18F-flutemetamol uptake in AD patients: DVR from 2TC-4k model vs. DVR from input-Logan approach (A), DVR from input-Logan approach vs. DVR from reference-Logan approach (B), and SUV ratio averaged over 85–105 min vs. DVR from reference-Logan approach (C). r2 = coefficient of determination. ANC = anterior cingulate; FRO = frontal cortex; LTC = lateral temporal cortex; PAR = parietal cortex; POC = posterior cingulate; SMC = sensorimotor cortex; SUVR = SUV ratio.
SUV Ratio Analysis of Step 1 Data
There was a tight linear relation between SUV ratio (scan window, 85–105 min) and DVR values from the reference-Logan analysis for all VOIs, with SUV ratio being slightly higher and more responsive than DVR to an increasing 18F-flutemetamol concentration in cortical regions (Fig. 3C).
A similar linear relation was found between SUV ratio and DVR from a reference-Logan analysis when the pons was used as the reference region (slope = 1.15, r2 = 0.99), but here SUV ratios were slightly lower (8.5% ± 6.2%) than DVR (data not shown).
The comparison of step 1 results for the various analysis methods clearly revealed similar trends and discrimination capabilities between AD patients and healthy control subjects, despite the different models (compartmental and Logan DVRs) and inputs (arterial and reference region). This finding both motivated and justified the use of the simple SUV ratio method in the pooled analysis to compare AD patients and healthy controls. On the basis of the time–activity curves obtained in step 1 (Fig. 2), we selected 80 min as the starting time of the acquisition for step 2.
SUV Ratio Group Comparison of AD Patients Versus Healthy Controls (Steps 1 and 2 Pooled)
For the pooled step 1 and step 2 data, the SUV ratio analysis found good discrimination between healthy controls and AD patients (Fig. 4). Nearly all cortical brain areas (Fig. 5A) showed a significant difference in SUV ratio (85- to 105-min window) between AD patients and healthy controls, except medial temporal cortex (P = 0.36) and occipital cortex (P = 0.22). Striatal SUV ratio analysis also showed significant discrimination between the AD and control groups (P = 0.005). SUV ratio in pons (P = 0.90) and subcortical white matter (P = 0.75) did not differ between groups.
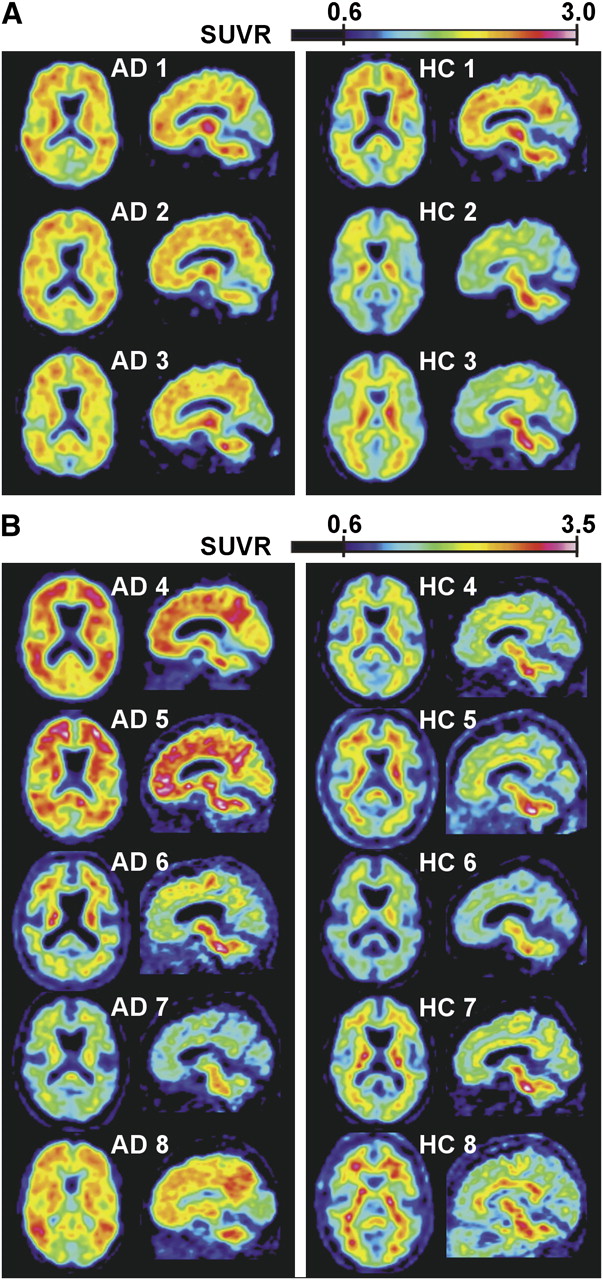
Axial and sagittal SUV ratio images in step 1 (70–90 min) (A) and step 2 (85–105 min) (B) in AD patients and healthy controls. Cerebellar cortex was used as reference region. SUV ratio upper limit was set at higher value in B than in A to compensate for increasing SUV ratio at later scan times (Fig. 6). SUVR = SUV ratio.

Pooled data for steps 1 and 2. (A) SUV ratios integrated over 85- to 105-min time window using cerebellum as reference region. (B) Composite cortical region: distribution of SUV ratios using cerebellum and pons as reference region for 85- to 105-min time window. Subject rank order within AD and control groups is given in left and right margins of respective dataset. Mean and SD for each group (excluding outliers) are represented with error bars. SUV ratios of pons and subcortical white matter are referred to a separate y-axis. P values (1-sided) denote significance of Wilcoxon/Mann–Whitney test to discriminate between entire AD group (n = 8) and healthy control group (n = 8). Circles = AD patients; triangles = healthy controls; filled symbols = outliers; ANC = anterior cingulate; CER = cerebellum; FRO = frontal cortex; LTC = lateral temporal cortex; MTC = medial temporal cortex; OOC = occipital cortex; PAR = parietal cortex; POC = posterior cingulate; PON = pons; SMC = sensorimotor cortex; STR = striatum; SUVR = SUV ratio; SWM = subcortical white matter.
In AD patients 6 and 7, SUV ratios in the cortical VOIs overlapped with the SUV ratio range seen in healthy controls (Fig. 5). Conversely, healthy control 1 demonstrated in the cortical VOIs high SUV ratios that were at the lower end of the SUV ratio range seen in subjects with probable AD.
Figure 5B compares the discriminating ability of SUV ratios (85–105 min) for the composite cortical VOI using either cerebellum or pons as the reference region. The discrimination between the 8 AD patients and 8 healthy controls was found to be more significant when cerebellum was used as the reference region (P = 0.007) than when pons was used (P = 0.019). The subject rank order also differed for the 2 parameters (Fig. 5B).
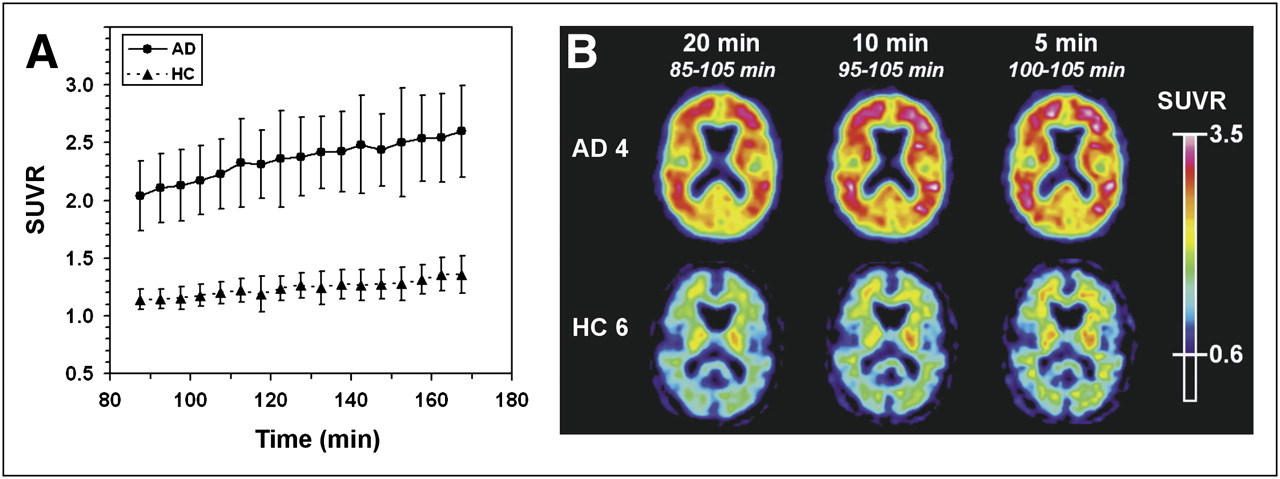
Analysis of SUV ratio versus start time showed a slight increase with later scanning times in the 85- to 170-min window (Fig. 6A), especially for the cortical regions with elevated uptake in AD patients, but the rank order was nearly constant. Later scan start times resulted in only a minor improvement in discrimination between AD patients and healthy controls. Discrimination between patients and controls was only marginally affected by different scanning lengths (5–40 min), and scanning times as short as 5–10 min were adequate (Fig. 6B).

(A) Average SUV ratio curves (±SD) in frontal cortex over 85- to 170-min time window (5-min length) in AD patients (•, n = 6) and healthy controls (▴, n = 7). SUV ratios of outlier (Fig. 5) AD patients 6 and 7 and healthy control 1 were not included in this averaging. (B) Comparison of axial PET sum images of different scan lengths (5, 10, and 20 min) at constant scan end time (105 min) for 1 representative AD patient (AD patient 4) and 1 healthy control (healthy control 6). HC = healthy control; SUVR = SUV ratio.
To elucidate the topography of 18F-flutemetamol uptake, we compared the six 18F-flutemetamol–positive AD patients with the seven 18F-flutemetamol–negative healthy controls using voxel-based statistics. Highly significant differences were found in neocortical association zones (Fig. 7).
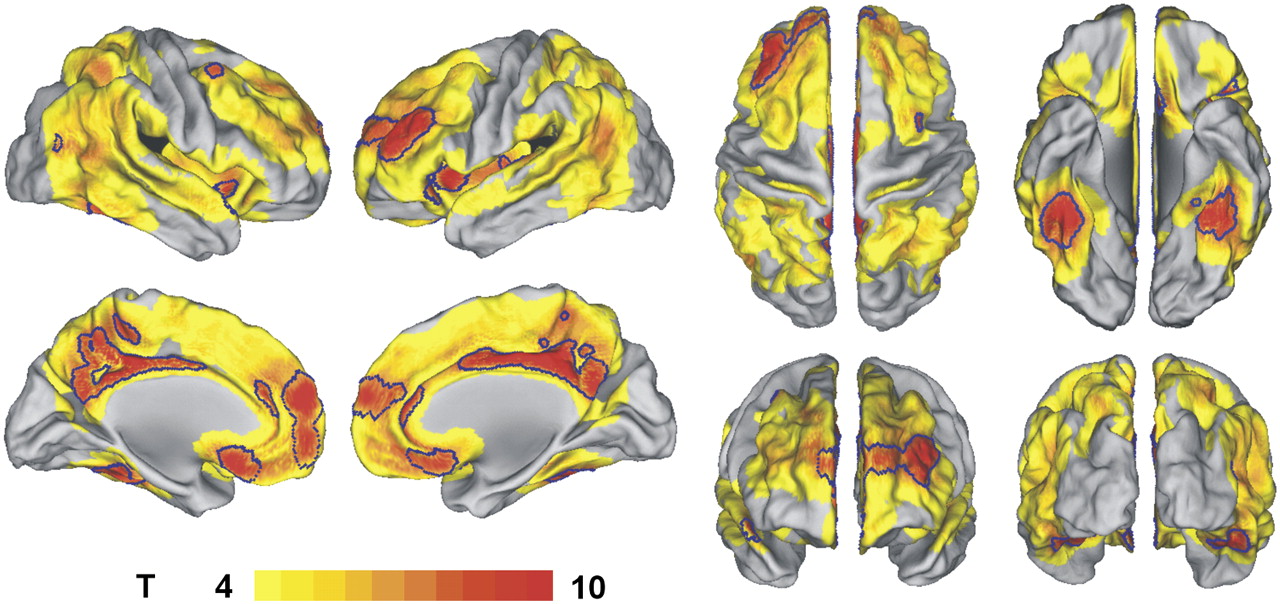
Surface rendering (CARET 5.51 (40)) of areas of significantly increased amyloid deposition in six 18F-flutemetamol–positive AD patients compared with seven 18F-flutemetamol–negative healthy controls, based on SUV ratio images integrated over 80–90 min (using cerebellum as reference region). Voxel-level uncorrected P < 0.001. Areas outlined in blue: voxel-level P < 0.05 corrected for whole brain volume.
DISCUSSION
We have shown that, when applied after 80 min, computationally simple methods using a reference region uptake ratio discriminate well between 18F-flutemetamol–positive AD patients and 18F-flutemetamol–negative healthy controls (Table 2; Figs. 4, 5, and 7), even for scanning times as short as 5–10 min (Fig. 6B). This discrimination was only marginally affected by the scanning start time (Fig. 6A) or scanning length (Fig. 6B) for time windows beyond 80 min. A recent analysis of different scanning windows for 11C-PiB provides evidence that a 50- to 70-min scanning window is the overall best compromise for SUV ratio calculations (29). For the current 18F agent, an acquisition window starting from 80 min onward appears to be most suitable.
The retention of 18F-flutemetamol was similar in AD patients and healthy controls in brain regions known to be relatively unaffected by amyloid deposition, such as pons, cerebellum, and subcortical white matter (Table 2; Figs. 5 and 7). The exact quantification method used, DVR or SUV ratio, had little impact on the discriminatory power of 18F-flutemetamol, in accordance with previous 11C-PiB studies (30,31). Moreover, the choice of reference region, cerebellar cortex or pons, did not make much difference (Fig. 5B).
AD patients 6 and 7 showed an uptake pattern that was indistinguishable from the binding typical in healthy controls (Fig. 4, 5). Clinically and on neuropsychologic testing, these patients were comparable to the 18F-flutemetamol–positive AD patients (Table 1). A small percentage (10%−20%) of patients with a diagnosis of clinically probable AD who had received a 11C-PiB PET scan in previous research studies also did not show elevated cortical tracer uptake (1,32,33). These negative scans may reflect limited sensitivity of the tracer (6,34) or, more likely, a lack of Aβ amyloid disease in these patients.
Conversely, healthy control 1 had increased 18F-flutemetamol uptake. His values were at the lower end of those observed in AD. We cannot strictly rule out that increased cortical values partially resulted from spillover of white matter signal. However, the proportion of 18F-flutemetamol–positive healthy controls in the current sample was comparable to the 10%−30% of cognitively intact elderly controls who show elevated 11C-PiB brain uptake indistinguishable from AD (32,33,35–37).
The spatial distribution of 18F-flutemetamol uptake in AD closely resembles that typically seen with 11C-PiB binding (Fig. 7) (1,16,33,37–39). As in 11C-PiB, striatal uptake of 18F-flutemetamol was high and uptake in medial temporal cortex, one of the areas of predilection for neurofibrillary tangles in AD, relatively low. White matter uptake of 18F-flutemetamol was conspicuous in a subset of healthy controls (e.g., healthy controls 3, 5, and 7 in Fig. 4). Statistically, this uptake did not differ between AD patients and healthy controls at the group level. White matter uptake probably reflects the slower clearance of the tracer from white matter than from the cortex (7).
Although reference region–based analysis methods (DVR and SUV ratio) performed well in discriminating AD patients from controls, the VT values and kinetic rate constants from the input function–based kinetic modeling gave less consistent results. Similar to 11C-PiB, the peripheral metabolism of 18F-flutemetamol is rapid, and as a result the determination of intact tracer fractions at late time points suffers from high statistical variability (24). This can introduce a bias in the fitted intact fraction curve, which will in turn propagate into the results from input-based compartmental modeling. Use of the ratio of the distribution volumes in target and reference tissue, obtained from input function–based modeling, therefore appears a more robust approach, and the time–activity curve of an appropriate reference region can be used as an indirect input function to obtain ratios instead of absolute values. In our study, SUV ratio and DVR showed little variability and allowed good discrimination between AD patients and controls without the need for invasive and technically demanding blood sampling and analysis.
CONCLUSION
18F-flutemetamol uptake can readily be quantified using reference region uptake ratios after 80 min and provides good discrimination between AD patients and healthy controls. These phase 1 results justify further pursuit of 18F-flutemetamol as a biomarker for AD-related amyloidosis with wider availability for clinical and research purposes than its “parent molecule,” 11C-PiB.
Acknowledgments
We thank Carine Schildermans, Stijn Dirix, Hendrikje Jeandarme, Mieke Soons, and the Cyclotron Research Centre Liège, as well as the patients and healthy volunteers. This study was sponsored by GE Healthcare Ltd.
Footnotes
-
↵* Contributed equally to this work.
-
COPYRIGHT © 2009 by the Society of Nuclear Medicine, Inc.
References
- Received for publication February 13, 2009.
- Accepted for publication April 28, 2009.


Jump to section
Related Articles
Cited By...
- Traumatic brain injury and Alzheimers Disease biomarkers: A systematic review of findings from amyloid and tau positron emission tomography (PET)
- Distinct disease mechanisms may underlie cognitive decline related to hearing loss in different age groups
- The RSNA QIBA Profile for Amyloid PET as an Imaging Biomarker for Cerebral Amyloid Quantification
- Comparison of 11C-Pittsburgh Compound B and 18F-Flutemetamol White Matter Binding in PET
- Assessing Amyloid Pathology in Cognitively Normal Subjects Using 18F-Flutemetamol PET: Comparing Visual Reads and Quantitative Methods
- Spatial Normalization of 18F-Flutemetamol PET Images Using an Adaptive Principal-Component Template
- Prediction of the Clinical SUV Ratio in Amyloid PET Imaging Using a Biomathematic Modeling Approach Toward the Efficient Development of a Radioligand
- Visualization and Quantification of 3-Dimensional Stereotactic Surface Projections for 18F-Flutemetamol PET Using Variable Depth
- Detailed comparison of amyloid PET and CSF biomarkers for identifying early Alzheimer disease
- PET Approaches for Diagnosis of Dementia
- Automated Quantification of 18F-Flutemetamol PET Activity for Categorizing Scans as Negative or Positive for Brain Amyloid: Concordance with Visual Image Reads
- Seoul criteria for PiB(-) subcortical vascular dementia based on clinical and MRI variables
- Longitudinal Amyloid Imaging Using 11C-PiB: Methodologic Considerations
- Implementation and Validation of an Adaptive Template Registration Method for 18F-Flutemetamol Imaging Data
- PET Quantification of 18F-Florbetaben Binding to {beta}-Amyloid Deposits in Human Brains
- Brain Imaging in Alzheimer Disease
- Clinical Validation of 18F-AZD4694, an Amyloid-{beta}-Specific PET Radioligand
- Performance Characteristics of Amyloid PET with Florbetapir F 18 in Patients with Alzheimer's Disease and Cognitively Normal Subjects
- Target-Specific PET Probes for Neurodegenerative Disorders Related to Dementia
- Specific estrogen sulfotransferase (SULT1E1) substrates and molecular imaging probe candidates