


Abstract
Clinical trials of the PET amyloid imaging agent 18F-flutemetamol have used visual assessment to classify PET scans as negative or positive for brain amyloid. However, quantification provides additional information about regional and global tracer uptake and may have utility for image assessment over time and across different centers. Using postmortem brain neuritic plaque density data as a truth standard to derive a standardized uptake value ratio (SUVR) threshold, we assessed a fully automated quantification method comparing visual and quantitative scan categorizations. We also compared the histopathology-derived SUVR threshold with one derived from healthy controls. Methods: Data from 345 consenting subjects enrolled in 8 prior clinical trials of 18F-flutemetamol injection were used. We grouped subjects into 3 cohorts: an autopsy cohort (n = 68) comprising terminally ill patients with postmortem confirmation of brain amyloid status; a test cohort (n = 172) comprising 33 patients with clinically probable Alzheimer disease, 80 patients with mild cognitive impairment, and 59 healthy volunteers; and a healthy cohort of 105 volunteers, used to define a reference range for SUVR. Visual image categorizations for comparison were from a previous study. A fully automated PET-only quantification method was used to compute regional neocortical SUVRs that were combined into a single composite SUVR. An SUVR threshold for classifying scans as positive or negative was derived by ranking the PET scans from the autopsy cohort based on their composite SUVR and comparing data with the standard of truth based on postmortem brain amyloid status for subjects in the autopsy cohort. The derived threshold was used to categorize the 172 scans in the test cohort as negative or positive, and results were compared with categorization using visual assessment. Different reference and composite region definitions were assessed. Threshold levels were also compared with corresponding thresholds derived from the healthy group. Results: Automated quantification (using pons as the reference region) demonstrated 91% sensitivity and 88% specificity and gave 3 false-positive and 4 false-negative scans. All 3 false-positive cases were either borderline-normal by standard of truth or had moderate to heavy cortical diffuse plaque burden. In the test cohort, the concordance between quantitative and visual read categorization ranged from 97.1% to 99.4% depending on the selection of reference and composite regions. The threshold derived from the healthy group was close to the histopathology-derived threshold. Conclusion: Categorization of 18F-flutemetamol amyloid imaging data using an automated PET-only quantification method showed good agreement with histopathologic classification of neuritic plaque density and a strong concordance with visual read results.
Amyloid PET radiotracers have been developed for in vivo assessment of amyloid β deposition in the brain and may prove useful both clinically and in Alzheimer disease research. The first widely used research amyloid PET tracer was the 11C-labeled investigational tracer Pittsburgh compound B (1). However, the 20-min half-life of 11C restricts the use of Pittsburgh compound B to centers with an on-site cyclotron. For wider access and commercialization, a tracer with a longer half-life is needed, and several tracers labeled with 18F (half-life, 110 min) are being developed. At the time of writing, 18F-florbetapir (2,3) and 18F-florbetaben (4,5) are approved for clinical use by the Food and Drug Administration and the European Medicines Agency, and 18F-flutemetamol (6,7) is approved by the Food and Drug Administration and is under evaluation by the European Medicines Agency. Another compound in late-stage development is the investigational amyloid imaging agent NAV4694 (8).
The currently approved amyloid imaging PET tracers have been approved for visual assessment of the PET image in which a trained reader categorizes scan results as negative (normal uptake) or positive (increased gray-matter uptake). However, quantification may be important for several reasons. Recent work indicates that the amount of amyloid has a prognostic value (9) and that any assessment of longitudinal change requires quantification. Quantification also facilitates comparison of results across centers. Quantitative methods often rely on computation of standardized uptake value ratios (SUVRs) between target regions and a reference region in a late-sum scan (10). To use quantitative data for categorization of scans as positive or negative, an SUVR threshold is needed. Previously proposed methods for threshold derivation include methods based on receiver-operating-curve (ROC) analysis (11,12) and a method based on the statistical distance between Alzheimer disease and healthy volunteer scans (7). If standard-of-truth data are available, an SUVR threshold that best separates subjects with and without brain amyloid can be found, as proposed by Clark et al. (3). Another approach, frequently used for 18F-FDG, applies data from healthy volunteers to generate a reference SUVR database from which a threshold can be derived.
In this paper, we quantified 18F-flutemetamol scans using a fully automated method and used postmortem data to derive an SUVR threshold. Using the threshold, we categorized scan results as positive or negative and compared these categorizations with those made by blinded readers in a previous clinical trial. We also assessed the usefulness of an 18F-flutemetamol reference database, with a threshold based on mean and SD information derived from amyloid-negative 18F-flutemetamol scans being used to categorize scans as positive or negative. We compared these results with those resulting from the postmortem standard-of-truth–based threshold.
MATERIALS AND METHODS
Subjects and Imaging
Data from 345 subjects imaged in 8 previous clinical studies of 18F-flutemetamol were used. All participants gave written informed consent that was approved by the Internal Review Board of each participating institution. We grouped subjects into 3 cohorts: an autopsy cohort (n = 68) comprising terminally ill patients with subsequent postmortem confirmation of brain amyloid status; a test cohort (n = 172) comprising 33 patients with clinically probable Alzheimer disease, 80 patients with mild cognitive impairment, and 59 healthy volunteers; and a healthy cohort comprising 105 healthy volunteers from 3 studies (7,13,14).
Data in the autopsy cohort were from a phase III, multicenter PET study of 18F-flutemetamol injection for detecting brain amyloid β (ClinicalTrials.gov identifier NCT01165554). Data in the test cohort were from a phase III study in which the effectiveness of an electronic training program for interpretation of 18F-flutemetamol images was assessed (ClinicalTrials.gov identifier NCT01672827).
Except in the autopsy cohort, 18F-flutemetamol PET images had been previously acquired as six 5-min frames starting 85–90 min after injection of approximately 185 MBq of 18F-flutemetamol; for this study, the first 4 frames were summed to yield a 20-min static scan. In the autopsy trial, the dose was between 185 and 370 MBq at investigator discretion, to allow use of higher doses to shorten imaging time for subjects who could not tolerate a 20- to 30-min imaging time because of their terminal condition. End-of-life subjects who were prone to agitation could also undergo sedation for the PET scan according to local clinical practice. Most end-of-life subjects underwent dynamic scanning in 2-min frames starting 90 min after injection. The first frames (typically 5) were summed to generate an image comprising the first 10 min of the scan.
Histopathology Analysis
The brains of subjects in the autopsy cohort were analyzed as part of a phase III study (ClinicalTrials.gov identifier NCT01165554). Histopathology data were obtained from subjects who died during the study and underwent brain autopsy. Postmortem histopathologic examination was performed at a central pathology laboratory. Two tissue blocks were taken from each of the following regions: precuneus, midfrontal cortex, superior temporal cortex, middle temporal cortex, inferior parietal cortex, anterior cingulate gyrus, posterior cingulate gyrus, and primary visual cortex. Three slides were prepared from tissue slices taken from each block, for a total of 6 slides per region. Each slide was stained using the Bielschowsky silver stain (15). Each of 5 fields of view per slide was assessed for neuritic plaque density, which was classified as none (0 plaques), sparse (1–5 plaques), moderate (6–19 plaques), or frequent (≥20 plaques), following Vemuri’s modification of the Consortium to Establish a Registry for Alzheimer Disease criteria (16,17). Each field-of-view assessment was scored as 0 (for none), 1 (for sparse), 2 (for moderate), or 3 (for frequent), and the 5 field-of-view scores were averaged for each of the 6 tissue slides prepared from a region. The 6 mean field-of-view scores were then averaged to give an overall mean Bielschowsky score for each of the 8 cortical regions. The midpoint (1.5) of the neuritic plaque density scoring scale was used as the threshold for categorizing overall mean Bielschowsky score as normal or abnormal. If the mean Bielschowsky score was greater than 1.5, the region was classified as abnormal, and the subject’s brain was classified as abnormal. The brain was classified as normal only if all regions were classified as normal. The brain classification was used as the standard of truth for determining sensitivity and specificity.
Blinded Image Evaluation
Masked image evaluations were conducted previously in a phase III study in which the effectiveness of an electronic training program for interpretation of 18F-flutemetamol images was assessed (ClinicalTrials.gov identifier NCT01672827). In this study, each subject’s PET image was interpreted separately by 5 readers, each of whom was blinded to all subject clinical information and the neuropathology classification. Readers had been trained using a DVD-based program. Images were reviewed in color, typically using a Sokolov or rainbow color scale. The readers were trained to assess the following regions for 18F-flutemetamol activity: frontal, posterior cingulate/precuneus, lateral temporal, inferior parietal, and striatal. Positive images were defined as having at least one cortical region with reduction or loss of the normally distinct gray matter–white matter contrast, that is, one or more regions with increased critical gray matter (>50%–60% intensity) or reduced white matter contrast (the white matter sulcal pattern being less distinct). The results of the blinded image evaluations were available for all scans in the autopsy and test cohorts. For this study, we used the majority visual read results, that is, the scan classification on which at least 3 readers agreed.
Quantification
18F-flutemetamol activity was quantified using a previously described fully automated PET-only method that uses an adaptive template for handling different uptake patterns in negative and positive flutemetamol images (18). The adaptive template method was used to spatially normalize the flutemetamol scans to Montreal Neurological Institute template space. Retention ratios were computed for a cortical composite region sampling areas from the frontal, parietal, lateral temporal, and anterior and posterior cingulate cortices. We evaluated 3 types of cortical composite region: small, large, and narrow. A small composite region was defined as the areas where the difference between healthy volunteer and Alzheimer patient is maximal. A large composite region was defined as a combination of automated anatomic labeling–type regions (19) outlined on the ICBM-152 template masked with a gray matter probability mask. A narrow composite region was defined as being the same as the large region but with narrowing to increase the distance both from the gray matter–white matter border and from the brain surface to the region (Fig. 1). The reference regions were pons, cerebellar gray matter, and whole cerebellum, and retention ratios were computed for all combinations of composite and reference regions.
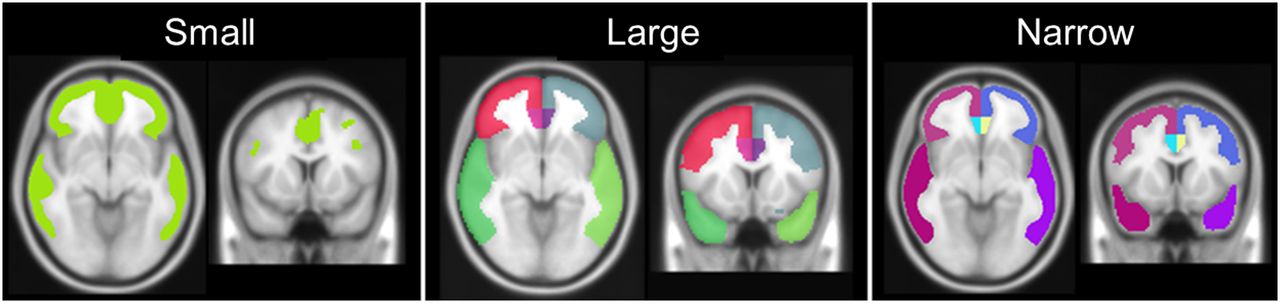
The 3 composite regions outlined on the Montreal Neurological Institute average T1 template.
Experiments
The 68 composite SUVRs for the autopsy cohort were ranked and compared with the standard-of-truth data. An ROC analysis was performed, and the area under the curve (AUC) was used as a measure of the method’s ability to correctly categorize scans. Furthermore, we identified the SUVR threshold that best categorized scans, and sensitivity and specificity were calculated. The threshold was then used to categorize the scans in the test cohort, and the results were compared with the previous visual read results. Computation of AUC, derivation of the SUVR threshold, and subsequent categorization of scans and comparison with visual read results were done for all combinations of reference and cortical composite regions.
As an independent way of computing the threshold, we used the healthy cohort to derive an SUVR threshold. When individual scans are compared with a reference database, z scores are typically computed as follows: Eq. 1
Eq. 1
We investigated the use of a threshold corresponding to z = 2.0 and z = 2.5, where z defines the number of SDs above the normal mean. Thresholds derived from the reference database were compared with the corresponding thresholds derived from the autopsy cohort. This comparison was done for all reference regions but only for the narrow cortical composite region.
RESULTS
Comparison with Histopathology
ROC analysis showed that use of the pons as the reference region separated scans from standard-of-truth–normal and standard-of-truth–abnormal subjects, with an AUC ranging from 0.92 to 0.93 depending on the composite region used. When whole cerebellum and cerebellar gray matter were used as reference regions, the corresponding ranges were 0.90–0.92 and 0.87–0.90, respectively (Table 1). Pairwise significance testing using the method reported by DeLong et al. (22) showed that the only significant differences (P < 0.05) between the AUC when comparing reference regions were whole cerebellum versus cerebellar gray matter for the large and narrow target regions. The corresponding significance testing when comparing AUC within the same reference region but between target regions showed significant differences (P < 0.05) between small and large regions only when cerebellar gray matter was used as the reference region.
PET Quantitative Categorization vs. Standard of Truth for Different Target and Reference Regions
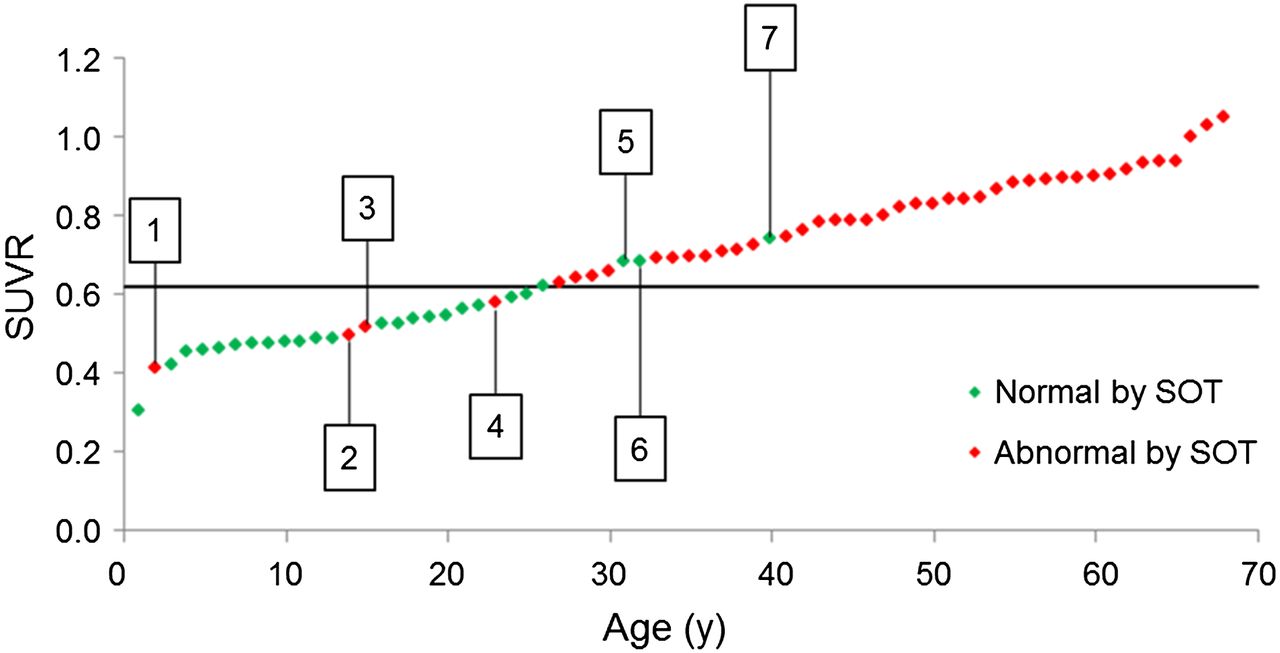
With pons as the reference region and using the small target region, an SUVR of 0.62 gave the best separation of scans from standard-of-truth–normal and standard-of-truth–abnormal subjects (Fig. 2). This threshold gave 3 false-positive scans and 4 false-negative scans, yielding a sensitivity of 91% and a specificity of 88%. Comparison with visual read results showed that all false-positive scans were positive also by visual read and 3 of 4 false-negative scans were negative by visual read (Fig. 3). The narrow and large target regions gave similar results but with slightly lower SUVR thresholds (0.58 and 0.56, respectively) for the pons reference region. The results for all combinations of target and reference regions are summarized in Table 1.

Plot showing SUVR data (pons as reference region) from 68 subjects in autopsy cohort in ascending order from left to right. Line corresponds to threshold that best separates standard-of-truth–normal from standard-of-truth–abnormal subjects (0.62). False-negative and false-positive scans are indicated by boxed numbers.
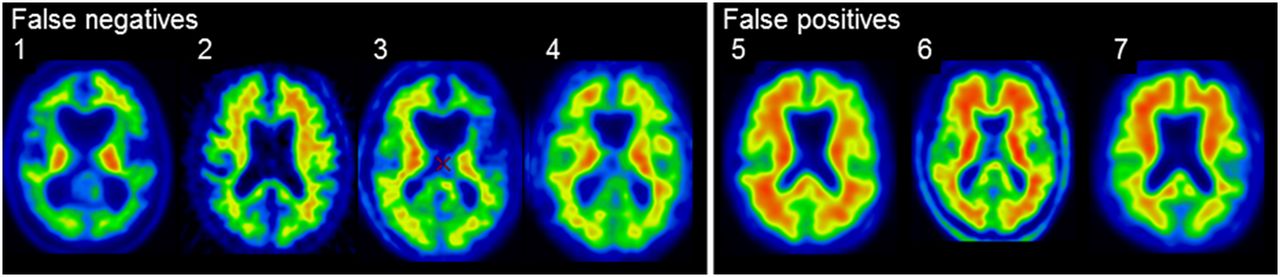
The 3 false-positive and 4 false-negative scan obtained using Pons-based SUVR threshold of 0.62. The 3 false-positive scans were abnormal and 3 of 4 false-negative scans were normal by visual read.
Categorization of Scans
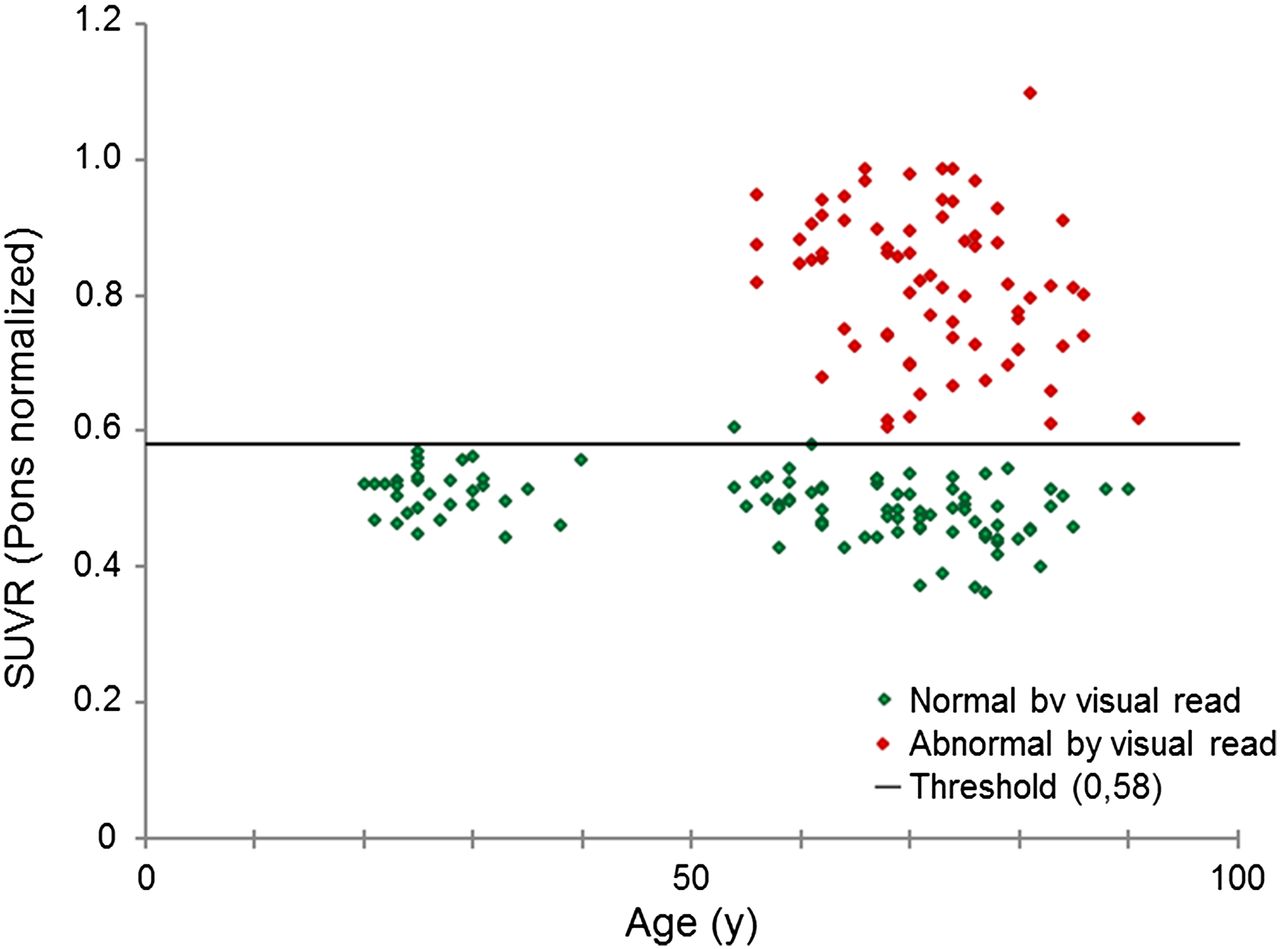
Dichotomous categorization of scans in the test cohort as negative or positive using the thresholds derived from the autopsy cohort gave concordance with visual read results ranging from 97.1% to 99.4% depending on the combination of reference and cortical composite regions. Figure 4 shows a plot illustrating how the autopsy-derived threshold for the pons/narrow region combination accurately separated 171 of 172 scans in the test cohort. Results for all region combinations summarized in Table 2 show that the concordance for quantitative and visual categorization was similar across the different composite regions. Comparison of the different reference region methods showed that pons and whole cerebellum–normalized data gave similar results (98.8%–99.4%), whereas data normalized to cerebellar gray matter had slightly lower concordance with visual read results (97.1%–98.8%).

SUVR values for all 172 subjects in test cohort plotted against age and color coded on the basis of majority visual read assessment. Pons/narrow SUVR threshold (0.58) derived from autopsy cohort gave concordance between quantitative and visual categorization in 171 of 172 scans.
Concordance between Quantitative and Visual Categorization
Reference Database Cohort
SUVR thresholds corresponding to a z score of 2.0 and 2.5 in the healthy cohort and with the narrow composite region are summarized in Table 3. For data normalized to pons, the threshold for z = 2.0 was similar to the autopsy-derived threshold (0.59 vs. 0.58) but was slightly lower for data normalized to cerebellar gray matter (1.46 vs. 1.57) and to whole cerebellum (1.21 vs. 1.27). SUVR thresholds corresponding to z = 2.5 were slightly higher, but the difference in thresholds z = 2.0 versus z = 2.5 had only a marginal impact on concordance with visual read results (Table 3).
Thresholds Obtained Using Amyloid-Negative Healthy Subjects
DISCUSSION
Using an autopsy cohort for which brain amyloid status was available based on a histopathologic standard of truth, we investigated a quantitative method to separate scans from standard-of-truth–normal and standard-of-truth–abnormal subjects. We performed an ROC analysis and computed the AUC for each combination of target and reference region. We determined SUVR thresholds, which we used for categorization of 18F-flutemetamol scans in a test cohort as negative or positive, and we calculated sensitivity and specificity. We compared results from this quantitative categorization with visual majority read results. Furthermore, we compared the thresholds obtained by comparison with histopathology with thresholds determined on the basis of the distribution in a group of amyloid-negative healthy control subjects.
For the autopsy cohort, group separation when using pons as the reference region gave AUC values in the range of 0.92–0.93. Categorization of scans using the small composite region gave 3 false-positive and 4 false-negative results. The 3 false-positive were all positive by visual read, and 3 of the 4 false-negative were negative by visual read. Analysis of the autopsy cohort data showed that the 4 false-negative had a neuritic plaque score that was close to the standard-of-truth threshold, suggesting these were borderline cases. Each also had some degree of cortical atrophy. Two false-positive results occurred in patients with a clinical history of dementia and neuropathologic evidence consistent with dementia with Lewy bodies who had diffuse plaques, as well as sparse or moderate neuritic plaques; these were below the 1.5 mean Bielschowsky score threshold for classifying the brains as abnormal for amyloid.
Use of the whole cerebellum as the reference region gave AUC values in the range of 0.90–0.92, and use of cerebellar gray matter as the reference region gave AUC values in the range of 0.87–0.90. However, the only statistically significant difference was when whole cerebellum was compared with cerebellar gray matter for the large and the narrow target regions. This result may be due to the fact that the autopsy cohort in this study included subjects with severely atrophied brains, which will add more variability to data normalized to the cerebellar gray matter reference region than to data normalized to the other reference regions. The whole-cerebellum reference region was defined as the cerebellar gray matter region with an extension to include also white matter. It seems as if inclusion of white matter partly compensates for the potential deficiencies with a cerebellar gray matter reference region. The choice of reference region will also affect the magnitude of SUVR levels. The pons is a hot region in 18F-flutemetamol scans, and consequently, normalizing against this region will give lower SUVRs than when cerebellar gray matter is used—a region with low 18F-flutemetamol uptake. Whole cerebellum includes both cold and hot areas, giving SUVRs that are in between SUVRs normalized to pons and cerebellar gray matter.
There were only small differences in results for the different composite regions, both for the comparison with histopathology and for the comparison with visual read results. Results in categorization of the data were almost identical for the small and narrow composite regions but were only slightly inferior for the large composite region (Tables 1 and 2) despite the fact that the composite regions sample quite different areas of the brain (Fig. 1). However, the magnitude of SUVR levels, and hence also the optimal SUVR threshold, vary not only across different reference regions but also across different target regions. The small composite region samples mainly areas where the highest SUVR is expected to be found in amyloid β–positive subjects, whereas the narrow and large composite regions cover larger parts of the neocortex, the difference being that the narrow composite region samples a thin strip of the cortex whereas the large composite region samples most of the cortex and the latter will hence be more affected by partial-volume effects. Therefore, it is expected that SUVRs, and therefore also the SUVR threshold, should be higher for the small composite region than for the large composite region, with the narrow composite region falling in between; this expectation is in agreement with our results (Table 1).
An interesting finding was that our thresholds for the cerebellar gray matter reference region are close to thresholds obtained with a different, previously reported method (7), and several publications for 11C-labeled Pittsburgh compound B have established SUVR thresholds that are close to 1.5 (11,12). However, although thresholds are similar across different analysis methods, they still vary and a correlation analysis between different methods is necessary for establishing how a threshold using one particular tracer or analysis method translates to a threshold using another tracer or method. This approach was used by Landau et al. (23), who compared 3 tracers and 2 analysis methods. Using correlation analysis between methods, a previously reported threshold for 18F-florbetapir of 1.11 (3) was first converted to 11C-labeled Pittsburgh compound B units and then to 18F-flutemetamol units (whole cerebellum normalization) yielding an 18F-flutemetamol threshold of 1.20, which is similar to the threshold of 1.23 reported for the large composite region (Table 1). Although conversion of SUVR thresholds across tracers and analysis methods can be done using correlation analysis, this is not an ideal approach for clinical routine use. A way to circumvent this problem is to define thresholds in terms of z scores, that is, number of SDs from the mean in a reference database of amyloid-negative controls. Our results showed that classification using a threshold corresponding to z = 2.0 gave essentially the same concordance with visual read results as when thresholds were defined on the basis of the autopsy cohort. Moreover, use of a threshold corresponding to z = 2.5 only marginally changed the results (Table 3). This finding supports the use of reference databases for flutemetamol in the same way as has previously been used for 18F-FDG (24).
CONCLUSION
Quantification of 18F-flutemetamol amyloid imaging data using an automated PET-only method and categorization of scans using an SUVR threshold derived from an autopsy cohort gave excellent concordance with majority visual read results. The use of pons as the reference region gave a slightly higher AUC and stronger concordance with visual read than did the use of whole cerebellum and cerebellar gray matter, but differences were small, indicating that all 3 reference regions are suitable for evaluation of 18F-flutemetamol PET scans.
DISCLOSURE
The costs of publication of this article were defrayed in part by the payment of page charges. Therefore, and solely to indicate this fact, this article is hereby marked “advertisement” in accordance with 18 USC section 1734. No potential conflict of interest relevant to this article was reported.
Footnotes
Published online Aug. 21, 2014.
- © 2014 by the Society of Nuclear Medicine and Molecular Imaging, Inc.
REFERENCES
- Received for publication April 30, 2014.
- Accepted for publication July 22, 2014.


Jump to section
Related Articles
Cited By...
- Hemispheric Asymmetry of Tau Pathology is Related to Asymmetric Amyloid Deposition in Alzheimers Disease
- Remote and unsupervised digital memory assessments can reliably detect cognitive impairment in Alzheimers disease
- The RSNA QIBA Profile for Amyloid PET as an Imaging Biomarker for Cerebral Amyloid Quantification
- Improving prediction of amyloid deposition in Mild Cognitive Impairment with a timed motor task
- Determining Amyloid-{beta} Positivity Using 18F-AZD4694 PET Imaging
- Patient-centered connectivity-based prediction of tau pathology spread in Alzheimers disease
- Biomarker Localization, Analysis, Visualization, Extraction, and Registration (BLAzER) Workflow for Research and Clinical Brain PET Applications
- Assessing Amyloid Pathology in Cognitively Normal Subjects Using 18F-Flutemetamol PET: Comparing Visual Reads and Quantitative Methods
- Cerebellar Amyloid-{beta} Plaques: How Frequent Are They, and Do They Influence 18F-Florbetaben SUV Ratios?
- Prevalence of Amyloid Positron Emission Tomographic Positivity in Poststroke Mild Cognitive Impairment
- Visualization and Quantification of 3-Dimensional Stereotactic Surface Projections for 18F-Flutemetamol PET Using Variable Depth