


Abstract
Amyloid-β deposition into plaques is a pathologic hallmark of Alzheimer disease appearing years before the onset of symptoms. Although cerebral amyloid-β deposition occurs on a continuum, dichotomization into positive and negative groups has advantages for diagnosis, clinical management, and population enrichment for clinical trials. 18F-AZD4694 (also known as 18F-NAV4694) is an amyloid-β imaging ligand with high affinity for amyloid-β plaques. Despite being used in multiple academic centers, no studies have assessed a quantitative cutoff for amyloid-β positivity using 18F-AZD4694 PET. Methods: We assessed 176 individuals [young adults (n = 22), cognitively unimpaired elderly (n = 89), and cognitively impaired (n = 65)] who underwent amyloid-β PET with 18F-AZD4694, lumbar puncture, structural MRI, and genotyping for APOEε4. 18F-AZD4694 values were normalized using the cerebellar gray matter as a reference region. We compared 5 methods for deriving a quantitative threshold for 18F-AZD4694 PET positivity: comparison with young-control SUV ratios (SUVRs), receiver-operating-characteristic (ROC) curves based on clinical classification of cognitively unimpaired elderly versus Alzheimer disease dementia, ROC curves based on visual Aβ-positive/Aβ-negative classification, gaussian mixture modeling, and comparison with cerebrospinal fluid measures of amyloid-β, specifically the Aβ42/Aβ40 ratio. Results: We observed good convergence among the 4 methods: ROC curves based on visual classification (optimal cut point, 1.55 SUVR), ROC curves based on clinical classification (optimal cut point, 1.56 SUVR) gaussian mixture modeling (optimal cut point, 1.55 SUVR), and comparison with cerebrospinal fluid measures of amyloid-β (optimal cut point, 1.51 SUVR). Means and 2 SDs from young controls resulted in a lower threshold (1.33 SUVR) that did not agree with the other methods and labeled most elderly individuals as Aβ-positive. Conclusion: Good convergence was obtained among several methods for determining an optimal cutoff for 18F-AZD4694 PET positivity. Despite conceptual and analytic idiosyncrasies linked with dichotomization of continuous variables, an 18F-AZD4694 threshold of 1.55 SUVR had reliable discriminative accuracy. Although clinical use of amyloid PET is currently by visual inspection of scans, quantitative thresholds may be helpful to arbitrate disagreement among raters or in borderline cases.
The advent of amyloid-β imaging using PET (1) and cerebrospinal fluid (CSF) measurements of amyloid-β (2,3) have revolutionized the field of Alzheimer disease (AD) research. Longitudinal amyloid PET imaging studies of autosomal-dominant (4) and sporadic (5) AD provide evidence that amyloid-β pathology accumulates many years before the onset of cognitive symptoms, suggesting that semiquantification of amyloid-β plaques in vivo permits the early identification of Alzheimer pathologic change (6). Although brain amyloid-β deposition occurs on a continuum (7), stratification of populations using amyloid-β levels is critical for diagnosing AD, assessing clinicopathologic changes associated with amyloid-β, and selecting individuals to test disease-modifying therapies.
With amyloid PET increasingly incorporated into clinical care (8), recent multicenter studies have provided evidence that amyloid PET positivity is associated with changes in the clinical management of individuals who are cognitively impaired (CI) (9). Furthermore, amyloid PET positivity is frequently used as an enrollment criterion for AD clinical trials (10), with continuous measures used to monitor target engagement (11,12). Although visual reading of amyloid PET scans is commonly used in dichotomization of amyloid PET images (9,13), this method has important limitations (14,15). Defining quantitative thresholds may add information to visual reads that may facilitate classification of visually borderline cases.
18F-AZD4694 is a high-affinity (equilibrium dissociation constant [Kd], 2.3 nM) (16) radioligand for imaging amyloid-β plaques that display lower white matter binding than other fluorinated amyloid PET tracers (17,18), enabling easier visual reads. 18F-AZD4694 is a fluorinated amyloid-β imaging compound structurally resembling 11C-Pittsburgh compound B (PiB) (18). Its radioactive half-life of 110 min enables centralized production with the potential for widespread clinical use. In this study, we aimed to further describe 18F-AZD4694 by determining a quantitative threshold for amyloid-β positivity with 18F-AZD4694 PET using multiple approaches.
MATERIALS AND METHODS
Participants
We assessed young adults (n = 22), cognitively unimpaired (CU) elderly (n = 89), and CI (n = 65) subjects who underwent amyloid-β PET with 18F-AZD4694, lumbar puncture, structural MRI, and genotyping for APOEε4. All individuals in this study were part of the Translational Biomarkers in Aging and Dementia (TRIAD) cohort (19), a longitudinal imaging and biofluid cohort study of aging and neurodegenerative diseases. Evaluations of participants included a review of their medical history and an interview with the participant and the participant’s study partner, a neurologic examination by a physician, and a neuropsychologic examination. Participants were assigned a diagnosis of CU (defined as not mild cognitive impairment [MCI] or AD dementia (20)), MCI (21), or AD dementia (22) using established clinical criteria. Individuals with MCI or AD dementia were classified as CI. Within the CI group, 32 individuals had a diagnosis of MCI and 33 had a diagnosis of AD dementia. All subjects underwent detailed clinical assessments, including neurologic and physical evaluation, Mini-Mental State Examination, Clinical Dementia Rating, and cerebrovascular disease risk. This study’s protocol was approved by McGill University’s Institutional Review Board, and informed written consent was obtained from each subject.
CSF Assays
CSF amyloid-β concentrations (Aβ40 and Aβ42) were measured using the fully automated Lumipulse G1200 instrument (Fujirebio) according to procedures from the manufacturer. Lumipulse measured Aβ42 and Aβ40 using antibody-coated beads for capture and monoclonal antibodies for detection (23). For analyses using CSF measurements, we compared 18F-AZD4694 SUV ratio (SUVR) with the Aβ42/Aβ40 ratio (Aβ42 concentrations normalized to concentrations of the 40-amino-acid–long form of amyloid-β [Aβ40]), as a recent review provided substantial evidence that the Aβ42/Aβ40 ratio has superior diagnostic performance (lower false-positive and lower false-negative rates) (24). Furthermore, the Aβ42/Aβ40 ratio displays higher correspondence with amyloid PET than do measures of Aβ42 alone (25). Amyloid-β positivity on CSF was based on a published cutoff of a Aβ42/Aβ40 ratio of 0.068 from the Lumipulse assay (23).
PET Image Acquisition and Processing
Radiosynthesis of 18F-AZD4694 is described in the supplemental materials and represented in Supplemental Figure 1 (supplemental materials are available at http://jnm.snmjournals.org). PET acquisition and processing have been described previously (19). 18F-AZD4694 images were acquired 40–70 min after injection, and scans were reconstructed with the ordered-subset expectation maximization algorithm on a 4-dimensional volume with 3 frames (3 × 600 s). T1-weighted images were acquired on a 3-T Siemens Magnetom using a standard head coil. A magnetization-prepared rapid-gradient-echo MRI sequence was used to obtain a high-resolution T1-weighted anatomic image of the entire brain. T1-weighted images were nonuniformity-corrected and field-distortion–corrected and processed using an in-house pipeline. Then, PET images were automatically registered to the T1-weighted image space, and the T1-weighted images were linearly and nonlinearly registered to the Alzheimer’s Disease Neuroimaging Initiative (ADNI) template space, which is a stereotactic template based on the brains of CU elderly, MCI, and AD dementia individuals and performs better than the MNI152 template for image registration in neuroimaging studies of aging and dementia (26). Subsequently, a PET nonlinear registration was performed using the linear and nonlinear transformations from the T1-weighted image to the ADNI space and the PET–to–T1-weighted image registration. The PET images were spatially smoothed to achieve a final resolution of 8 mm in full width at half maximum. All images were visually inspected to ensure proper alignment to the ADNI template. 18F-AZD4694 SUVR maps were generated using the cerebellar gray matter as a reference region. Partial-volume correction (PVC) was performed using previously described methods (19); all analyses were repeated using PVC data.
A global 18F-AZD4694 SUVR was estimated for each participant by averaging the SUVRs from the precuneus, prefrontal, orbitofrontal, parietal, temporal, anterior, and posterior cingulate cortices (7). Visual assessment of 18F-AZD4694 PET scans was defined by the consensus of 2 neurologists masked to the clinical diagnosis as described previously (27).
Statistical Analyses
Baseline demographics were assessed using multiple t tests and χ2 tests using the R Statistical Software Package, version 3.3 (http://www.r-project.org/). We used 5 analytic methods to derive a quantitative cutoff for 18F-AZD4694 SUVR. The first was 2 SDs above the mean of a reference group of CU young adults (7,28). The second was area under the receiver-operating-characteristic (ROC) curve (AUC) comparing CU elderly and AD dementia subjects (29). The third was AUC comparing visually amyloid-negative and visually amyloid-positive scans. The fourth was gaussian mixture modeling (30). The fifth was comparisons of the AUC with CSF measurements of amyloid-β (31). Because existing evidence does not support differences in amyloid PET uptake between men and women (32), we did not correct analyses for sex. A single threshold of abnormality was applied to both sexes. We chose to determine a single threshold for amyloid PET positivity and not one that differs according to a subject’s age. Higher thresholds in older individuals could result in falsely identifying these individuals as negative.
For ROC analyses, we determined sensitivity and specificity for various cutoffs and optimal threshold. The optimal threshold was calculated using the least distance from a point to the ROC curve (0,1; best operating point) contrasting AD dementia versus CU elderly groups, visually positive versus visually negative groups, and CSF-negative versus CSF-positive groups. This provides the best trade-off between sensitivity and specificity for differentiating between 2 dichotomous categories. We chose to contrast visually positive versus visually negative cases in addition to CU elderly versus AD dementia for two reasons: the first is that postmortem evaluations consistently show that CU elderly individuals frequently present with elevated amyloid-β pathology at levels that are indistinguishable from individuals with AD dementia (33,34), and the second is that a substantial portion of clinically diagnosed AD dementia individuals do not display amyloid-β pathology on postmortem evaluation (35). Thus, defining cut-points on the basis of individuals who do or do not meet specific clinical criteria bears conceptual limitations (7). Concordance with visual reads has also been used for threshold validation of other fluorinated amyloid PET radioligands (36).
RESULTS
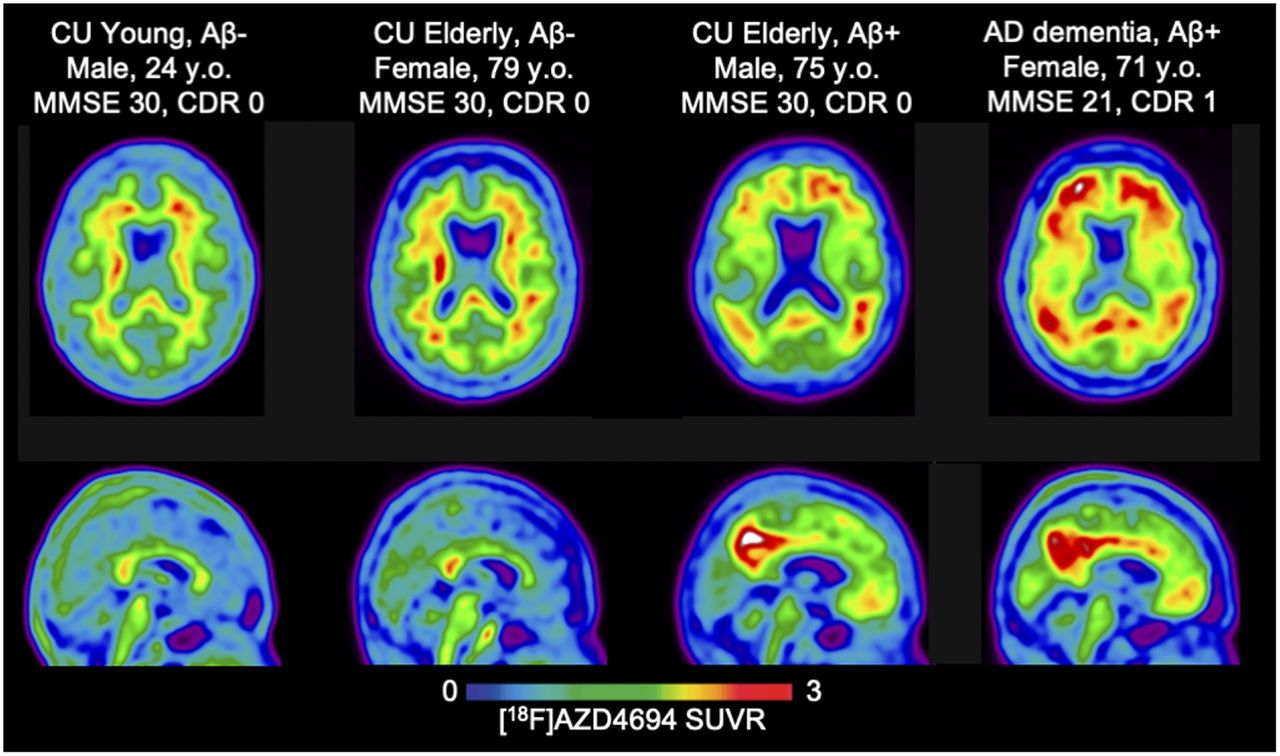
Demographic and clinical information is summarized in Table 1. We observed significant differences in amyloid PET ligand uptake across groups, with CI individuals showing the highest, followed by CU elderly, and with young individuals presenting with low amyloid-β ligand uptake. We observed a similar pattern for CSF measures of Aβ42/Aβ40 ratios. CI individuals were more likely to be APOEε4 carriers. Figure 1 displays 4 18F-AZD4694 PET scans, representing the range of 18F-AZD4694 SUVR: 1 young adult, a CU elderly amyloid-β–negative individual, a CU elderly amyloid-β–positive individual, and an amyloid-β–positive AD dementia individual. In our sample, 0% of young individuals, 29% of CU elderly individuals, and 72% of CI individuals were deemed 18F-AZD4694 PET–positive on visual assessment.
Demographic, Clinical, and Biomarker Characteristics of Sample

Transaxial (top) and midsagittal (bottom) representative 18F-AZD4694 SUVR PET images of 4 subjects representing range of binding patterns in present study. All images are presented in template space. MNI coordinates: x = 2, y = −59, z = 15. CDR = Clinical Dementia Rating; MMSE = Mini-Mental State Examination.
Means and SDs from the CU young adults (n = 22), compared with the CU elderly and CI groups, are displayed in Figure 2. CU young individuals displayed low 18F-AZD4694 PET uptake (mean, 1.14) and low SDs (SD, 0.09). The mean + 2 SDs of 18F-AZD4694 PET SUVR from the CU young individuals was 1.33, displayed as the dashed line in Figure 2 (PVC data are presented in Supplemental Fig. 2).
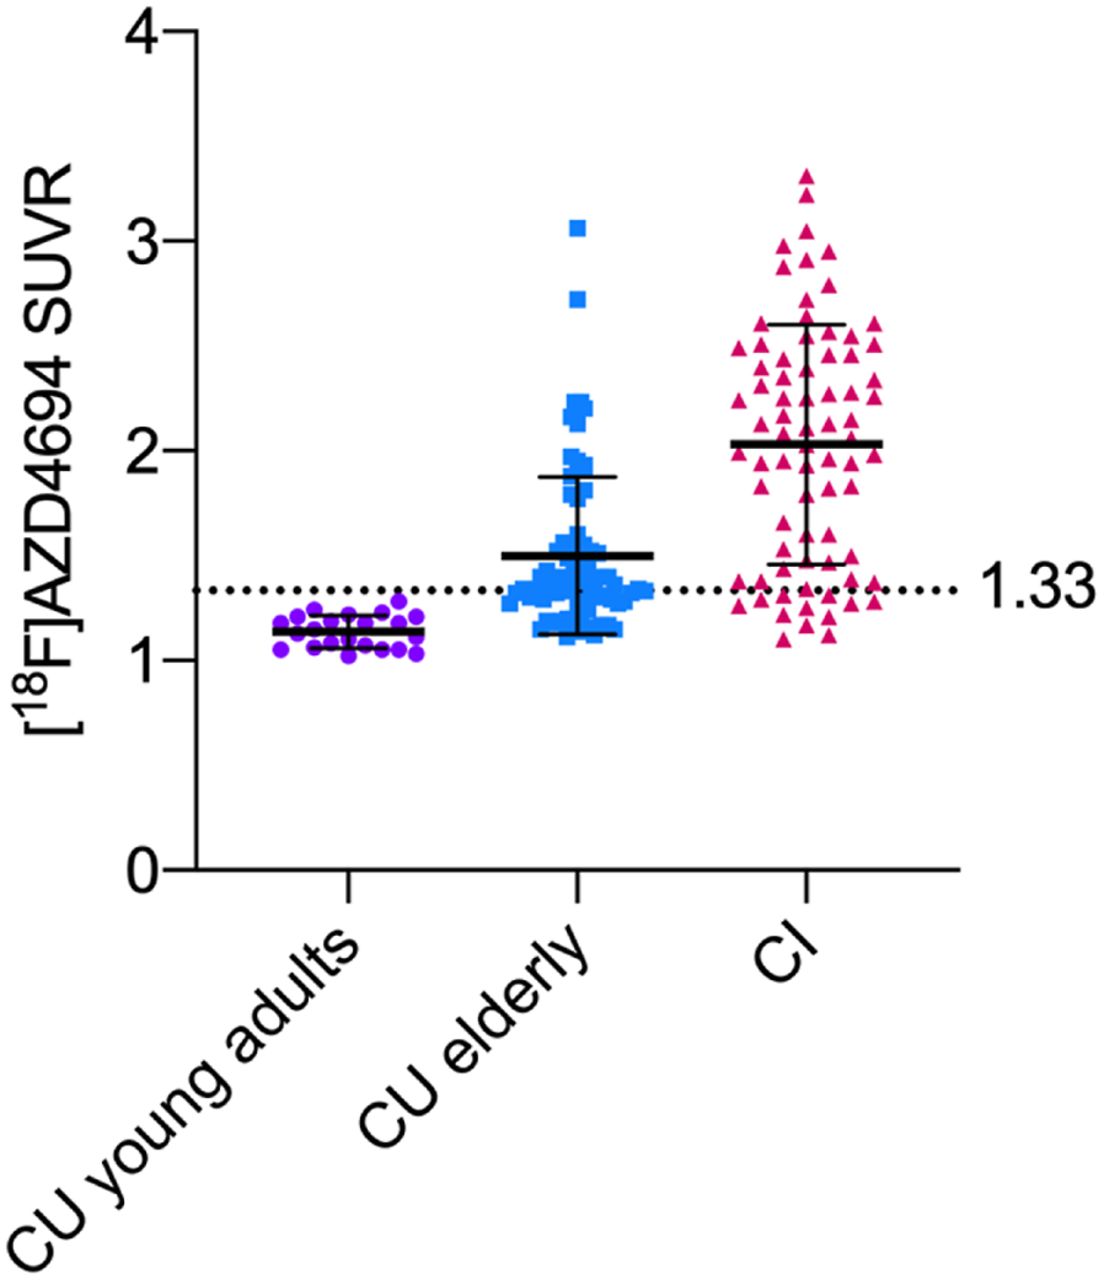
Means and SDs (error bars) in 18F-AZD4694 PET SUVR for CU young adults (age < 25 y), CU elderly, and CI groups. Young adults displayed minimal amyloid PET uptake (mean, 1.14; SD, 0.09). Dashed line represents 2 SDs above mean of young adults, at 1.33 18F-AZD4694 SUVR.
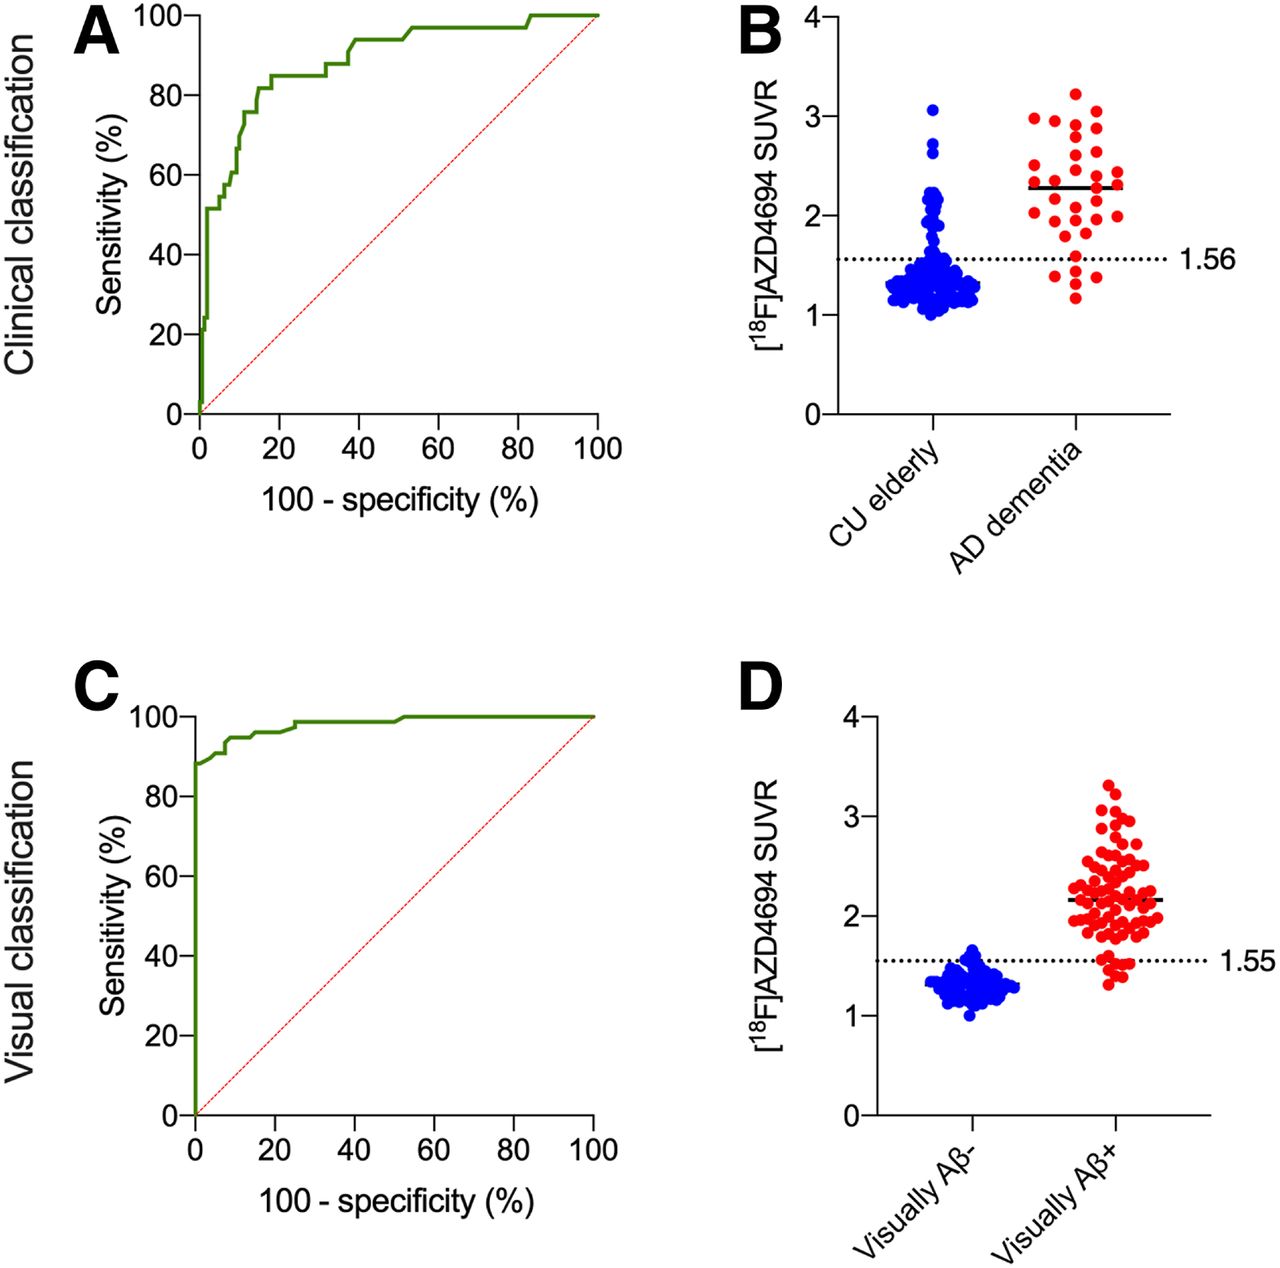
Figure 3 displays ROC curves used to determine the quantitative threshold that best agreed with clinical diagnosis and that best agreed with visual assessment from trained raters. When contrasting CU elderly with AD dementia groups, we observed a good AUC (82.5%; sensitivity, 85%; specificity, 73%). The optimal threshold at this point was 1.56 SUVR. When contrasting visually Aβ-positive versus Aβ-negative groups, we observed an excellent AUC (97%; sensitivity, 91%; specificity, 95%). The optimal threshold at this point was 1.55 SUVR. These thresholds were similar when using PVC data (Supplemental Fig. 3). When contrasting only visually Aβ-negative CU elderly versus visually Aβ-positive AD dementia individuals, the optimal threshold was 1.58 SUVR (Supplemental Fig. 4).

ROC curves contrasting visually positive vs. negative cases. (A) When contrasting CU elderly with AD dementia groups, we observed good AUC (82.5%; sensitivity, 85%; specificity, 73%). (B) Optimal threshold at this point was 1.56 SUVR, represented by dashed line. (C) Area under ROC curve contrasting visually negative vs. visually positive cases displayed excellent AUC (97%; sensitivity, 90.91%; specificity, 95%). (D) 18F-AZD4694 PET means are shown for visually positive (red) and visually negative (blue) groups, with dashed line representing optimal threshold derived from ROC curve (1.55 SUVR).
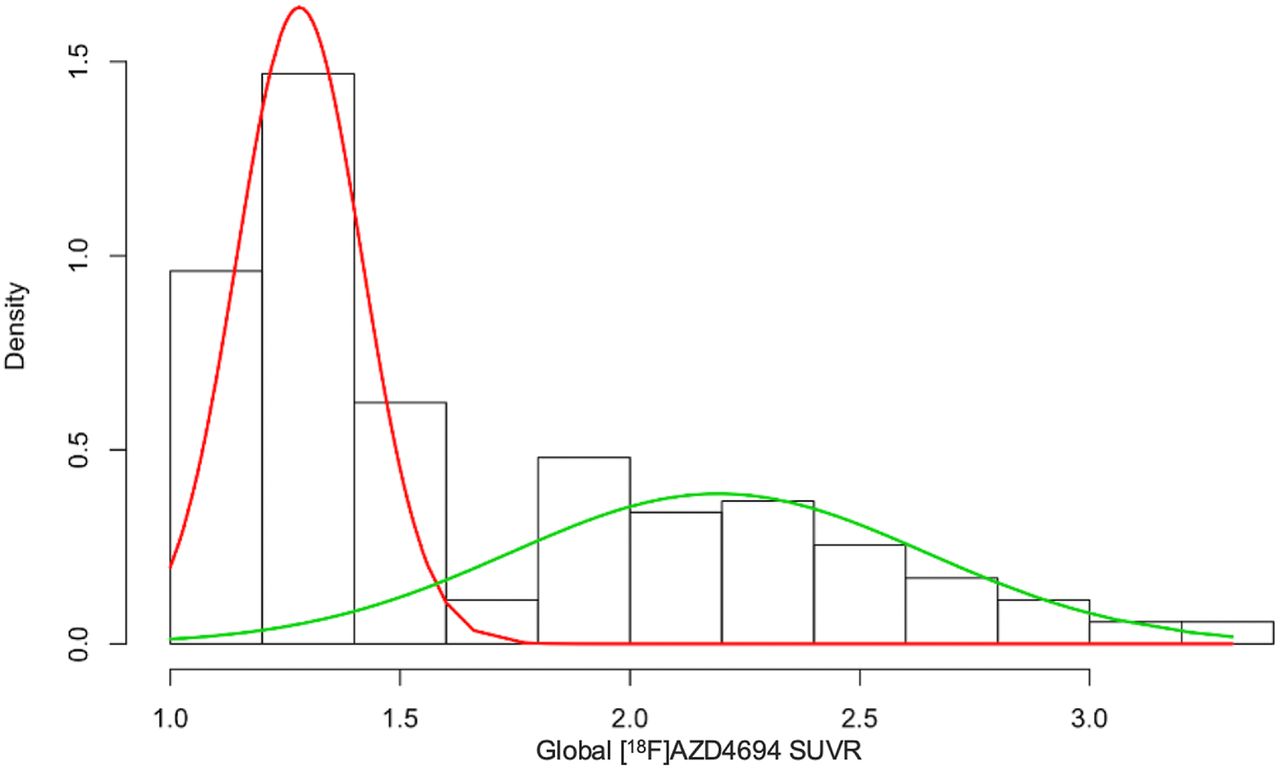
When using gaussian mixture modeling, we derived 2 components, one corresponding to low–amyloid-β individuals (mean, 1.28; SD, 0.136) and one to high–amyloid-β individuals (mean, 2.19; SD, 0.45) (Fig. 4). The optimal cutoff from gaussian mixture modeling was 1.55 SUVR. Gaussian mixture modeling using PVC data gave similar results (Supplemental Fig. 5). When including the CU young adults in the gaussian mixture modeling analysis, we observed a similar threshold of 1.54 SUVR (Supplemental Fig. 6).

Gaussian mixture modeling representing 2 distributions. Low 18F-AZD4694 (red) and high 18F-AZD4694 (green) gaussian distributions are superimposed on subject density histogram for all 18F-AZD4694 PET SUVRs from CU elderly and CI populations. Optimal cut point from gaussian mixture modeling was 1.55 SUVR.
We assessed correspondence between CSF amyloid positivity based on a Aβ42/Aβ40 ratio of 0.068 (Fig. 5). The optimal 18F-AZD4694 threshold was 1.51, represented by the dashed line (AUC, 95%; sensitivity, 88.9%; specificity, 91.4%). This threshold was similar when using PVC data (Supplemental Fig. 7). Supplemental Table 1 summarizes the thresholds obtained from all methods, along with the percentage of the CU elderly population who would be labeled amyloid-β–positive according to each method.
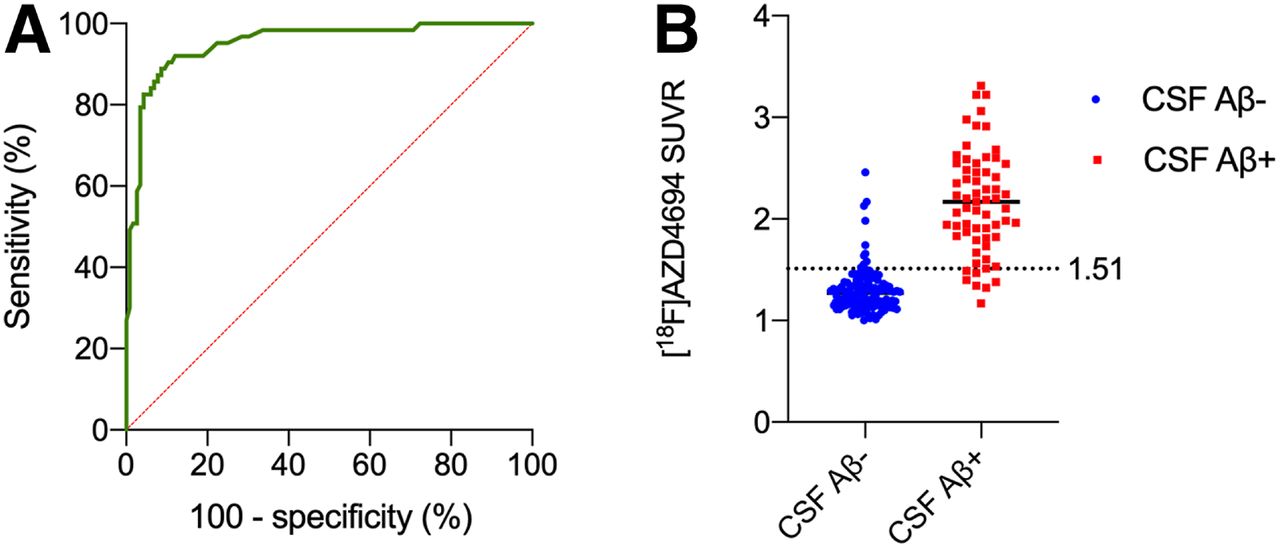
ROC curves contrasting CSF-positive vs. -negative individuals. (A) Area under ROC curve contrasting individuals dichotomized on basis of their cerebrospinal measure of Aβ42/Aβ40 ratio. This method resulted in area under ROC curve of 95% (sensitivity, 88.9%; specificity, 91.4%). (B) AZD4694 PET means are shown for CSF-negative (blue) and CSF-positive (red) individuals, with dashed line representing optimal threshold derived from ROC curve (1.51 SUVR).
DISCUSSION
In this study, we present evidence from converging analytic and biomarker techniques for an 18F-AZD4694 PET threshold for amyloid-β positivity. We observed convergent results from CSF measurements of amyloid positivity, gaussian mixture modeling, and ROC curve analyses, all pointing to an optimal SUVR of 1.55.
All methods to dichotomize continuous measures invariably lead to several conceptual and analytic idiosyncrasies with respect to the threshold for classification. To help address this issue, we used multiple analytic methods as well as validation with CSF measurements of amyloid-β. The first of these methods, using the mean +2 SDs of CU young adults, resulted in an 18F-AZD4694 SUVR threshold of 1.33. Using this threshold, over 50% of our CU elderly population would be amyloid-β–positive, which does not agree with observations from postmortem studies of amyloid-β pathology (33). Other groups applying mean +2 SDs using 11C-PiB have also found it to be unsuitable (7), potentially because of age-related nonspecific uptake (37). When using ROC curves contrasting CU elderly with AD dementia groups, we observed an optimal threshold of 1.56 SUVR. When using ROC curves contrasting visually negative versus visually positive cases, we observed an optimal threshold of 1.55 SUVR. Gaussian mixture modeling produced an identical threshold of 1.55 SUVR separating low–18F-AZD4694 from high–18F-AZD4694 groups. Finally, the threshold derived from CSF (1.51) was slightly lower than the ROC and gaussian mixture modeling methods using PET data, possibly indicating that CSF amyloid-β becomes abnormal before amyloid PET (38). Taken together, we chose a cutoff of 1.55 SUVR for 3 reasons: because the goal of this study was to define a quantitative threshold for amyloid PET positivity (in contrast to CSF positivity), because there is agreement between both ROC and gaussian mixture modeling methods, and because longitudinal studies indicate that patients who are CSF-positive/PET-negative have a better prognosis over 5 y than do CSF-positive/PET-positive patients, indicating amyloid PET positivity has greater specificity for AD-related cognitive decline and biomarker changes (39).
Although a cutoff of 1.55 SUVR is higher than published cutoffs for other fluorinated amyloid PET radioligands, it is important to consider that 18F-AZD4694 displays a higher Bmax (concentration of available binding sites)/Kd ratio than other fluorinated amyloid PET radioligands (16). Furthermore, whereas 18F-AZD4694 is structurally similar to 11C-PiB (18) and has a similar Kd (11C-PiB Kd = 1–2 nM (40)), the longer scanning time and longer radioactive half-life of 18F-AZD4694 result in higher counts, likely underlying the slightly higher SUVR threshold for positivity reported in our study compared with 11C-PiB thresholds (7,41). This is consistent with head-to-head studies between 11C-PiB and 18F-AZD4694 providing evidence that 18F-AZD4694 has a slightly larger effect-size difference in binding between CU and AD individuals (18).
Visual reads of amyloid PET scans are most commonly used in clinical settings (9) to help account for differences in PET acquisition protocols, processing methods, or binding properties of individual radioligands. Limitations of visual ratings include inter-rater reliability, the need for expert raters, and lack of standardization for rating methods across radiotracers (14). Although quantitative measurements have their utility in research settings, they may also be clinically helpful in resolving cases of discordance between raters, helping centers with less expertise (14), or when a scan appears borderline (42). Furthermore, with potential disease-modifying therapies on the horizon, the need for quantitative or semiquantitative measurements of amyloid-β load during follow-up of patients treated in a clinical environment will clearly be present.
In vivo semiquantification of amyloid-β pathology using PET has enabled a multitude of new possibilities for the field of AD, including establishing core biomarker models (4,5) and guiding clinical trial design (10). Although most research has focused on dichotomous classification of amyloid PET imaging into positive and negative groups, the spatial resolution of PET provides the opportunity for staging of amyloid PET (43). Staging systems may provide additional information by leveraging the topographic distribution of amyloid PET uptake, which may aid in patient monitoring during the course of AD. Although our study was not designed to assess regional patterns of amyloid-β accumulation, region-specific approaches may have increased sensitivity as compared with global measures, provided they are replicable.
It is important to consider that the TRIAD cohort constitutes a sample with a significantly higher proportion of AD and MCI individuals than found in the general population. Furthermore, like several longitudinal prospective cohort studies, our study was enriched for APOEε4 carriers (44), who are at risk of becoming amyloid-positive before APOEε4 noncarriers. Finally, all 18F-AZD4694 PET scans in this study were acquired on a brain-dedicated High Resolution Research Tomograph (HRRT) PET camera. Thus, the threshold from our sample may potentially differ from other prospective longitudinal cohort studies of aging and dementia. Correspondingly, the threshold of 1.55 SUVR is not intended to be applied in other centers without validation with respect to local PET acquisition and processing methods.
Our results should be considered in the context of several limitations. Because there is not yet a large database of longitudinal 18F-AZD4694 PET data, we were not able to make calculations based on the reliable-worsening method, which identifies the value at which that biomarker reliably changes (7). A second limitation is the use of static scans with SUVR as an outcome measure: this introduces potential limitations due to individual differences in tracer brain delivery and washout compared with dynamic PET and nondisplaceable binding potential as an outcome measure (45), though kinetic analyses of other fluorinated amyloid PET ligands report that these effects are small (46). Recent studies have also reported that SUVR overestimates true 18F-florbetapir binding (47). It is also important to consider that when used by experienced observers, SUVR maps result in more discordant case reads than do nondisplaceable-binding-potential maps (15). Third, a large autopsy series was not available for our cohort, thus precluding comparison of our threshold with gold standard autopsy methods. To the best of our knowledge, existing ex vivo studies with 18F-AZD4694 are restricted to autoradiographic evaluations of this radiotracer (16). Future case-to-autopsy studies are needed to determine the degree of correspondence between 18F-AZD4694 PET positivity and neuropathologic criteria. Finally, future studies are needed to validate the associations between 18F-AZD4694 PET positivity and longitudinal cognitive decline.
CONCLUSION
We provide convergent evidence from multiple analytic methods pointing to an 18F-AZD4694 SUVR threshold of 1.55 for determining amyloid-β positivity. Given the increasing use of dichotomized amyloid PET results in clinical care (8,9), a quantitative threshold may provide clinicians with additional information to help in discordant or borderline cases.
DISCLOSURE
Joseph Therriault is funded by McGill University’s Faculty of Medicine Scholarship. This work is supported by the Canadian Institutes of Health Research (CIHR) (MOP-11-51-3), the Alzheimer’s Association (NIRG-12-92090, NIRP-12-259245), and Fonds de Recherche du Québec–Santé (Chercheur Boursier and 2020-VICO-279314). Henrik Zetterberg is a Wallenberg Scholar supported by grants from the Swedish Research Council (2018-02532), the European Research Council (681712), Swedish State Support for Clinical Research (ALFGBG-720931), the Alzheimer Drug Discovery Foundation (ADDF) (201809-2016862), and the UK Dementia Research Institute at UCL. Kaj Blennow is supported by the Swedish Research Council (2017-00915), the Alzheimer Drug Discovery Foundation (ADDF) (RDAPB-201809-2016615), the Swedish Alzheimer Foundation (AF-742881) (FO2017-0243), the Swedish state under the agreement between the Swedish government and the County Councils, the ALF-agreement (ALFGBG-715986), and the European Union Joint Program for Neurodegenerative Disorders (JPND2019-466-236). No other potential conflict of interest relevant to this article was reported.
KEY POINTS
QUESTION: What is the quantitative threshold for determining amyloid positivity using the high-affinity radioligand 18F-AZD4694?
PERTINENT FINDINGS: We observed converging evidence from multiple analytic methods that an 18F-AZD4694 threshold of 1.55 SUVR is optimal for determining amyloid positivity.
IMPLICATIONS FOR PATIENT CARE: With amyloid PET in clinical contexts approaching, quantitative thresholds may be helpful for arbitrating disagreement among raters or classifying borderline cases.
Footnotes
Published online Jul. 31, 2020.
- © 2021 by the Society of Nuclear Medicine and Molecular Imaging.
REFERENCES
- Received for publication March 13, 2020.
- Accepted for publication June 10, 2020.


Jump to section
Related Articles
Cited By...
- Transcriptomic signatures of A{beta}- and tau-induced neuronal dysfunction reveal inflammatory processes at the core of Alzheimers disease pathophysiology
- Diagnostic accuracy of the plasma ALZpath pTau217 immunoassay to identify Alzheimers disease pathology
- The Association of Age-Related and Off-Target Retention with Longitudinal Quantification of [18F]MK6240 Tau PET in Target Regions
- Revealing the combined roles of A{beta} and tau in Alzheimers disease via a pathophysiological activity decoder
- Performance of plasma amyloid, tau, and astrocyte biomarkers to identify cerebral AD pathophysiology
- Astrocyte biomarker signatures of amyloid-{beta} and tau pathologies in Alzheimers disease