


Abstract
The availability of new PET ligands offers the potential to measure fibrillar β-amyloid in the brain. Nevertheless, physiologic information in the form of perfusion or metabolism may still be useful in differentiating causes of dementia during life. In this study, we investigated whether early 11C-Pittsburgh compound B (11C-PIB) PET frames (perfusion 11C-PIB [pPIB]) could provide information equivalent to blood flow and metabolism. First, we assessed the similarity of pPIB and 18F-FDG PET images in a test cohort with various clinical diagnoses (n = 10), and then we validated the results in a cohort of patients with Alzheimer disease (AD) (n = 42; mean age ± SD, 66.6 ± 10.6 y; mean Mini-Mental State Examination [MMSE] score ± SD, 22.2 ± 6.0) or frontotemporal lobar degeneration (FTLD) (n = 31; age ± SD, 63.9 ± 7.1 y, mean MMSE score ± SD, 23.8 ± 6.7). Methods: To identify the 11C-PIB frames best representing perfusion, we ran on a test cohort an iterative algorithm, including generating normalized (cerebellar reference) perfusion pPIB images across variable frame ranges and calculating Pearson R values of the sum of these pPIB frames with the sum of all 18F-FDG frames (cerebellar normalized) for all brain tissue voxels. Once this perfusion frame range was determined on the test cohort, it was then validated on an extended cohort and the power of pPIB in differential diagnosis was compared with 18F-FDG by performing a logistic regression of regions-of-interest tracer measure (pPIB or 18F-FDG) versus diagnosis. Results: A 7-min window, corresponding to minutes 1–8 (frames 5–15), produced the highest voxelwise correlation between 18F-FDG and pPIB (R = 0.78 ± 0.05). This pPIB frame range was further validated on the extended AD and FTLD cohort across 12 regions of interest (R = 0.91 ± 0.09). A logistic model using pPIB was able to classify 90.5% of the AD and 83.9% of the FTLD patients correctly. Using 18F-FDG, we correctly classified 88.1% of AD and 83.9% of FTLD patients. The temporal pole and temporal neocortex were significant discriminators (P < 0.05) in both models, whereas in the model with pPIB the frontal region was also significant. Conclusion: The high correlation between pPIB and 18F-FDG measures and their comparable performance in differential diagnosis are promising in providing functional information using 11C-PIB PET data. This approach could be useful, obviating 18F-FDG scans when longer-lived amyloid imaging agents become available.
PET has been a useful tool in the study of clinical and basic aspects of dementia. For example, 18F-FDG is especially useful in differentiating frontotemporal lobar degeneration (FTLD), often characterized by hypometabolism in frontal and temporal lobes, from Alzheimer disease (AD), marked by parietal and temporal hypometabolism that is related to dementia severity ( 1– 3).
11C-Pittsburgh compound B (11C-PIB) ( 4), a relatively new radiotracer that binds to fibrillar Aβ-amyloid plaques, has been used to characterize AD and differentiate it from FTLD, which is not characterized by β-amyloid plaques ( 5– 7). The recent introduction of 18F amyloid ligands makes this approach clinically viable ( 8– 10). 11C-PIB PET can estimate regional Aβ-amyloid and is generally quantified by either a binding potential or a distribution volume ratio ( 11) using the Logan reversible kinetic model and a cerebellar reference region or by standardized uptake value ratios, which are tissue activity ratios at later times after injection similar to the approach taken with 18F-FDG ( 12). These approaches are reduced from more complex compartmental models that have been investigated using arterial input functions and dynamic PET data ( 13). In both 3-tissue, 6-parameter, and 2-tissue, 4-parameter, models, the term K1 represents transport across the blood–brain barrier, which is proportional to flow and tracer extraction. In simplified models that use a reference tissue in place of an arterial input function (simplified reference tissue model), the term R1 represents the ratio of K1 in the target to K1 in reference tissue ( 14). Thus, perfusion information is available from these models in the form of K1 information. Early PET frames have been used with other tracers to estimate K1 and thus, indirectly, perfusion ( 15).
A correlation between metabolism and cerebral perfusion has been long established in healthy older individuals and those with degenerative dementias, likely because reduced metabolic demand is coupled to reduced perfusion ( 16). Values of K1 obtained with PIB have also been found to represent the unidirectional influx of the 11C-PIB tracer in the brain and are related to perfusion ( 17). We would therefore expect to find a correlation between perfusion data from early PIB frames, which we term perfusion 11C-PIB (pPIB), and metabolic data from 18F-FDG. Thus 11C-PIB PET can potentially provide 2 kinds of information: perfusion pPIB, obtained from early time frames (which gives a measure comparable to regional metabolism), and distribution volume ratio or binding potential, obtained from later time frames (which gives a measure of regional fibrillar Aβ-amyloid plaques).
In this report, we specifically examined 2 etiologies of dementia, AD and FTLD, because of their different pathologic substrates, clinical features, and metabolic patterns as revealed with 18F-FDG. Research suggests 18F-FDG PET may approach the accuracy of clinical diagnosis and may provide information additional to that obtained with a clinical examination ( 18, 19). These 2 disorders thus provide a method for the evaluation of pPIB as a potential clinical tool that could have application to a variety of different dementing illnesses at different stages. For example, combining pPIB with amyloid measurements could be particularly useful in the clinical evaluation of patients with mild cognitive impairment in situations for which PIB scans might be borderline or equivocal or in situations when amyloid imaging results are negative but functional information might be informative. In addition, 18F-FDG scans provide information about disease stage and symptom severity ( 20), whereas PIB scans are not strongly related to symptoms either cross-sectionally or longitudinally ( 21, 22). Thus, early frames could be useful in assessing, for example, a treatment response in a clinical trial. The approach of using early PET frames of an amyloid imaging ligand in place of an 18F-FDG scan could become particularly useful with an 18F-labeled amyloid radiotracer, because such tracers would require subjects to return for a second day of scanning. Therefore, we investigated how early 11C-PIB scan data compared with 18F-FDG PET data in a group of subjects with AD and FTLD, because these 2 types of dementia have been best established as those most easily differentiated with 18F-FDG PET.
MATERIALS AND METHODS
We used a small testing cohort of subjects with a variety of dementias to determine the optimal time frame representing perfusion from the PIB data. This time frame was then validated on a larger cohort of AD and FTLD patients. Subsequently, a logistic regression model was used to test the utility of pPIB, compared with 18F-FDG, scans at discriminating these 2 distinct groups. Finally, a correlation was run between Mini-Mental State Examination (MMSE) scores and relevant regions in the 18F-FDG and pPIB scans for the AD and FTLD patients to determine relationships between cognition and these tracers.
Subjects and Image Acquisition
All subjects were recruited from the University of California San Francisco Memory and Aging Center ( 7). Patients were diagnosed using standard research criteria for AD ( 23) and FTLD ( 24).
Two cohorts, the test cohort (n = 10) and validation cohort (n = 73), were used in this study. Characteristics of the validation cohort are shown in Table 1. Subjects in the test cohort, compared with those in the validation cohort, had a unique set of clinical diagnoses: 2 subjects had amyloid angiopathy, 3 had corticobasal syndrome, 2 had dementia with Lewy bodies (DLB), 2 had mild cognitive impairment, and 1 had primary progressive aphasia. The average age of the test cohort was 66.4 ± 7.3 y, with an average education of 17.9 ± 3.9 y and an MMSE average score of 28 ± 1.8. There were 6 PIB-positive and 4 PIB-negative subjects, as determined by visual interpretation.
Validation Cohort Characteristics
All subjects underwent 11C-PIB and 18F-FDG PET at Lawrence Berkeley National Laboratory on an ECAT EXACT HR PET scanner (Siemens) in 3-dimensional acquisition mode. 11C-PIB tracer was synthesized in Lawrence Berkeley National Laboratory's Biomedical Isotope Facility using a previously published protocol ( 25). The 18F-FDG tracer was purchased from IBA Molecular Gilroy Pharmacy. Approximately 550 MBq of 11C-PIB were injected as a bolus into an antecubital vein. Dynamic frames were obtained with the following sequence: 4 × 25, 8 × 30, 9 × 60, 2 × 180, 8 × 300, and 3 × 600 s, for a total of 90 min. Two hours after the 11C-PIB injections, the patients were injected with approximately 370 MBq of 18F-FDG. Six emission frames of 5 min each were acquired beginning 30 min after the tracer injection.
Identification of Optimal pPIB Time Frame
The six 18F-FDG PET frames were realigned and summed using SPM8 (Wellcome Trust Centre for Neuroimaging) and segmented into 3 tissue classes: gray-matter, white-matter, and nonbrain probability images. This segmentation was done to improve the gray-matter mask of the template cerebellum. The image was then warped to the Montreal Neurologic Institute (MNI) standard space 15O-H2O PET template. A cerebellum reference region in MNI space was created by combining all the cerebellum regions from the automated anatomic labeling atlas ( 26). This cerebellum region was masked with each individual's PET-defined gray-matter mask (threshold at 0.0), and the mean value was used to intensity-normalize the volume on a voxelwise basis.
Using data from the 10 subjects in the testing cohort, we iteratively generated potential perfusion 11C-PIB (pPIB) images with the following processing approach. As an initial step, the 11C-PIB frames were aligned using a 2-pass approach, first to the sixth frame and then to the mean using SPM8. Because the first 5 frames have little signal, they were summed and aligned to the mean, and the parameters were then applied to the individual frames. At this stage, we used an iterative algorithm to generate potential pPIB data that represented the sums of different frame ranges.
-
The algorithm summed frames X–Y from the PIB scan (X and Y represent distinct time points in the scan protocol, for example, X = frame 1, Y = frame 6).
-
The summed image was segmented into gray-matter, white-matter, and nonbrain probability images. The gray-matter image was thresholded at 0.0 to generate a gray-matter mask.
-
The summed image was warped to the MNI standard space PET template (SPM8), and the derived warp parameters were applied to the gray-matter mask.
-
The same automated anatomic labeling template cerebellum reference region used with 18F-FDG was again used and masked with the individual subject's pPIB PET-derived gray-matter mask.
-
The mean value from this masked-cerebellum reference region was used to intensity-normalize the whole brain on a voxelwise basis.
-
A voxelwise correlation (Pearson R) was calculated between the pPIB (sum of frames X–Y) and the single 18F-FDG metabolism image for all brain tissue voxels greater than zero in the pPIB image. These correlations were used to define the optimal pPIB frame range and start time.
Validation of Optimal pPIB Time Frame
For subjects in the validation cohort, 18F-FDG and 11C-PIB (pPIB) images were processed identically to those in the test cohort, except that only the frames from the optimal pPIB were summed. This resulted in 2 images for each subject in the validation cohort, an 18F-FDG image measuring metabolism and a 11C-PIB (pPIB) image measuring perfusion.
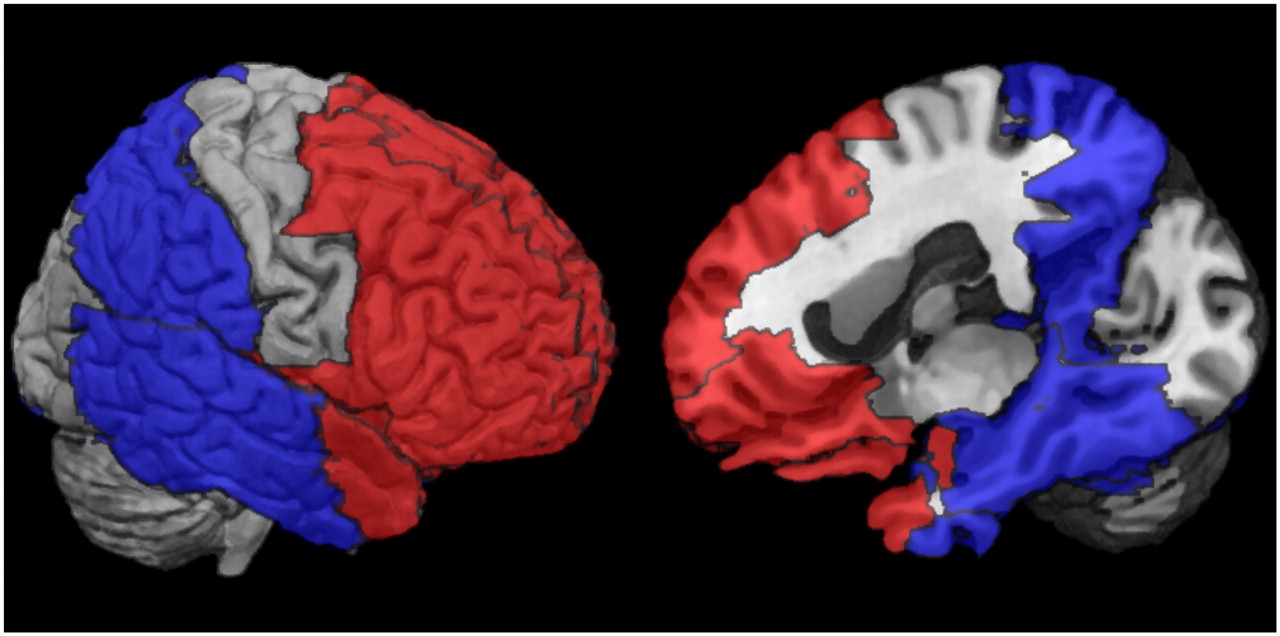
A within-subject voxelwise correlation (Pearson R) was calculated for the optimal pPIB image and the single 18F-FDG metabolism image for all brain tissue voxels greater than zero in the pPIB image. In addition, a set of regions of interest (ROIs) was selected to represent the regions that are potentially most involved in AD and FTLD. The software Pickatlas (Wake Forest University) ( 27) was used to define the ROIs with the automated anatomic labeling atlas ( 26). Twelve regions in the left and right hemispheres of 6 unique ROIs were selected and used to run within-subject correlations (Pearson R) to further validate regional similarities between pPIB and 18F-FDG. These ROIs are listed in Table 2 and depicted in Figure 1.
Definition of ROIs Used to Extract Mean Values from 18F-FDG and pPIB Images Used in Correlations and Logistic Regression Model for Each Subject

ROIs used in correlations and logistic regression models. Red regions represent collective ROIs that are affected by FTLD, and blue regions represent collective ROIs that are affected by AD.
Statistical Analysis
To assess the similarity of pPIB to 18F-FDG in a clinically relevant situation, classification was determined using logistic regression software to compare the ability of each tracer to discriminate between AD and FTLD (STATA 10 [StataCorp. LP] for Mac [Apple]). The logistic regression model, regressing diagnosis (AD or FTLD) versus ROI radiotracer concentration (the original 12 bilateral ROIs were combined, resulting in 6 whole brain ROIs), was performed once on pPIB data and once on 18F-FDG data. The classification power using each radiotracer was computed and compared. The goal was not to assess diagnostic accuracy for these diseases but to compare the performance of the pPIB and 18F-FDG data in classification.
RESULTS
Identification of Optimal pPIB Time Frame
Figure 2 shows the results of voxelwise correlation of 18F-FDG with pPIB for various frame ranges. The correlation data show a dip in the initial frames and for short cumulative sums, a prolonged plateau for cumulative sums of around 6 to 10 min, and then a gradual decrease for cumulative sums greater than 10 min. Within the plateaus, the peaks of the highest correlations are found for summed frames starting at time 0.5–1.5 min. A 7-min window, corresponding to minutes 1–8 (Fig. 2), is where perfusion measured by the pPIB PET scans had the highest correlation with metabolism measured with 18F-FDG for this test cohort (0.78 ± 0.05).
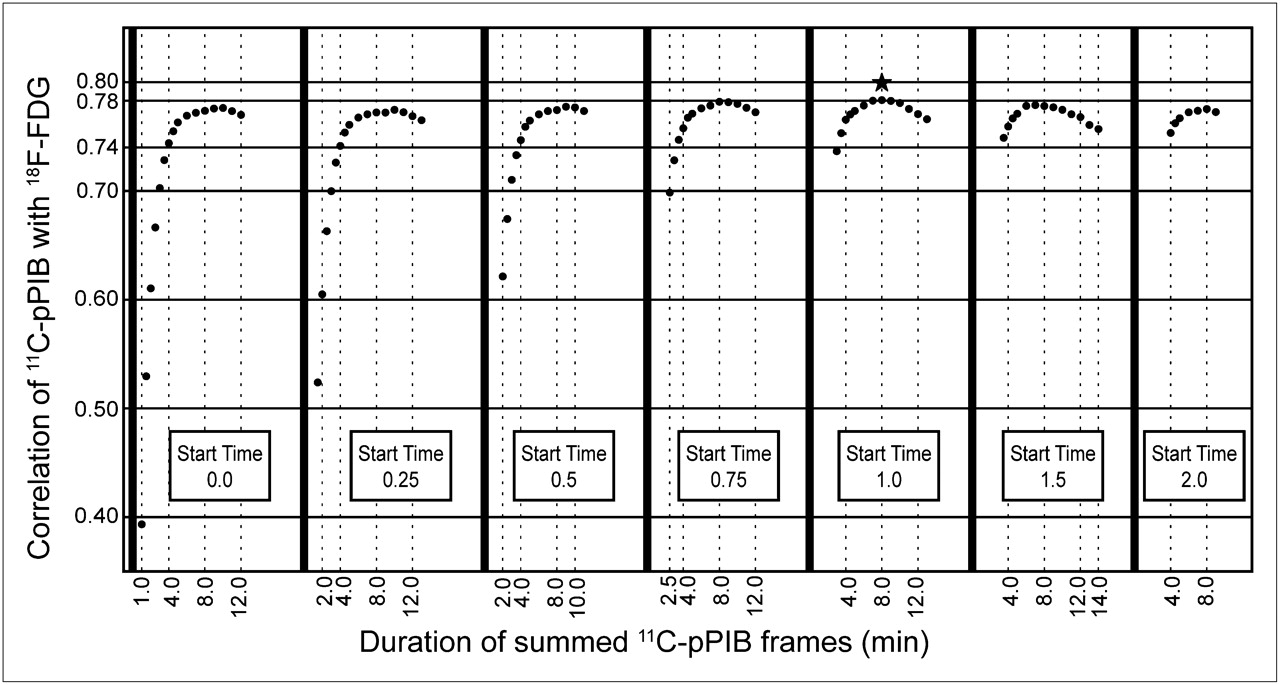
Relationship between pPIB and 18F-FDG for different frame start times and durations. y-axis is correlation between the 2 modalities. Each panel reflects different start time, and x-axis indicates different durations of data acquisition. Star labels frames with maximal correlation (0.78) for frames beginning at 1 min through 8 min.
After this optimal frame range was selected, we evaluated the relationship between our pPIB measure and the estimate of R1 (K1/K1′) using a simplified reference tissue model and a cerebellar input function ( 14). We used 26 ROIs from the MNI atlas masked with a PET-derived gray-matter mask to determine both R1 and the pPIB value for the ROI. The correlation across all 10 subjects was 0.86, indicating a high concordance of our measure with the model's regional estimate of tracer influx.
Validation of Optimal pPIB Time Frame
The optimal pPIB frame range (minutes 1–8) as found in the testing cohort also results in a high voxelwise correlation in the validation cohort. The mean Pearson R for correlation of pPIB and 18F-FDG tracer values across the selected ROIs (12 ROIs with left and right hemispheres considered separately) was 0.91 ± 0.09 and voxelwise was 0.80 ± 0.07.
In Figure 3, representative subjects from each group (AD and FTLD) were chosen to show examples of pPIB and 18F-FDG scans that had both high and low correlation, along with corresponding scatter plots for the 12 ROIs.
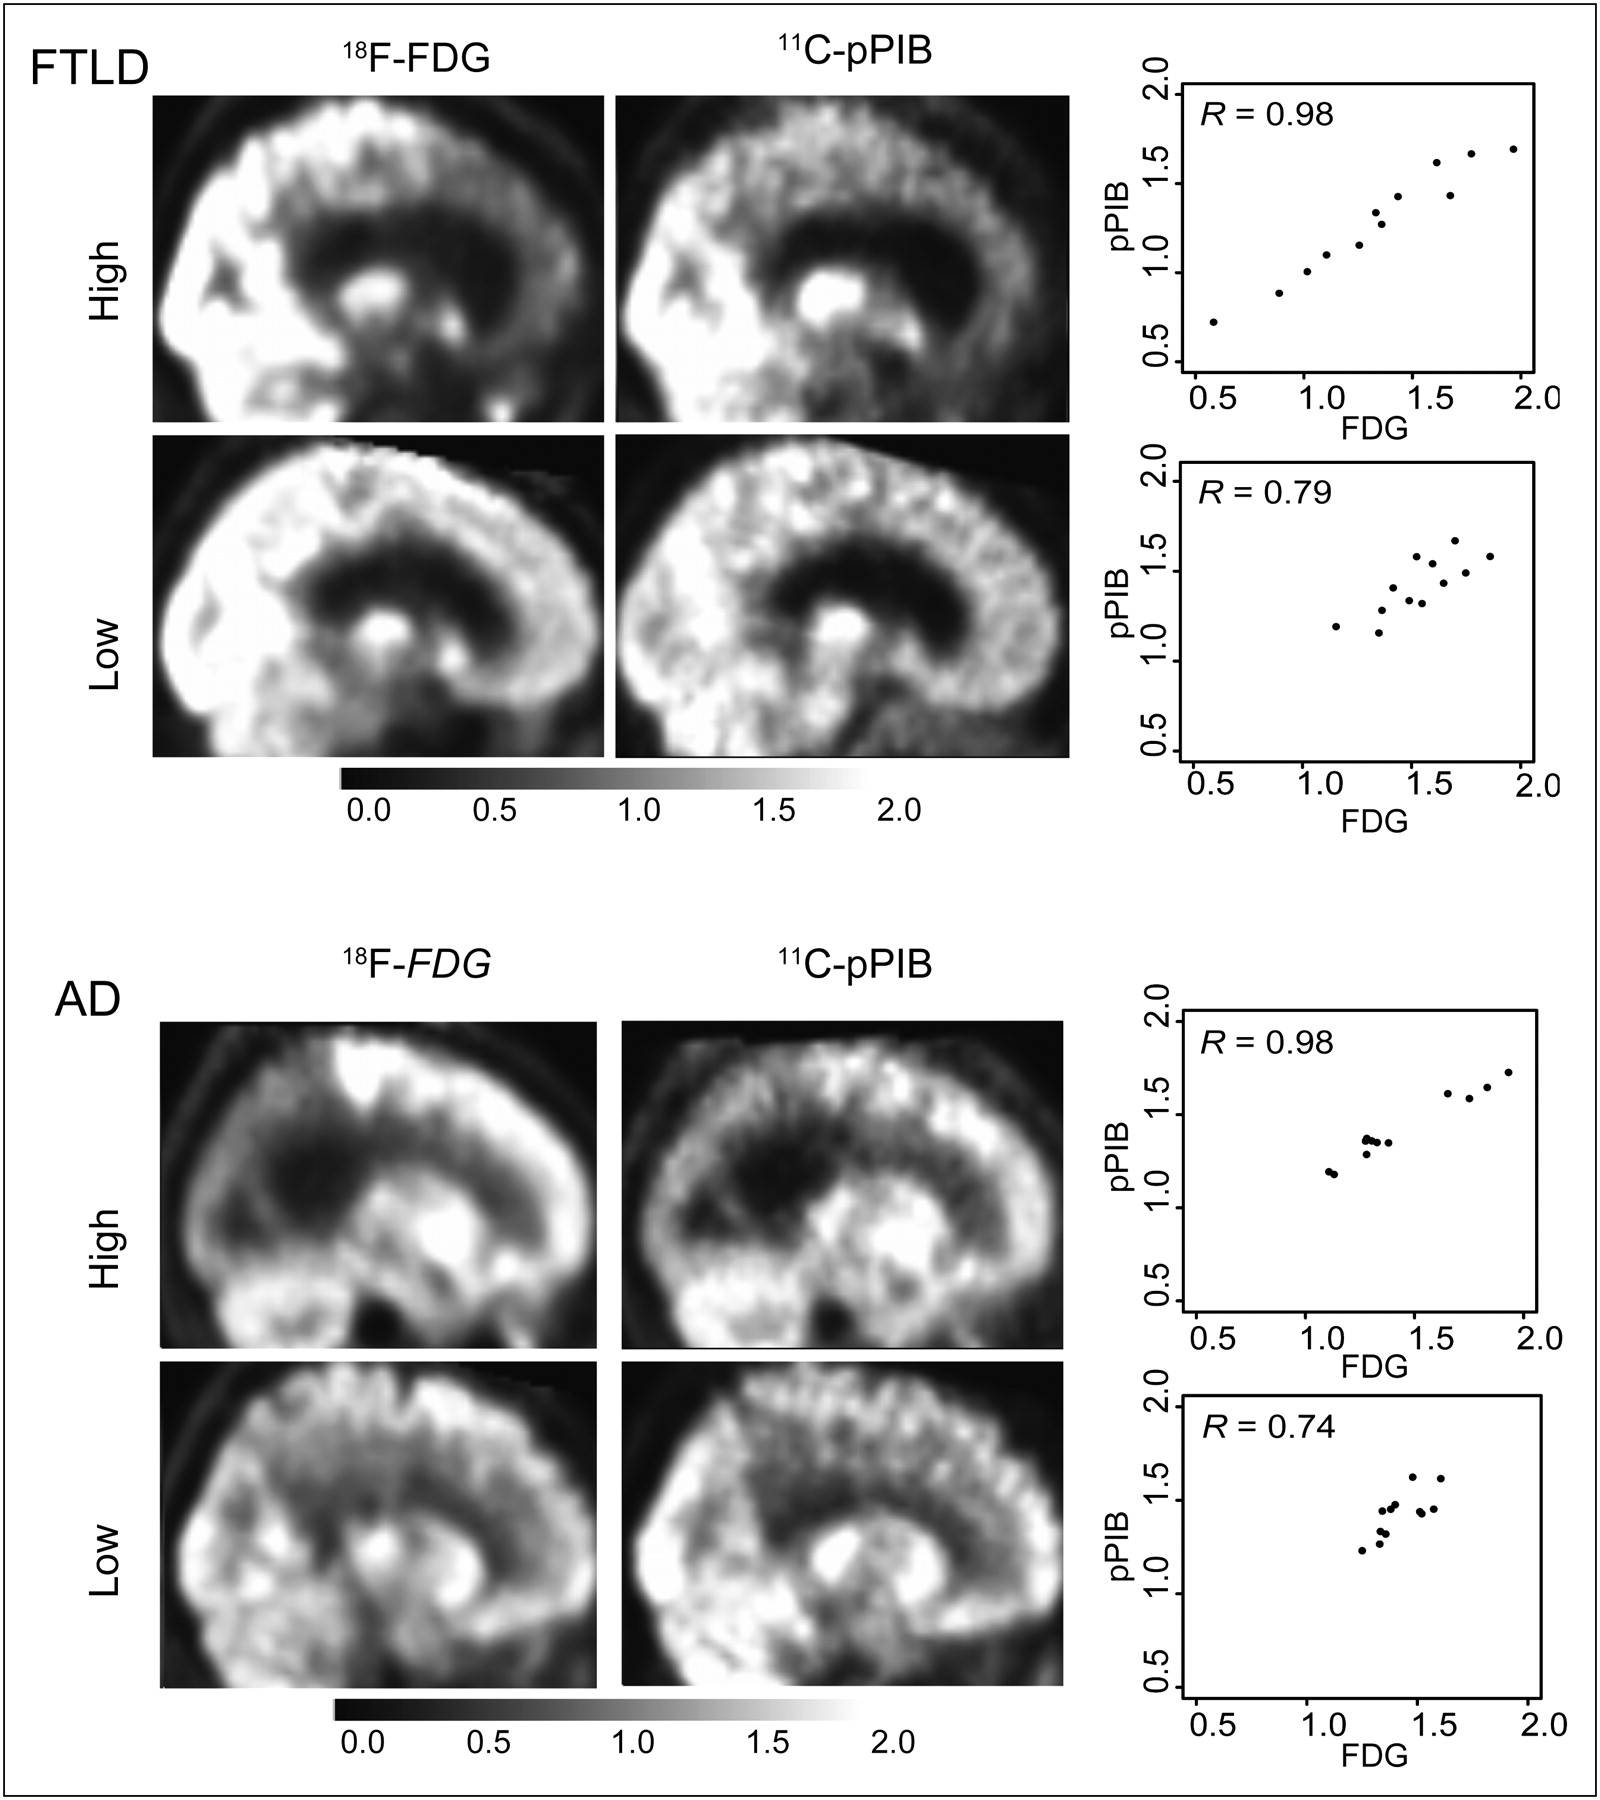
Example 18F-FDG and pPIB PET scan images of AD and FTLD subjects who had high and low correlations across 12 ROIs. ROI values, resulting in correlations associated with each image, are shown in scatterplots with 18F-FDG on x-axis and pPIB on y-axis.
The results of independently running the logistic regression models on each of the radiotracers, 18F-FDG or pPIB, is shown in Table 3. Diagnosis was the dependent variable, and the mean value of 6 ROIs served as independent variables. For every 0.01 unit increase in the pPIB value in the lateral frontal and temporal pole, a subject had higher odds of being correctly classified as AD as opposed to FTLD. Similarly, for every incremental increase of the pPIB value in the temporal neocortex region, a subject had lower odds of being correctly classified as AD, which is expected because this region is more hypometabolic in AD than FTLD. The same pattern and interpretation for the odds ratios are reflected when using 18F-FDG as the radiotracer and performing the logistic regression. The only exception is the lateral frontal region is not significant as a discriminating variable for 18F-FDG.
Logistic Regression Results
Table 3 also shows that the odds ratios for the temporal pole and temporal neocortex ROIs, which are significant in both models, share directionality and act similarly in discriminating AD from FTLD ( Table 4). However, pPIB is slightly more accurate than 18F-FDG in correctly classifying AD patients (38 vs. 37/42 patients correctly classified). Both models perform equally in terms of classifying FTLD patients (26/31 patients correctly classified).
Correct Classification of AD and FTLD Patients with the 2 Tracers and Overall
To explore the effects of the confounding factors of sex, age, education, and cognitive status measured by the MMSE, these factors were included in a second iteration of the logistic regression model. For the 18F-FDG data, temporal pole and temporal neocortex ROIs still remained significant, with odds ratios in the same direction as before, 1.2 (P = 0.01) and 0.8 (P = 0.01). However, age was also a significant discriminator, with an odds ratio of 1.18 (P = 0.007). For the pPIB data, the lateral frontal ROI showed a trend (P = 0.08), but the temporal pole and temporal neocortex as well as age remained significant, with the same direction in their odds ratios: 1.4 (P = 0.003), 0.6 (P = 0.007), and 1.2 (P = 0.01), respectively.
Finally, to investigate whether the 2 tracers provided similar information about dementia severity, we examined correlations between MMSE scores and both pPIB and 18F-FDG values in the temporal neocortex region in AD patients and the lateral frontal region in FTLD patients. In the AD patients, MMSE score correlated significantly with both 18F-FDG (Pearson R = 0.49, P = 0.001) and pPIB (Pearson R = 0.41, P = 0.007). Both tracers in the lateral frontal region of FTLD patients also strongly correlated with MMSE score (18F-FDG: Pearson R = 0.59, P = 0.0004; pPIB: Pearson R = 0.56, P = 0.001).
DISCUSSION
The test cohort showed a high correlation between perfusion, measured by minutes 1–8 (frames 5–15) of an 11C-PIB PET scan, and metabolism, measured by 18F-FDG PET. This time frame was validated on a separate larger cohort and yielded similarly high correlations. Validating the results on a cohort with diagnoses distinct from the test cohort provides further support that the time window used to define the optimal perfusion image was not dependent on diagnosis, suggesting wider applicability of this methodology. Furthermore, application to a clinical situation suggests that these early PIB frames have discriminative power similar to that of 18F-FDG images.
Although minutes 1–8, corresponding to frames 5–15, were chosen in this study as the optimal frame range, as depicted by a peak in our correlation graph, small variations in this range had similarly high correlations. In fact, the middle frame ranges, after the first noisy minute (frames 1–5) up to minutes 7, 8, and 9 (frames 14, 15, and 16, respectively), showed the highest voxelwise correlations in the test cohort, with a mean Pearson R of 0.78 ± 0.05. Thus, the high correlation observed in our choice of minutes 1–8 is not necessarily unique to this frame range.
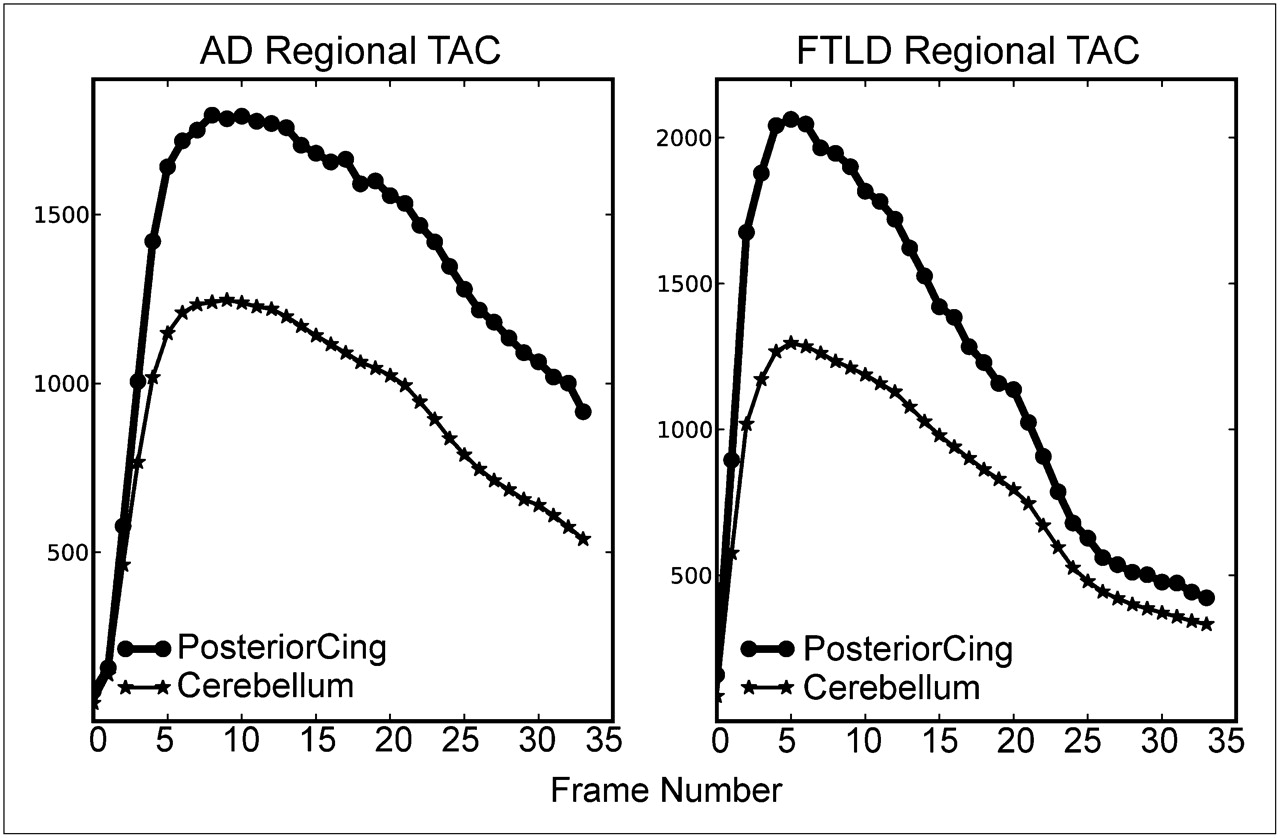
In addition, the shape of the results shown in Figure 2 seems to be driven by 2 competing factors, perfusion in the early time frames and Aβ-amyloid binding in later frames. The initial frames of PIB do not correlate well with 18F-FDG, possibly because of the noisy characteristic of the initial PIB frames, nonuniform delivery of the tracer, and small sampling windows. In later frames, 11C-PIB binds to Aβ, and thus the curve peak declines as a result of low correlation between binding (tissue-bound 11C-PIB) and metabolism (18F-FDG). Representative time–activity curves ( Fig. 4) demonstrate this binding behavior concretely.

11C-PIB time–activity curves for patient with AD and FTLD in target brain region (posterior cingulate cortex) and reference region (cerebellum). Early times after injection are similar in the 2 subjects, whereas tracer retention slows washout in AD patient. TAC = time–activity curve.
The strongest evidence of high correlation is in the side-by-side images of pPIB and 18F-FDG depicted in Figure 3. Although pPIB images may be noisier, the similarity between the patterns of intensity across the 2 images is striking. This pattern holds even for subjects whose Pearson R is in the lower range found in this study.
The results of the logistic regression models further demonstrate the utility of these early PIB frames. Both pPIB and 18F-FDG performed similarly in correctly classifying subjects into AD and FTLD diagnosis groups, as the odds ratios obtained from each model are in the same direction and the same ROIs are statistically significant discriminators. This classification is consistent with other results showing significant differences in hypometabolism in these regions when patients with AD and FTLD are compared ( 3, 7, 28).
One interesting finding from the logistic regression is that pPIB performs better than 18F-FDG as a diagnostic discriminator in the lateral frontal region. This may reflect the fact that, especially in young patients with AD, hypometabolism (and brain atrophy) is seen in the frontal lobes ( 7). Thus, this region alone may not always be the best at differentiating the 2 conditions. Because the subjects in our study were young, it is possible that hypometabolism in this ROI was not a strong discriminator. The reason that the pPIB was a more effective discriminator could be that these early frames contain some information about Aβ binding, raising the ROI values more in AD than FTLD subjects ( 7). Also, in this model, age is a significant discriminator that accounts for confounders, because the AD cohort is slightly older than the FTLD cohort.
As depicted in Table 4, the classification ability of both pPIB and 18F-FDG is similar. In computing these classification percentages, we have used logistic regression instead of discriminant function analysis because multivariate normality assumption was violated. Because of the use of logistic regression and the absence of a cross-validation approach, our classification accuracy is likely to be overly optimistic. However, the important fact is that, despite the possible inflation of these estimates, they are comparable for the 2 tracers, suggesting that similar information is provided by pPIB and 18F-FDG. Also, whereas we did not exclude subjects with cerebrovascular risk factors, it is possible that ischemia could alter the pPIB data in subjects with extensive vascular disease, leading to another question about the full generalizability of the results.
Further supporting the comparability between the pPIB and 18F-FDG images, we found that correlations between pPIB and MMSE score and between 18F-FDG and MMSE score were similar for relevant ROIs in the FTLD and AD patients. It has been shown that cerebral glucose metabolism measured by 18F-FDG correlates with cognitive status quantified by MMSE score but that such correlation is lacking between MMSE score and cerebral amyloid burden measured by PIB in patients with AD ( 21). Thus, these early PIB frames provide information distinct from the information provided in later frames.
The future of amyloid imaging is likely to include several radiotracers that will be labeled with 18F and distributed widely ( 8– 10). The approach that we have taken here could be directly translated to these other compounds and thus find clinical application. The brain penetration and first-pass extraction of these 18F tracers will be important determinants of how useful this approach is. One of the most likely potential uses of these agents could be in aiding in the differential diagnosis of dementia. It is possible that in many cases the presence or absence of β-amyloid binding will be adequate to determine whether an individual has AD or whether an alternative diagnosis, such as FTLD, should be considered. However, information about physiologic change—metabolism or perfusion—may be helpful in both the diagnosis and the staging of disease. In this situation, the use of early image frames could provide this sort of information without the need for an additional patient visit or higher exposure to radioactivity.
CONCLUSION
The use of early frames of 11C-PIB data provides information that reflects perfusion (pPIB) and that is, therefore, related to metabolism. This relationship was demonstrated empirically through the strong correlations found between pPIB and 18F-FDG images and between these images and cognitive status. The approach of using early frames of amyloid imaging data as a proxy for physiologic information related to blood flow and metabolism could be particularly useful with the advent of 18F-labeled amyloid imaging agents.
Acknowledgments
We thank Adi Alkalay for her continuous support with updating and organizing the clinical data. This research was supported in part by grants AG027859, AG034570, AG031861 P01-AG1972403, and P50-AG023501 from the National Institute of Health and ZEN08-87090 and NIRG-07-59422 from the Alzheimer's Association. Support was also received from the John Douglas French Alzheimer's Foundation and the State of California Department of Health Services Alzheimer's Disease Research Center of California (04-33516).
- © 2011 by Society of Nuclear Medicine
REFERENCES
- Received for publication August 8, 2010.
- Accepted for publication November 3, 2010.


Jump to section
Related Articles
Cited By...
- Early-Phase 18F-Florbetapir and 18F-Flutemetamol Images as Proxies of Brain Metabolism in a Memory Clinic Setting
- The RSNA QIBA Profile for Amyloid PET as an Imaging Biomarker for Cerebral Amyloid Quantification
- 18F-FDG PET Imaging in Neurodegenerative Dementing Disorders: Insights into Subtype Classification, Emerging Disease Categories, and Mixed Dementia with Copathologies
- Comparison of Early-Phase 11C-Deuterium-L-Deprenyl and 11C-Pittsburgh Compound B PET for Assessing Brain Perfusion in Alzheimer Disease
- Potential Clinical Applications of PET/MR Imaging in Neurodegenerative Diseases