


Visual Abstract
Abstract
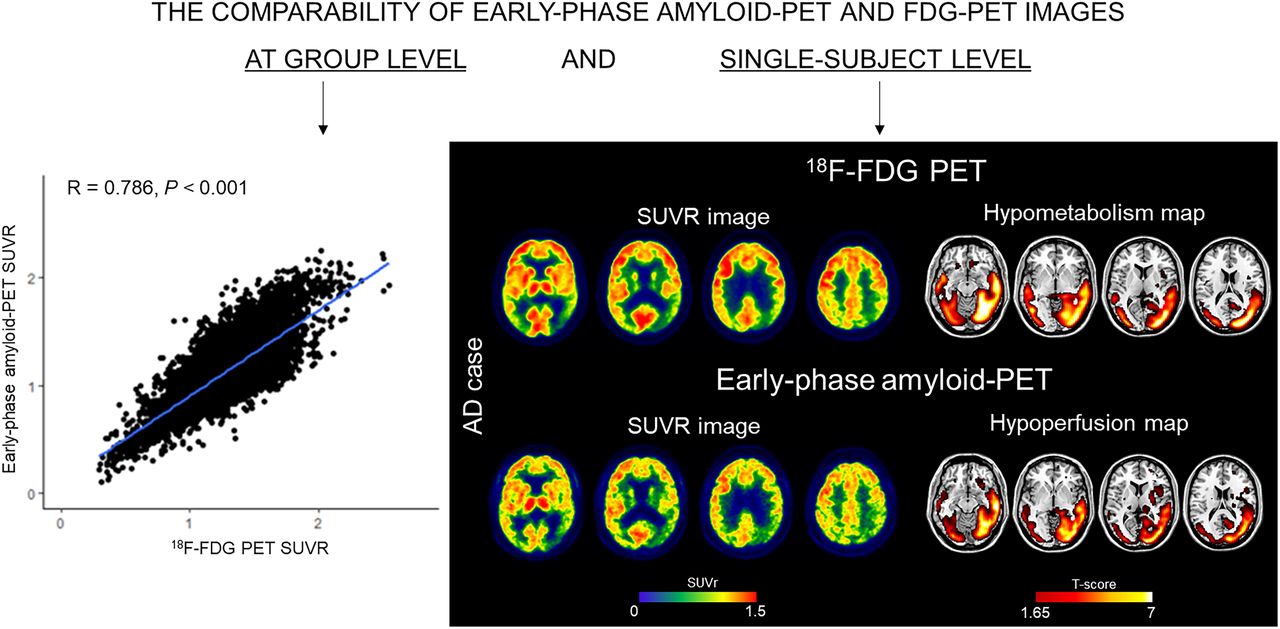
Alzheimer disease (AD) neuropathologic changes are β-amyloid (Aβ) deposition, pathologic tau, and neurodegeneration. Dual-phase amyloid PET might be able to evaluate Aβ deposition and neurodegeneration with a single tracer injection. Early-phase amyloid PET scans provide a proxy for cerebral perfusion, which has shown good correlations with neural dysfunction measured through metabolic consumption, whereas the late frames depict amyloid distribution. Our study aimed to assess the comparability between early-phase amyloid PET scans and 18F-FDG PET brain topography at the individual level and their ability to discriminate patients. Methods: One hundred sixty-six subjects evaluated at the Geneva Memory Center, ranging from no cognitive impairment to mild cognitive impairment and dementia, underwent early-phase amyloid PET—using either 18F-florbetapir (eFBP) (n = 94) or 18F-flutemetamol (eFMM) (n = 72)—and 18F-FDG PET. Aβ status was assessed. SUV ratios (SUVRs) were extracted to evaluate the correlation of eFBP/eFMM and their respective 18F-FDG PET scans. The single-subject procedure was applied to investigate hypometabolism and hypoperfusion maps and their spatial overlap by the Dice coefficient. Receiver-operating-characteristic analyses were performed to compare the discriminative power of eFBP/eFMM and 18F-FDG PET SUVR in AD-related meta–regions of interest between Aβ-negative healthy controls and cases in the AD continuum. Results: Positive correlations were found between eFBP/eFMM and 18F-FDG PET SUVR independently of Aβ status and Aβ radiotracer (R > 0.72, P < 0.001). eFBP/eFMM single-subject analysis revealed clusters of significant hypoperfusion with good correspondence to hypometabolism topographies, independently of the underlying neurodegenerative patterns. Both eFBP/eFMM and 18F-FDG PET SUVR significantly discriminated AD patients from controls in the AD-related meta–regions of interest (eFBP area under the curve [AUC], 0.888; eFMM AUC, 0.801), with 18F-FDG PET performing slightly better, although not significantly (all P values higher than 0.05), than others (18F-FDG AUC, 0.915 and 0.832 for subjects evaluated with eFBP and eFMM, respectively). Conclusion: The distribution of perfusion was comparable to that of metabolism at the single-subject level by parametric analysis, particularly in the presence of a high neurodegeneration burden. Our findings indicate that eFBP and eFMM imaging can replace 18F-FDG PET imaging, as they reveal typical neurodegenerative patterns or allow exclusion of the presence of neurodegeneration. The findings show cost-saving capacities of amyloid PET and support routine use of the modality for individual classification in clinical practice.
PET can provide in vivo evaluation of protein deposition and neuronal injury (1), playing a leading role in the diagnosis of Alzheimer disease (AD) and other dementia conditions. Brain 18F-FDG PET is a well-established tool for investigating neurodegeneration, through the detection of changes in cerebral glucose metabolism. Regional analysis of the 18F-FDG PET signal can reveal specific brain hypometabolism patterns highly indicative of neurodegeneration along the AD, frontotemporal dementia, and Lewy body spectrum, including subjects from the preclinical phases to clinically overt dementia (2). In longitudinal studies, the absence of disease-specific hypometabolism patterns was a strong predictor of preserved cognition (3–5).
Amyloid PET imaging, initially with 11C-labeled Pittsburgh compound B and now also with 3 18F-labeled compounds, namely 18F-florbetapir, 18F-florbetaben, and 18F-flutemetamol, allows the assessment of β-amyloid (Aβ) plaque burden in vivo (1). A dual-phase amyloid PET protocol of acquisition has been proposed, adding to the reference late acquisition an acquisition of the tracer distribution immediately after injection (6). These early-phase images can provide a proxy for cerebral perfusion because of the high lipophilicity of the tracers (6,7). In turn, cerebral perfusion is strongly related to neural dysfunction as measured through metabolic consumption (8,9). In AD, the early-phase acquisition of amyloid PET has shown a good correlation to 18F-FDG PET uptake at the group level, suggesting its potential use as a biomarker of neuronal dysfunction (10–21).
Despite multiple descriptions in the literature of dual-phase amyloid PET, the use of early-phase images in clinical and research settings is not yet widely implemented. Our study explored the utility of early-phase images of amyloid PET scans, using either 18F-florbetapir or 18F-flutemetamol, for individual classification and their comparability with the respective 18F-FDG PET brain hypometabolic voxel-wise maps in a memory clinic cohort.
MATERIALS AND METHODS
Participants
The study included subjects assessed at the Geneva University Hospitals, ranging from cognitively unimpaired (CU) to mild cognitive impairment (MCI) and dementia, in 2 ongoing studies as described previously (22–26). The local ethics committee approved the different imaging studies, which were conducted under the principles of the Declaration of Helsinki and the International Conference on Harmonization good clinical practice. The requirement to obtain informed consent was waived.
We included a total of 166 subjects classified as Aβ-negative (Aβ−) CU (n = 42), Aβ-positive (Aβ+) CU (n = 30), MCI (n = 73) (27), and dementia (n = 21) (28) subjects, following standardized criteria for clinical staging. Specifically, the Aβ− CU group, including healthy volunteers and individuals with subjective cognitive decline (29), all with 18F-FDG PET–negative scans, was used as a healthy control (HC) reference for comparisons. The Aβ+ CU group was considered a group of interest, given the higher risk of progression in this population (30). Inclusion criteria were at least one 3-dimensional T1-weighted MRI scan, dual-phase amyloid PET using either 18F-florbetapir or 18F-flutemetamol, an 18F-FDG PET scan, and an interval of less than 1 year between imaging measures.
MRI Acquisition
MRI was performed at Geneva University Hospitals’ Division of Radiology using a 3-T scanner (Magnetom Skyra; Siemens Healthineers) equipped with a 20- or 64-channel head coil. The supplemental materials, section 1, detail the acquisition parameters (supplemental materials are available at http://jnm.snmjournals.org). The lesion prediction algorithm (31), implemented in the lesion segmentation toolbox, was used to segment fluid-attenuated inversion recovery images, allowing us to extract the total lesion volume. White matter lesions were also quantified visually according to the age-related white matter change scale (32).
PET Acquisition
18F-FDG PET and amyloid PET were performed at the Division of Nuclear Medicine and Molecular Imaging at Geneva University Hospitals using a Biograph 128 mCT, Biograph 128 Vision 600 Edge, Biograph 40 mCT, or Biograph 64 TruePoint PET scanner (Siemens Medical Solutions). All scanners were comparable. 18F-FDG PET was performed according to the European Association of Nuclear Medicine guidelines (33,34). Amyloid PET images were acquired using 18F-florbetapir (FBP) (n = 94) or 18F-flutemetamol (FMM) (n = 72). Amyloid status (Aβ+/Aβ−) was determined for each late image by an expert in nuclear medicine, applying the standard operating procedures approved by the European Medicines Agency.
Regarding the early phase of amyloid PET (eFBP and eFMM), the image acquisition was started immediately after tracer injection, and a static image was acquired for 5 min (eFBP) or 10 min (eFMM) (20,35).
The supplemental materials, section 2, provide full details on the PET acquisition.
MRI and PET Normalization Processing
Processing was performed as previously described (25) using Statistical Parametric Mapping (SPM 12; Wellcome Trust Centre for Neuroimaging), running in MATLAB R2018b, version 9.5 (MathWorks Inc.). All details are reported in the supplemental materials, section 3.
SUV Ratio (SUVR) Extraction in Automated Anatomic Labeling (AAL) ROIs and AD Meta–Region of Interest (Meta-ROI)
Uptake values were extracted within regions from AAL atlas 3 (36) and key regions sensitive to AD according to a predefined meta-ROI approach (37). SUVRs were calculated by normalizing the uptake to the mean value of the pons and cerebellar vermis together as the reference region. Intensity-normalized PET images were saved for further voxelwise analyses.
Single-Subject Voxel-wise Analyses
According to a validated SPM single-subject procedure (38), each PET image was tested for relative hypometabolism/hypoperfusion by means of a 2-sample t test in comparison with PET images of controls. HC groups included 28 and 14 subjects with Aβ− and 18F-FDG PET–negative scans, for eFBP and eFMM samples, respectively. We used the same HC subjects also for the 18F-FDG PET analyses. The statistical threshold for the resulting hypometabolic and hypoperfusion SPM maps was set at a P value of 0.05, uncorrected for multiple comparisons, considering significant clusters containing more than 100 voxels. SPM maps were then binarized for further Dice analyses. The resulting single-subject SPM hypometabolic maps were visually inspected by nuclear medicine experts blinded to clinical diagnoses and classified into hypometabolism patterns suggestive of neurodegenerative conditions (3,39–41) or excluding the presence of neurodegeneration. Hypometabolic and hypoperfusion maps were visually inspected at the single-subject level to define the visual match between maps. The same assessment was applied also to 18F-FDG PET and eFBP/eFMM uptake distribution images.
Statistical Analysis
Dice coefficients were calculated, using FSL software (42), to quantify the whole-brain spatial overlap between hypometabolic and hypoperfusion binary maps at the single-subject level (supplemental materials, section 4) (43). Moreover, we calculated Δ scores between the hypometabolic and hypoperfusion maps’ extents (number of voxels) to quantify discrepancies between the 2 patterns.
General linear models were performed to assess the correlation between eFBP/eFMM SUVR in the AAL ROIs and their respective 18F-FDG SUVR in the whole sample. We assessed the correlations also in Aβ+ and Aβ− subjects separately. We tested the correlation of eFBP, eFMM, and 18F-FDG SUVR in the AD composite meta-ROI with Mini-Mental State Examination scores.
Finally, we identified patients in the AD continuum, including specifically MCI and AD dementia cases according to the Aβ+ status and AD-like hypometabolism patterns. We performed receiver-operating-characteristic (ROC) analyses to compare the discriminative power of eFBP, eFMM, and 18F-FDG meta-ROI SUVRs between HC and AD patients. The resulting areas under the curve (AUCs) from different tracers were compared using a De Long test (44) for 2 correlated ROC curves, setting the threshold for significance at a P value of 0.05. All statistical analyses were performed with R, version 4.0.2 (R Foundation for statistical computing, https://www.r-project.org/).
RESULTS
Demographic and clinical data for our cohort are displayed in Table 1. The average intervals between amyloid PET and 18F-FDG PET, between MRI and 18F-FDG PET, and between MRI and amyloid PET were 2.15 months (SD, 3.06), 1.89 months (SD, 4.15), and 2.76 months (SD, 3.40), respectively.
Demographic Characteristics of Subjects
Correlations Between eFBP/eFMM and 18F-FDG SUVR
Both eFBP and eFMM SUVR in the AAL ROIs presented a strong correlation with 18F-FDG SUVR in the whole group (eFBP r = 0.786, P < 0.001; eFMM r = 0.806, P < 0.001). Good correlations between eFBP/eFMM and 18F-FDG SUVR were also found separately in Aβ+ (eFBP r = 0.843, P < 0.001; eFMM r = 0.827, P < 0.001) and Aβ− (eFBP r = 0.72, P < 0.001; eFMM r = 0.791, P < 0.001) subjects. Figure 1 shows scatterplots for the whole sample and subgroups according to Aβ status.

Correlation between eFBP/eFMM and 18F-FDG PET SUVR. Scatterplots showing association between eFBP/eFMM SUVR (y-axis) in AAL regions and their respective 18F-FDG SUVR (x-axis). Results are presented for whole sample and separately for subgroups divided according to Aβ status. Lines resulting from linear regression are shown in blue. R and P values are given in the upper left corner. FBP = florbetapir; FMM = flutemetamol; eFBP = early FBP; eFMM = early FMM; Aβ− = amyloid negative; Aβ+ = amyloid positive.
The composite meta-ROI SUVRs for eFBP/eFMM uptake and those for 18F-FDG uptake correlated significantly with Mini-Mental State Examination scores (18F-FDG r = 0.536, P < 0.001; eFBP r = 0.413, P < 0.001; eFMM r = 0.482, P < 0.001).
Single-Subject eFBP/eFMM and 18F-FDG Patterns
The SPM single-subject analysis revealed disease-specific hypometabolism and hypoperfusion maps (Fig. 2; Tables 2 and 3). The supplemental materials, section 5, and Supplemental Tables 1–3 present the results of visual analyses for the uptake distribution images. The visual rating of SPM maps allowed identification of 4 neurodegenerative patterns: temporoparietal hypometabolism (AD-like pattern, n = 39), temporoparietal and occipital hypometabolism (Lewy body (DLB)–like pattern, n = 3), frontotemporal hypometabolism (FTD-like pattern, n = 10), and limbic-like or medial–temporal pattern (n = 14). Thirty-two of 124 subjects showed negative 18F-FDG scans for neurodegenerative patterns. Some subjects revealed severe atrophy on T1-weighted MRI and unclassifiable SPM patterns for neurodegenerative disease (n = 26). Despite this heterogeneity, for 86% of subjects the patterns identified by 18F-FDG PET were consistently found in early-phase maps at visual assessment. The frequency of the different hypometabolism and hypoperfusion patterns classified on the basis of SPM map interpretation is reported in Table 2. Table 3 shows the frequency of hypometabolism patterns and their spatial overlaps with hypoperfusion maps as measured by Dice and visual assessment, in the whole sample and separately in the 3 clinical subgroups (CU, MCI, and dementia). The hypometabolic/hypoperfusion maps resulting in the 3 clinical subgroups are fully detailed in the supplemental materials.

Hypometabolic and hypoperfusion patterns at the single-subject level. (A) Patterns of 18F-FDG PET hypometabolism and eFBP/eFMM hypoperfusion in single individuals. Hypometabolism maps, hypoperfusion maps, and their overlap were imposed on standard Montreal Neurological Institute template. These maps were obtained from binarization of single-subject 18F-FDG PET SPM T-maps and eFBP/eFMM SPM T-maps (P < 0.05 uncorrected, k > 100). The Dice similarity index is reported to the right of the brain template of each subject. (B) Clinical groups ordered according to degree of similarity between brain hypometabolism and hypoperfusion, as measured by Dice similarity index average. Lower-to-higher values of Dice indicate increasing degree of overlap. DEM = dementia; eFBP = early florbetapir; eFMM = early flutemetamol; Aβ+ = amyloid positive; Aβ− = amyloid negative; AD = Alzheimer disease; MCI = mild cognitive impairment.
Contingency Table Reporting Frequency of Different Hypometabolism and Hypoperfusion Patterns in Whole Sample
Distribution of Hypometabolism Patterns and Their Voxel-by-Voxel Concordance with Hypoperfusion Maps in Clinical Groups
Only 16 of 124 subjects (13%) showed a mismatch between 18F-FDG and eFBP/eFMM scans. When we compared MRI total lesion volume and age-related white matter change scale scores between the matched and mismatched subgroups, we found a more severe cerebrovascular pathology in cases with mismatch than in matched cases (Mann–Whitney U = 384, P = 0.021, for total lesion volume; Mann–Whitney U = 431, P = 0.041, for age-related white matter change scale).
When we calculated Δ scores to explore discrepancies between the eFBP/eFMM and 18F-FDG PET maps, the main difference was in the extent of the abnormalities. Sixty-five of 92 subjects showed positive Δ scores indicating that the hypometabolism patterns were more extended than the hypoperfusion ones (Δ scores, 13,012 ± 12,996 voxels), regardless of the clinical category. Only 27 of 92 subjects presented negative Δ scores, indicating hypoperfusion patterns slightly more extended than the hypometabolic ones (Δ scores, −6,606 ± 6,943 voxels).
Discriminative Performance of AD Meta-ROI Approach
When testing the performance of the eFBP/eFMM SUVR in the AD composite meta-ROI in distinguishing AD patients from HC subjects, we found good AUC discriminative values (eFBP AUC, 0.888, eFMM AUC, 0.801), like those of the 18F-FDG SUVR (18F-FDG AUC, 0.915 and 0.832, respectively). The DeLong test confirmed no significant differences in the discriminatory performance of different tracers (18F-FDG vs. eFBP P = 0.396; 18F-FDG vs. eFMM P = 0.665). Figure 3 compares the diagnostic performance of 18F-FDG PET SUVR and eFBP/eFMM SUVR in the AD composite meta-ROI in terms of ROC curves for the whole AD-continuum group.

Discriminative performance of eFBP/eFMM and 18F-FDG PET SUVR. ROC curves showing diagnostic performance of 18F-FDG PET and eFBP/eFMM SUVR in AD composite meta-ROI for distinguishing AD patients from HC. AUCs for eFBP/eFMM and 18F-FDG PET are shown in blue and green, respectively. Results of De Long test comparing 2 AUCs (eFBP/eFMM vs. 18F-FDG PET) are given in bottom box. A+ = Aβ-positive; N+ = neurodegeneration-positive; AUC = area under the curve; FBP = florbetapir; FMM = flutemetamol; AD = Alzheimer disease; HC = healthy controls.
As for the other AD-related meta-ROIs (37), none presented significant differences in the discriminatory power of 18F-FDG PET and eFBP/eFMM SUVR between AD patients and HC subjects (Supplemental Table 4).
DISCUSSION
This study compared early-phase amyloid PET with 18F-FDG PET patterns and the power to discriminate subjects in the AD continuum and subjects with other neurodegenerative conditions from HC. The correlation between cerebral perfusion and metabolism has long been established in aging and dementia conditions based on neurovascular coupling (8). At the same time, early-acquisition images of amyloid PET have been proposed as a topographic or functional biomarker reflecting cerebral perfusion (6).
Dual-phase amyloid PET may thus offer the advantage of—in a single procedure—acquiring information about amyloidosis and brain perfusion deficits reflecting neurodegeneration (6). Published work has focused on the relationship between brain perfusion and metabolism at a group level, but to our knowledge no studies have yet evaluated whether early-phase images might replace 18F-FDG PET images in single individuals. This study evaluated brain hypoperfusion at the single-subject level and its comparability to respective brain hypometabolism, demonstrating a good correlation and a similar capacity in distinguishing patients from controls. In the presence of neurodegeneration assessed by 18F-FDG PET, eFBP/eFMM single-subject analysis showed clusters of significant hypoperfusion, compared with controls, with good correspondence to the brain hypometabolism topography. The spatial overlap showed independence from underlying neurodegeneration topography, but with a more clear-cut correspondence in the dementia stages (Fig. 2).
In line with previous studies (10–18), our study confirmed strong positive correlations between eFBP/eFMM and 18F-FDG SUVR (R > 0.72, P < 0.001) in a memory clinic cohort (Fig. 1). The correlation was independent of the used Aβ radiotracers and Aβ status, in agreement with other studies (10,11,13,15). Further supporting the comparability between the eFBP/eFMM and 18F-FDG PET images, we found that lower Mini-Mental State Examination scores correlated significantly with decreases in both perfusion and metabolism measures (10,12,13,16).
When we applied the SPM single-subject analysis on eFBP/eFMM images, clusters of significant hypoperfusion were present in patients compared with controls, with good correspondence to the hypometabolism maps (Fig. 2; Table 2). As for negative scans, characterizing mostly the CU and MCI subgroups, the perfusion maps’ ability was comparable to that of metabolism maps in excluding the presence of neurodegeneration for 90% of the negative scans. In the sample of CU subjects, we found 60% 18F-FDG PET–negative scans, and for 94% of these, eFBP/eFMM images agreed on ruling out neurodegenerative patterns.
In MCI, eFBP/eFMM maps were able to identify patterns specific to neurodegenerative conditions for most cases, showing a moderate-to-good degree of overlap with hypometabolism patterns (Table 3). In most cases, hypometabolism SPM maps showed a greater extent than the hypoperfusion ones, although the disease-specific hallmark was detectable in both (Fig. 2). The lack of a full overlap here between perfusion and metabolism maps is likely because they measure different brain biological processes (8,17). Other reasonable explanations are the noisy feature of the initial frames and the nonuniform delivery of the tracer (13). However, although the early-phase image may be noisier, the similarity between the patterns is also striking in MCI conditions, supporting its use (Fig. 2). A negative 18F-FDG PET scan in MCI was confirmed in 86% of eFBP/eFMM images. This is compatible with the absence of neurodegeneration in MCI, followed by a stable condition at follow-up (45,46).
In dementia conditions, the high comparability of hypoperfusion and hypometabolism maps suggests an increase in concordance with the advance of disease stages (Fig. 2B). Since hypoperfusion usually showed less extension than hypometabolism maps, a more severe underlying neurodegeneration may be necessary to reveal specific patterns that are instead detectable with 18F-FDG PET. This finding suggests that 18F-FDG PET might be more suitable for preclinical and prodromal stages. Further studies are needed to specifically address preclinical phases, such as subjective cognitive decline, based on larger samples and follow-up data.
We found only 13% of subjects with a mismatch between hypometabolism and hypoperfusion maps in the whole sample, mostly in the CU and MCI groups. In these cases, the eFBP/eFMM images were less sensitive in detecting the underlying neurodegeneration than 18F-FDG PET. The risk of having false-negative findings with early-phase imaging warrants an additional 18F-FDG PET exam when clinical suspicion of neurodegenerative conditions is high. The group of mismatch cases showed greater cerebrovascular lesion volumes on MRI than the match group. This result is consistent with the fact that both 18F-FDG PET and eFBP/eFMM images can suffer from biases in the presence of severe atrophy or cerebral vascular disease (8). Thus, this limitation needs to be considered in the application and interpretation of SPM analysis both with 18F-FDG PET and with early-phase imaging.
Finally, we found good diagnostic performance for the meta-ROI approach using perfusion measures (Fig. 3). Both eFBP and eFMM SUVR in the AD composite meta-ROI significantly discriminated AD patients from HC subjects. At ROC analyses, 18F-FDG SUVR was slightly superior to perfusion measures in discriminating these subjects from controls, but without reaching the significance threshold for differences (P > 0.05) (Fig. 3).
As a limitation of our study, we acquired the early-phase images using published protocols (20); however, different early time frames for eFBP have also been proposed in the literature to achieve the best association with 18F-FDG PET (16,18). We are aware of the relatively limited sample size of HC subjects included for comparisons; further studies will help to confirm the findings. An appropriate normalization procedure and HC dataset are mandatory to achieve good performances in voxel-wise analyses, and methods for early-phase images are, in this respect, less mature than for 18F-FDG PET (47).
CONCLUSION
To our knowledge, this was the first study to evaluate, at the single-subject level by applying voxel-based analysis, the classification performance of early-phase amyloid PET images. eFBP and eFMM imaging is able to identify different and typical neurodegenerative patterns or to exclude the presence of neurodegeneration. Dual-phase amyloid PET permits assessment of neurodegeneration and Aβ pathology with a single tracer injection and should be systematically implemented in routine clinical practice. In our opinion, when there is discrepancy between clinical and imaging results, mainly in the early phase of the disease, an additional 18F-FDG PET exam is recommended.
DISCLOSURE
PET scans were performed within research projects funded by the Swiss National Science Foundation (SNSF, projects 320030_169876, 320030_185028, and 320030_182772), Horizon 2020 (project 667375), Human Brain Project, and the EU-EFPIA Innovative Medicines Initiatives 2 Joint Undertaking (IMI 2 JU; grants 115952 and 115736). This project was funded in part by grants from the Swiss National Science Foundation (SNF 3200B0-1161193 and SPUM 33CM30-124111) and an unrestricted grant from the Association pour la Recherche sur l’Alzheimer, Geneva, Switzerland. The Centre de la mémoire at Geneva University Hospital, collecting data with contributions from the Clinical Research Center (University Hospital and Faculty of Medicine, Geneva), is funded by private donors: Association Suisse pour la Recherche sur l’Alzheimer, Genève; Fondation Segré, Genève; Fondazione Agusta, Lugano; Race Against Dementia Foundation, London, UK; Fondation Child Care, Genève; Fondation Edmond J. Safra, Genève; Fondation Minkoff, Genève; McCall Macbain Foundation, Canada; Nicole et Renè Keller, Genève; Fondation AETAS, Genève; VELUX Foundation. Cecilia Boccalini was supported by an IBRO Exchange Fellowship. No other potential conflict of interest relevant to this article was reported.
KEY POINTS
QUESTION: Can we use early-phase amyloid PET scans instead of 18F-FDG PET for individual classification?
PERTINENT FINDINGS: The single-subject procedure applied to early-phase amyloid PET provided typical neurodegenerative patterns in patients as compared with controls, especially in the advanced stage of the diseases. The topographic similarity between the hypoperfusion and hypometabolic patterns was striking, supporting their use for individual classification. Early-phase amyloid PET imaging can exclude the presence of neurodegeneration.
IMPLICATIONS FOR PATIENT CARE: Dual-phase amyloid PET permits assessment of neurodegeneration and Aβ pathology with a single tracer injection in 1 exam, and its implementation will be optimal in terms of costs, patient comfort, and radiation exposure.
Footnotes
Published online Jul. 21, 2022.
- © 2023 by the Society of Nuclear Medicine and Molecular Imaging.
REFERENCES
- Received for publication April 8, 2022.
- Revision received July 15, 2022.


