


Abstract
Amyloid-β (Aβ) imaging with N-methyl-11C-2-(4′-methylamino-phenyl)-6-hydroxy-benzothiazole (11C-6-OH-BTA-1; also known as 11C-PIB) shows a robust increase in cortical binding in Alzheimer's disease (AD). The aim of this study was to explore the clinical potential of Aβ imaging for the diagnosis of AD by comparison of the accuracy of visual reading of 11C-PIB images with quantitative analysis and 18F-FDG. Methods: Fifteen AD patients (age, 71.1 ± 11.3 y [mean ± SD]; mini-mental state examination [MMSE], 18.9 ± 9.3 [mean ± SD]) and 25 healthy control (HC) subjects (age, 71.9 ± 6.82 y; MMSE ≥ 28) underwent 90-min dynamic 11C-PIB PET and 20-min static 18F-FDG PET. 11C-PIB images, generated from data acquired between 40 and 70 min after injection, and 18F-FDG images were rated separately by 2 readers as normal, possible AD, or probable AD. Quantitative analyses used the distribution volume ratio (DVR) of frontal cortex, parietotemporal cortex, posterior cingulate, and caudate nucleus for 11C-PIB and standardized uptake value ratio (SUVR) of parietotemporal cortex and posterior cingulate for 18F-FDG, using cerebellar cortex as the reference region. Receiver-operating-characteristic (ROC) analysis was performed to compare the accuracy of quantitative measures. To determine the effect of age on diagnostic accuracy, the median age of the AD subjects (74 y) was chosen to separate the cohort into younger (64.4 ± 5.8 y) and older (78.6 ± 4.1 y) groups. Results: Visual agreement between readers was excellent for 11C-PIB (κ = 0.90) and good for 18F-FDG (κ = 0.56). 11C-PIB was more accurate than 18F-FDG both on visual reading (accuracy, 90% vs. 70%, P = 0.05) and ROC analysis (95% vs. 83%, P = 0.02). Accuracy declined more with 18F-FDG than with 11C-PIB in the older group. Conclusion: Visual analysis of 11C-PIB images appears more accurate than visual reading of 18F-FDG for identification of AD and has accuracy similar to quantitative analysis of a 90-min dynamic scan. The accuracy of 11C-PIB PET is limited by cortical binding in some healthy elderly subjects, consistent with postmortem studies of cerebral Aβ. Longitudinal follow-up is required to determine if this represents detection of preclinical AD.
For more than a decade, 18F-FDG PET has been used to assist the diagnosis of Alzheimer's disease (AD). Temporoparietal and posterior cingulate hypometabolism with sparing of subcortical structures and sensorimotor and occipital cortices are characteristic of AD (1). Both visual interpretation and quantitative diagnostic approaches yield a similar sensitivity of approximately 85%–95%, and specificity ranging from 70% to 90%, in diagnosing AD (1–4). Accuracy is influenced by disease severity and subject age, as the degree of hypometabolism is proportional to the degree of cognitive impairment (5), and the characteristic pattern of AD is less apparent in older patients (5–8). Age-related atrophy and more frequent multiple pathology contributing to the dementia make visual diagnosis of 18F-FDG PET images more difficult in the elderly.
Amyloid-β (Aβ) plaques are one of the pathologic hallmarks of AD. Extensive cortical plaques are present in patients with AD at postmortem, and Aβ deposition is believed to begin well before the onset of symptoms (9,10). Recently, a 11C-labeled derivative of the thioflavin-T amyloid dye was shown to be suitable for in vivo quantification of cerebral Aβ (11). N-Methyl-11C-2-(4′-methylamino-phenyl)-6-hydroxy-benzothiazole (11C-6-OH-BTA-1; also known as “Pittsburgh Compound-B” or 11C-PIB) has been shown in vitro to possess high affinity (dissociation constant, 1–2 nM) and high specificity for Aβ fibrils and bind to Aβ plaques but not neurofibrillary tangles in postmortem human brain homogenates (12,13). Quantification of 11C-PIB PET has shown a robust difference in cortical binding between AD and age-matched healthy control (HC) subjects, while showing minimal retention in cerebellum (11), a region known to be relatively devoid of neuritic Aβ plaque (14,15).
Aβ imaging with 11C-PIB provides researchers and clinicians the opportunity to assess Aβ burden in vivo. 11C-PIB imaging has great potential as a diagnostic tool and as a surrogate measure of response to antiamyloid therapy. Although visual interpretation of 11C-PIB PET scans would seem to be the most expedient method for diagnosis of AD in clinical practice, all studies reported to date have relied on more complex quantitative techniques. The most widely used quantitative method has been graphical analysis by Logan plot of a 60- or 90-min dynamic scan using the cerebellar cortex as the reference region to derive the distribution volume ratio (DVR) (11,16) or binding potential (i.e., DVR – 1) (17). To our knowledge, the accuracy of visual analysis of 11C-PIB PET images has not been reported nor has it been compared with 18F-FDG PET.
The purpose of the study was to determine the accuracy of visual interpretation of 11C-PIB PET images for differentiating AD from age-matched HC subjects and to compare this to (a) visual interpretation of 18F-FDG PET images in the same subjects, (b) quantitative measurement of 11C-PIB binding, and (c) quantitative measurement of regional cerebral 18F-FDG uptake.
MATERIALS AND METHODS
Subjects
Twenty-five HC subjects were recruited through the Healthy Aging Study of the Mental Health Research Institute, Victoria, and had normal cognitive function on neuropsychologic assessment. Fifteen AD patients were recruited through the Austin Hospital Memory Disorders Clinic. All subjects fulfilled National Institute of Neurological and Communicative Diseases and Stroke/Alzheimer's Disease and Related Disorders Association criteria for probable AD (18). None of the subjects had diagnostic features of dementia with Lewy bodies, frontotemporal dementia, or other non-AD dementias. Most AD subjects had mild-to-moderate dementia, with two thirds scoring >20 on the mini-mental state examination (MMSE). Table 1 provides the demographic details of the subjects. Informed consent was obtained from each subject, or their next of kin, and all procedures were approved by the Austin Health Human Research Ethics Committee.
Demographic Details
Tracer Synthesis
Production of 11C-PIB was performed in the Department of Nuclear Medicine and Centre for PET, Austin Hospital, using the 1-step 11C-methyl triflate approach (19). The average radiochemical yield was 20% after a synthesis time of 45 min, with a radiochemical purity of >98%.
Image Acquisition Protocols
T1-weighted 3-dimensional spoiled gradient recalled MRI was obtained for all subjects for PET image coregistration and to facilitate anatomic localization of regions of interest (ROIs) used in the analysis of the PET data. The MR images were also screened for non-AD pathology, such as stroke and tumor.
All PET brain images were acquired using a Philips ADAC Allegro full-ring 3-dimensional PET system with PIXELAR germanium oxyorthosilicate crystal detectors. The system has a spatial resolution of approximately 4.4 mm (full width at half maximum) in the center of the field of view. A short transmission scan (75 s) was first acquired using 137Cs transmission source for validation of correct head positioning and for nonuniform attenuation and scatter correction of the emission scan; this was followed by a 90-min emission scan performed in list-mode from the time of intravenous injection of 370 MBq of 11C-PIB. The emission sinograms were sorted from the list-mode raw data into 28 dynamic frames (4 × 30 s, 9 × 60 s, 3 × 90 s, 10 × 360 s, and 2 × 600 s). All dynamic images were reconstructed from the dead-time and decay-corrected dynamic emission sinograms using the row-action maximum likelihood algorithm (20) with the optimal iteration number of 1, relaxation of 0.006, and blob radius of 2.5.
On completion of 11C-PIB image acquisition, the subjects were injected intravenously with 250 MBq of 18F-FDG and remained in a darkened, quiet room. All subjects fasted for at least 6 h and were normoglycemic at the time of 18F-FDG injection. A 20-min static PET emission scan was acquired 60 min after injection of 18F-FDG on the same camera, and images were reconstructed using the same image reconstruction techniques.
Data Analysis
Coregistration of the PET images with the MRI was performed with statistical parametric mapping 2 (SPM2; Wellcome Department of Cognitive Neurology, London, U.K.). Mean radioactivity values were obtained from ROIs for cortical, subcortical, and cerebellar regions, and decay-corrected time–activity curves were generated.
Plots of the time course of ROI-to-cerebellum ratios showed that apparent steady state between the different brain regions and cerebellum, a region relatively unaffected by Aβ deposition, was attained after 40 min after 11C-PIB injection. Therefore, summed images of SUV data acquired from 40 to 70 min after injection were generated for visual analysis.
11C-PIB and 18F-FDG images were read separately by a nuclear medicine physician with expertise in neuroimaging, who has read >1,000 18F-FDG brain PET studies (reader A), and a recently qualified nuclear medicine specialist, who has read between 50 and 100 18F-FDG brain PET scans (reader B). Both were unaware of the clinical diagnosis. 11C-PIB and 18F-FDG images were presented separately and randomly. Images were graded as normal, possible AD, or probable AD. Neither of the readers had prior experience with 11C-PIB PET. Transverse, sagittal, and coronal views were available for viewing using standard MedImage MedView or Philips Syntegra software. Before reading the 11C-PIB images, a demonstration was given using 2 AD images and 1 typical HC 11C-PIB image (Fig. 1) from subjects not included in this study cohort. Readers were advised to use a rainbow color scale normalized by setting cerebellar white matter to yellow. Subjects with cortical binding (yellow or red) in frontal, posterior cingulate, precuneus, parietal cortex, and temporal cortex were classified as having possible or probable AD, depending on intensity and extent of uptake. 18F-FDG images were read with the same image display software, but the readers were able to use the color scale and criteria they preferred for routine clinical brain 18F-FDG PET reporting.
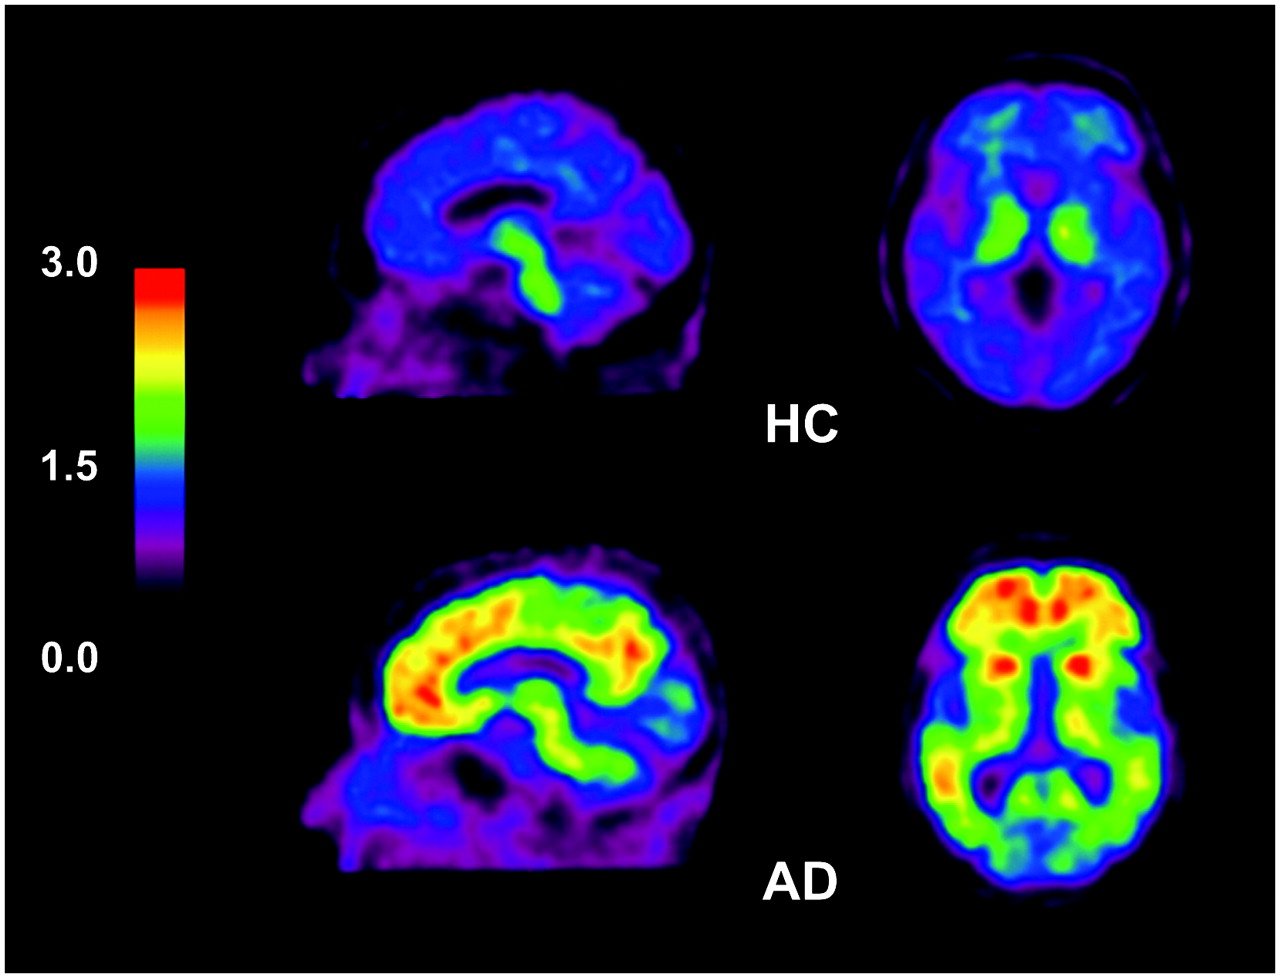
11C-PIB PET images show white matter uptake of 11C-PIB in HC subject (top) and extensive cortical and subcortical uptake in AD patient (bottom). Note relative sparing of sensorimotor and occipital cortex in AD patient.
SPM was used to identify key areas for subsequent quantitative analysis. Six AD and 6 HC 11C-PIB studies were randomly selected. These were coregistered to the subjects' MRI using SPM2 and then normalized to a standardized template (Montreal Neurological Institute, McGill University, Canada). Two sample t tests were performed, using SPM2, to identify regions that showed the greatest difference in AD from HC (i.e., regions above a threshold of corrected P value < 0.01) (Fig. 2). The 5 key areas identified were the medial orbitofrontal, precuneus/posterior cingulate, caudate nucleus, lateral temporal, and parietal gray matter.

SPM analysis of AD vs. HC subjects. Results are superimposed on transverse T1-weighted MRI brain templates at level of caudate nucleus (left) and at level of posterior cingulate cortex (right). Highlighted areas represent brain regions where AD had significantly higher 11C-PIB uptake than HC. Five regions (indicated by arrows) are clearly identified (height threshold, uncorrected P = 0.01; voxel extension, 125).
To quantify 11C-PIB uptake in the regions identified on SPM analysis, ROIs were drawn manually by an experienced nuclear medicine physician onto the coregistered MR image, which were subsequently transferred to the corresponding PET images. Each region was drawn symmetrically on both cerebral hemispheres to obtain an average uptake value. Care was taken to avoid white matter. The regional DVRs were determined through graphical analysis. To avoid arterial blood sampling, a simplified approach was applied using the cerebellar cortex as the input function. (14,21). The DVR is the slope of the linear section of the plot of: where CTissue is the decay-corrected PET radioactivity concentration in brain regions and CCb is the decay-corrected PET radioactivity concentration in the cerebellar cortex.
The mean of the DVRs for the above ROIs was calculated for each subject's 11C-PIB scan and termed “mean regional DVR” (mrDVR) for subsequent statistical analysis.
For quantification of 18F-FDG PET, the same coregistration method was applied. In contrast to 11C-PIB analysis, only lateral temporal, parietal, and posterior cingulate cortices were used as the ROI. A mean standardized uptake value (SUV) of these 3 regions was obtained, which was subsequently normalized to the SUV of the cerebellar cortex to obtain the mean regional SUV ratio (mrSUVR) for further statistical analysis.
Statistical Analysis
κ-Statistics were calculated to assess the interobserver agreement for the visual interpretation of both 11C-PIB and 18F-FDG images.
For the assessment of the accuracy of visual interpretation of 11C-PIB PET in differentiating AD (both possible and probable AD) from HC, 2 × 2 contingency analysis was used to determine the test sensitivity and specificity. Diagnostic accuracy of 18F-FDG PET was also determined with the same method and compared with the 11C-PIB results.
Receiver-operating-characteristic (ROC) curves were generated using a nonparametric approach to assess the accuracy of the mrDVR and mrSUVR for AD diagnosis. Cutoff values that produced the highest test sensitivity and specificity were determined by the maximum area under curve (AUC).
Cohen's effect size was calculated as the difference in mean DVR (for 11C-PIB), and mean SUVR (for 18F-FDG), of AD and HC divided by the pooled SD.
To assess the effect of age on diagnostic accuracy, the cohort was separated according to the median age of the AD cohort into 2 groups, younger (<74 y) and older (≥74 y), and the above analyses were performed on both categories.
RESULTS
Visual Analysis
Results of the visual analysis are summarized in Table 2. Agreement between readers A and B for the diagnosis of AD by visual assessment was excellent for 11C-PIB (κ = 0.90) and good for 18F-FDG (κ = 0.56).
Summary of Results of Visual Analysis Obtained from Both Readers (15 AD and 25 HC Subjects)
There was greater certainty in interpretation of 11C-PIB images than 18F-FDG images, with fewer subjects classified as having possible AD. Between the 2 readers, 8 11C-PIB images (10%) were classified as possible AD, whereas 18 18F-FDG images (23%) were classified as possible AD. Both readers classified correctly all 15 AD subjects as probable AD on 11C-PIB images.
The test sensitivity, specificity, and accuracy of visual interpretation of 11C-PIB and 18F-FDG are summarized in Table 3. 11C-PIB scans appeared to be more accurate (∼90%) than 18F-FDG scans (∼70%). Such difference was significant in reader B (P = 0.03) but just failed to reach significance in reader A (P = 0.06). Age appeared to have an impact on specificity but not on sensitivity in 11C-PIB. For 18F-FDG scans, a reduction in both test sensitivity and specificity was observed in the older group when compared with the younger subjects. This was particularly evident for the more experienced reader (A), whose accuracy declined from 95% in the younger group to 57% in the older group (P < 0.01).
Comparison of Accuracy of 11C-PIB vs. 18F-FDG (Visual Analysis)
Quantitative Analysis
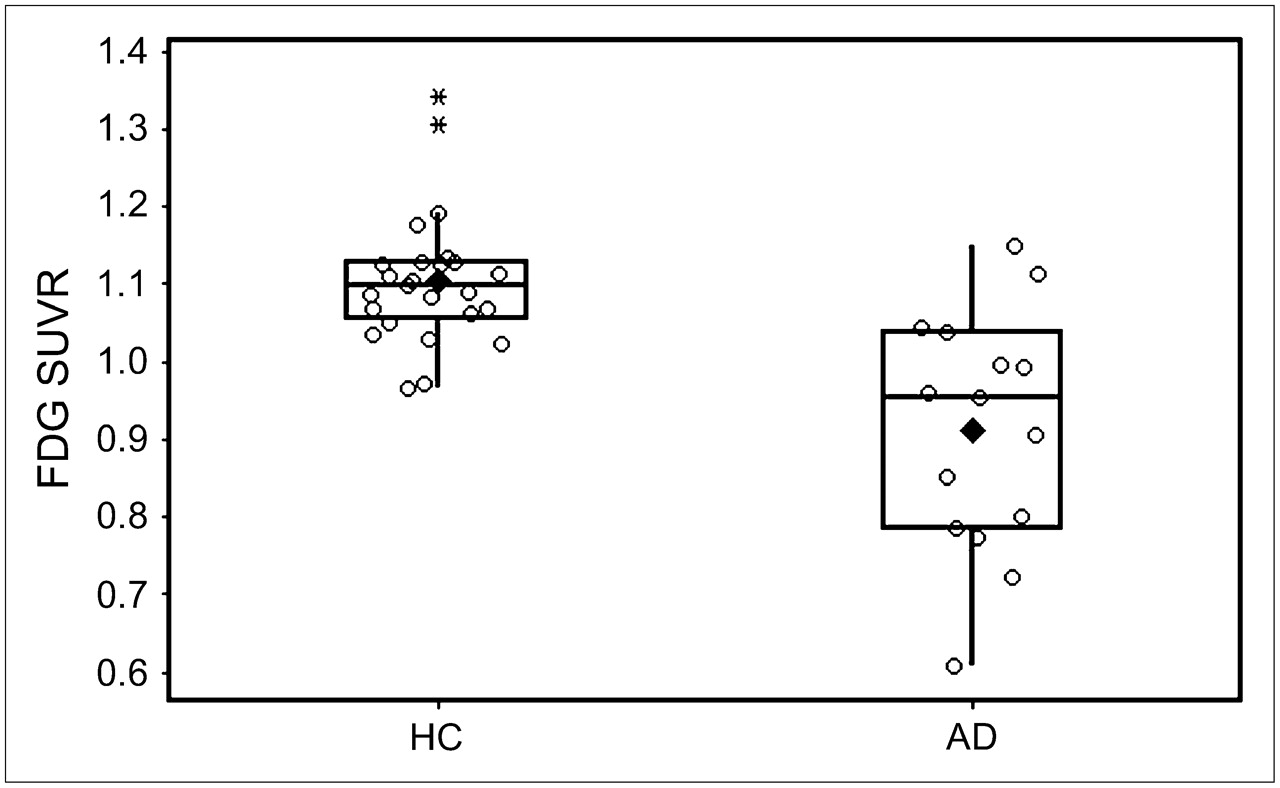
The mrDVR and mrSUVR values are shown in Figures 3 and 4, respectively. The mrDVR of the AD group was significantly higher than that of the HC group. Three HC subjects had DVRs close to the range of AD. Although the mean of mrSUVR was significantly higher in HC than AD subjects, the difference in mrSUVR appeared to be less robust than the difference observed in mrDVR of 11C-PIB scans. The Cohen's effect size for 11C-PIB was 3.87 and for 18F-FDG was 1.53.
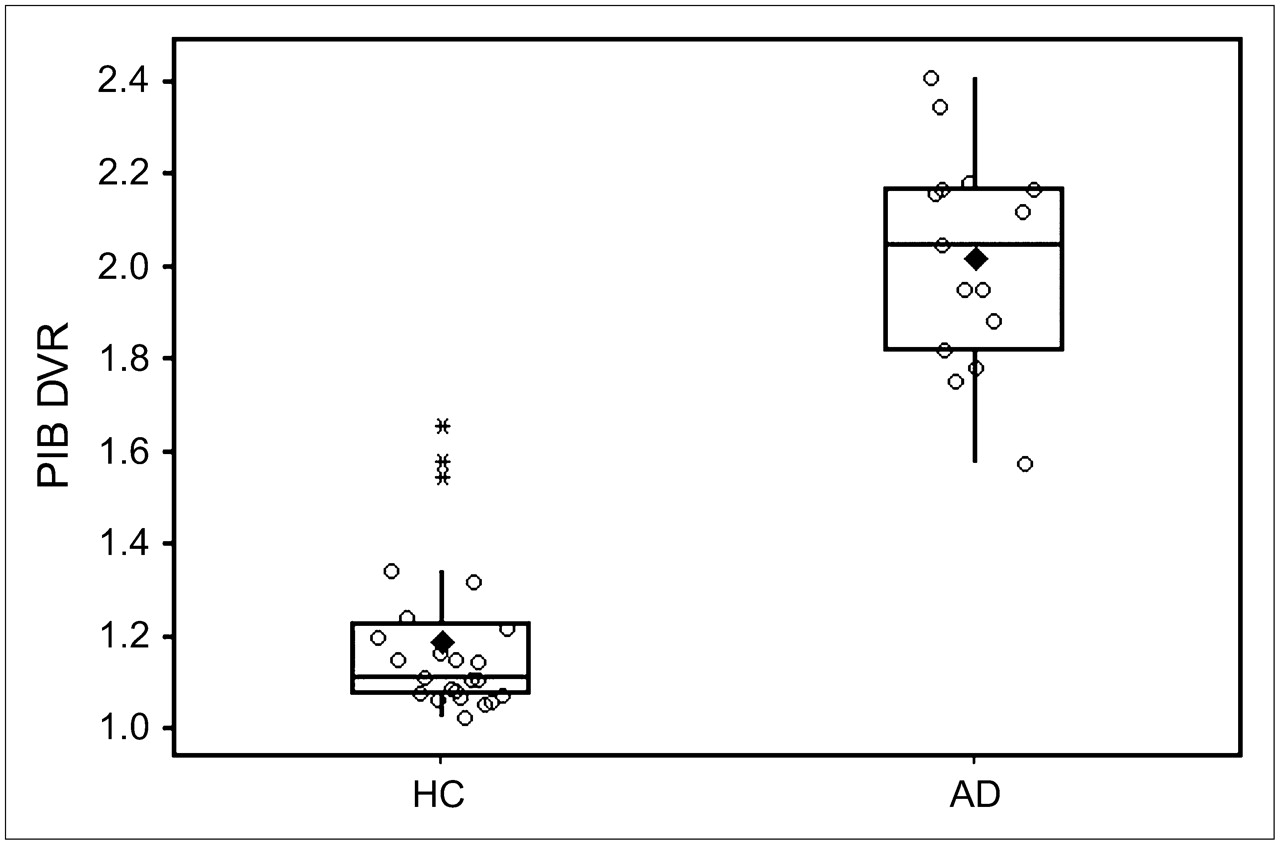
Box plot of 11C-PIB mrDVR of HC and AD shows median value, quartiles, outliers (*), and mean (♦). Mean mrDVR (HC) = 1.19 ± 0.17 vs. mean mrDVR (AD) = 2.02 ± 0.23 (P < 0.01; Cohen's effect size = 3.87 indicates nonoverlap of 97% in 2 distributions).

Box plot of 18F-FDG mrSUVR of HC and AD shows median value, quartiles, outliers (*), and mean (♦). Mean mrSUVR (HC) = 1.10 ± 0.09 vs. mean mrSUVR (AD) = 0.91 ± 0.15 (P < 0.01; Cohen's effect size = 1.53 indicates nonoverlap of 71% in 2 distributions).
ROC analysis of mrDVR showed that quantitative 11C-PIB analysis was 95% accurate in AD diagnosis (Table 4), a result similar to visual analysis (∼90%) and significantly better than the mrSUVR of 18F-FDG scans (P = 0.02).
Accuracy of 11C-PIB mrDVR and 18F-FDG mrSUVR by ROC Analysis
Comparing ROC curves of the younger and the older groups revealed no difference in diagnostic accuracy in the 11C-PIB quantitative analysis, whereas a significant improvement (27% increase in AUC) was observed in the younger group for the 18F-FDG scans. AUCs for both 11C-PIB subgroups were 1.00, whereas AUCs for the 18F-FDG younger group versus the older group were 0.99 versus 0.73 (P = 0.02).
DISCUSSION
This study showed that imaging of specific disease-related pathology with the brain Aβ PET tracer 11C PIB may provide diagnostic advantages over nonspecific measures such as hypometabolism on 18F-FDG PET. A similar advantage has recently been reported for a PET ligand with affinity to brain Aβ and τ that differentiated HC subjects, subjects with mild cognitive impairment, and subjects with AD better than did 18F-FDG PET or volume on MRI (22). Our study also demonstrated that visual interpretation of a 30-min 11C-PIB PET image was as accurate as quantitative analysis of a 90-min dynamic scan and appropriate for routine clinical practice. 11C-PIB scans were easy to read after minimal training and were read with very high interobserver agreement and with accuracy exceeding 90%. Interobserver agreement was higher than that for 18F-FDG PET and readers were more confident with 11C-PIB images, classifying less as possible AD. Quantitative 11C-PIB analysis also demonstrated a diagnostic advantage over quantitative 18F-FDG PET, as reflected by the Cohen's effect size (11C-PIB = 3.87 vs. 18F-FDG = 1.53) and a significant difference with ROC analysis (AUC, 100% vs. 87%).
The 5 regions used in our 11C-PIB quantitative analyses are areas known to have large deposits of Aβ plaques in AD (23,24). Autopsy series have shown up to 4-fold greater Aβ plaque density in frontal cortex than that in the mesial temporal region in early AD (10,25), whereas the visual cortex and primary sensorimotor cortex are not usually involved until very late in the disease course (23).
The 3 regions used in our quantitative 18F-FDG analysis have been shown consistently in previous literature to be the areas most affected metabolically in AD (3,26,27). Although there is no consensus on the most suitable reference region for normalization of SUVs for intersubject comparison of 18F-FDG scans, the cerebellar cortex has been widely utilized. The metabolism of cerebellar cortex has been shown to be relatively unaffected in mild-to-moderate AD (1,28,29), though significant hypometabolism has been reported in severe AD (30).
The accuracy of visual and quantitative analysis of 18F-FDG PET declined markedly in the older subjects. In the younger cohort with a mean age of 64 y, the sensitivity of 18F-FDG PET was 100%, with a specificity of 75%, producing an accuracy of 84%. In this group, the experienced reader had 95% accuracy. These figures accord with a recent metaanalysis of 18F-FDG PET for the diagnosis of AD that calculated pooled sensitivity and specificity estimates of 86% (4). The studies in the metaanalysis had mean subject ages ranging from early to late 60s. The few studies that have looked specifically at late-onset AD, defined as onset after the age of 65 y, have reported 20% lower accuracy in late-onset AD compared with early-onset AD for diagnosis based on visual or quantitative 18F-FDG PET findings (6,8,31,32). Our older AD group had a mean age of 81 y and, to our knowledge, there are no reports on the accuracy of 18F-FDG PET in a population of this age. The prevalence of AD at age 60 y is 1% but by age 85 y it is 25%. As the population ages, most patients presenting for diagnosis of AD will be >70 y of age, presenting a challenge for 18F-FDG PET. More studies are needed to determine the accuracy of 18F-FDG PET in older subjects with AD. The accuracy of 11C-PIB PET was less affected by age. Sensitivity remained 100%, but specificity fell due to a higher number of positive scans in the older group of normal subjects whose mean age was 77 y. This is to be expected given that postmortem data show that Aβ plaque is present in 30% of the nondemented elderly population above 75 y of age (33,34). The number of “false-positive” 11C-PIB scans (27%) in our older cohort (age ≥ 74 y) is consistent with this figure. Positive 11C-PIB scans in apparently normal elderly individuals have also been reported in 3 of 20 subjects over 65 y of age (35). Cerebrospinal fluid Aβ42 depressed to levels usually found in AD has been reported in healthy subjects with positive 11C-PIB scans (17). These elderly subjects with Aβ plaques may represent preclinical AD, as postmortem evidence suggests that Aβ deposition may begin up to 10 y before the onset of AD symptoms (9,10). Longitudinal follow-up is required to establish if this is the case. If so, the true accuracy of 11C-PIB PET for the detection of AD may be even greater than the 95% found in this study.
CONCLUSION
11C-PIB PET shows great promise as an aid for the diagnosis of AD. 11C-PIB PET images appear easier to read and more accurate than 18F-FDG PET images in AD diagnosis, particularly in older subjects. The accuracy of visual analysis is comparable with the most widely utilized quantitative method of 11C-PIB image analysis.
Acknowledgments
This research was supported in part by funds from the Austin Hospital Medical Research Foundation, Neurosciences Victoria, the University of Melbourne, and the Department of Health and Ageing Commonwealth Government of Australia. We thank Jessica Sagona, Kunthi Pathmaraj, Bridget Chappell, Jason Bradley, and Gareth Jones for their crucial role during PET examinations and image processing.
References
- Received for publication November 1, 2006.
- Accepted for publication January 20, 2007.


Jump to section
Related Articles
Cited By...
- Traumatic brain injury and Alzheimers Disease biomarkers: A systematic review of findings from amyloid and tau positron emission tomography (PET)
- Discordance and Concordance Between Cerebrospinal and [18F]FDG-PET Biomarkers in Assessing Atypical and Early-Onset AD Dementia Cases
- First in-human PET study of 3 novel tau radiopharmaceuticals: [11C]RO6924963, [11C]RO6931643, and [18F]RO6958948
- Characterization of 3 Novel Tau Radiopharmaceuticals, 11C-RO-963, 11C-RO-643, and 18F-RO-948, in Healthy Controls and in Alzheimer Subjects
- 18F-FDG PET Improves Diagnosis in Patients with Focal-Onset Dementias
- Use of Standardized Uptake Value Ratios Decreases Interreader Variability of [18F] Florbetapir PET Brain Scan Interpretation
- Comparison of Simplified Parametric Methods for Visual Interpretation of 11C-Pittsburgh Compound-B PET Images
- Visual-Statistical Interpretation of 18F-FDG-PET Images for Characteristic Alzheimer Patterns in a Multicenter Study: Inter-Rater Concordance and Relationship to Automated Quantitative Evaluation
- Assessing Mild Cognitive Impairment with Amyloid and Dopamine Terminal Molecular Imaging
- Brain Amyloid Imaging
- Effectiveness and Safety of 18F-FDG PET in the Evaluation of Dementia: A Review of the Recent Literature
- Amyloid vs FDG-PET in the differential diagnosis of AD and FTLD
- Brain Amyloid Imaging
- Amyloid Imaging with 18F-Florbetaben in Alzheimer Disease and Other Dementias
- Cortical and frontal atrophy are associated with cognitive impairment in age-related confluent white-matter lesion
- Target-Specific PET Probes for Neurodegenerative Disorders Related to Dementia
- Molecular imaging in the diagnosis of Alzheimer's disease: visual assessment of [11C]PIB and [18F]FDDNP PET images
- Comparison of 18F-FDG and PiB PET in Cognitive Impairment
- Characterization of PiB Binding to White Matter in Alzheimer Disease and Other Dementias
- Amyloid load in Parkinson's disease dementia and Lewy body dementia measured with [11C]PIB positron emission tomography
- Voxel-Based Analysis of 11C-PIB Scans for Diagnosing Alzheimer's Disease
- Role of imaging techniques in the diagnosis of dementia