


Abstract
Alzheimer disease is the cause of up to one-third of cases of primary progressive aphasia or corticobasal syndrome. The primary objective of this study was to determine the accuracy of 18F-FDG PET metabolic imaging for the detection of Alzheimer disease in patients with primary progressive aphasia or corticobasal syndrome. Methods: A cohort of patients (n = 94), including those with an expert clinical diagnosis of logopenic (n = 19), nonfluent (n = 16), or semantic (n = 13) variants of primary progressive aphasia, corticobasal syndrome (n = 14), or Alzheimer disease (n = 24), underwent 18F-FDG metabolic and 11C-labeled Pittsburgh compound B (11C-PiB) amyloid PET brain imaging. 18F-FDG PET scans interpreted with Neurostat and 3D-SSP displays were classified as revealing Alzheimer disease or “other” by interpreters who were unaware of the clinical assessments and 11C-PiB PET results. 11C-PiB PET imaging was considered to be the diagnostic reference standard, with a threshold standardized uptake value ratio of 1.5 being indicative of Alzheimer disease pathology. To address possible bias from subgroup selection for the Alzheimer disease binary classifier, we calculated both conventional and balanced accuracies. Results: Diagnoses of Alzheimer disease based on 18F-FDG PET resulted in 84% accuracy (both conventional and balanced). In comparison, diagnoses based on clinical assessments resulted in 65% conventional accuracy and 67% balanced accuracy. Conclusion: Brain 18F-FDG PET scans interpreted with Neurostat and 3D-SSP displays accurately detected Alzheimer disease in patients with primary progressive aphasia or corticobasal syndrome as focal-onset dementias. In such diagnostically challenging cohorts, 18F-FDG PET imaging can provide more accurate diagnoses, enabling more appropriate therapy.
Although a prototypical presentation exists conceptually for Alzheimer disease (AD), heterogeneous variations in onset, progression, symptoms, and markers have been studied and associated with anatomically focal variants. These variants may have clinical features similar to those of Pick disease or frontotemporal dementia (FTD), corticobasal syndrome (CBS), posterior cortical atrophy, primary progressive aphasia (PPA), and language-onset dementias (1–3).
Differentiation of these focal variants of AD must also be studied within the context of any pathophysiologic differences among the 3 major cortical dementias and their presumed distinguishing anatomic loci: AD in the parietotemporal cortex, FTD in the frontotemporal cortex, and Lewy body dementia in the occipitotemporal cortex. When possibly involving the temporal lobe and associated language centers—with the consequence of affecting the ability to process language—any of these disorders may be confounded with variants of PPA (4), including the logopenic (PPA-L), nonfluent/agrammatic (PPA-G), and semantic (PPA-S) variants.
PPA was originally defined by Mesulam and Weintraub (5), its variants were classified with formal criteria by Gorno-Tempini et al. (6), and it was reviewed more recently in association with the asymmetry and heterogeneity of AD and FTD by Mesulam et al. (7). With regard to speech and language pathology, the terms dysarthria, apraxia, and aphasia should be distinguished. As clinical pathologic phenomena, they may occur together and thus can be difficult to differentiate when present in association with a neurodegenerative disorder (8).
PET brain metabolic imaging with 18F-FDG for AD was originally developed in the early 1980s by Benson et al. (9) and Alavi et al. (10). A variety of literature reviews were published recently; they include reviews addressing safety and effectiveness by Bohnen et al. (11), multicenter studies and clinical trials by Herholz et al. (12), and patterns of hypometabolism by Brown et al. (13). PET brain amyloid imaging with 11C-labeled Pittsburgh compound B (11C-PiB) for AD was developed in the 2000s by Mathis et al. (14) and Klunk et al. (15). In addition, amyloid imaging with radiotracers other than 11C-PiB was developed and reviewed in the past decade by Rowe et al. (16) and Rowe and Villemagne (17).
In this article, we report an observational study on a patient population selected for focal-onset variants of AD and related syndromes, including PPA variants and CBS. All patients in the study received clinical evaluations, 18F-FDG PET scans, and 11C-PiB PET scans. The main objectives of the study were to determine the accuracy of 18F-FDG PET metabolic imaging as a diagnostic marker for the detection of AD when referenced for the same patient to 11C-PiB PET amyloid imaging as the gold standard of truth in the absence of a postmortem histopathologic diagnosis; to compare the accuracy of clinical evaluations by expert clinicians as a diagnostic marker for the detection of AD when referenced to the same standard of truth, that is, the 11C-PiB PET scan for each patient; to examine a variety of different subgroups selected from the study population to evaluate the performance of statistical measures across different subgroups; and to complete the data analysis for all subgroups with a variety of these measures, including positive and negative predictive values, positive and negative likelihood ratios, sensitivity, specificity, and both conventional accuracy and balanced accuracy measures, to address possible bias from subgroup selection in the study population.
MATERIALS AND METHODS
Patients were referred by their treating physicians to either Austin Hospital in Melbourne, Victoria, Australia, or Neuroscience Research Australia in Sydney, New South Wales, Australia, where they were evaluated by expert clinicians. The demographics and psychometrics for a subset of the patient cohort were characterized previously (18). Table 1 summarizes the age and sex demographics for the entire cohort in the present study (n = 94). All patients were diagnosed by neurology experts as having AD, a variant of PPA, or CBS on the basis of diagnostic and validated consensus criteria (6,18–20). Patients diagnosed with posterior cortical atrophy were excluded from the study because of the predictable pathology for posterior cortical atrophy, which minimizes the benefits of imaging. Patients selected for the study were then recruited to participate in a clinical research protocol approved by the Austin Hospital Research Ethics Unit. All patients signed written informed consent for PET brain imaging scans and participation in the study.
Demographics of Selected Subgroups in Study Cohort
Consenting participants each underwent both 18F-FDG PET brain metabolic imaging and 11C-PiB PET brain amyloid imaging at the Austin Hospital with previously described PET scanning protocols and scan analysis procedures (16,21). Amyloid and metabolic scans for each patient were done on the same day; the 11C-PiB scan was performed first, and the 18F-FDG scan was performed a minimum of 2 h after the injection of 11C-PiB. Clinical diagnoses were made independently and preceded the scans. 11C-PiB amyloid scans, considered the diagnostic reference standard, were classified as revealing AD or not AD by quantitative analysis with a threshold standardized uptake value ratio of 1.5, indicative of AD pathology (22). 18F-FDG metabolic scans were classified as revealing AD or “other” by visual interpretation with Neurostat and 3D-SSP (Department of Radiology, University of Washington) stereotactic surface projection software (23) by image interpreters who were unaware of both the subjective clinical diagnoses and the objective imaging results from the amyloid scans. Examples of 18F-FDG PET scan patterns displayed as cortical surface projections by Neurostat 3D-SSP are shown in Figure 1.
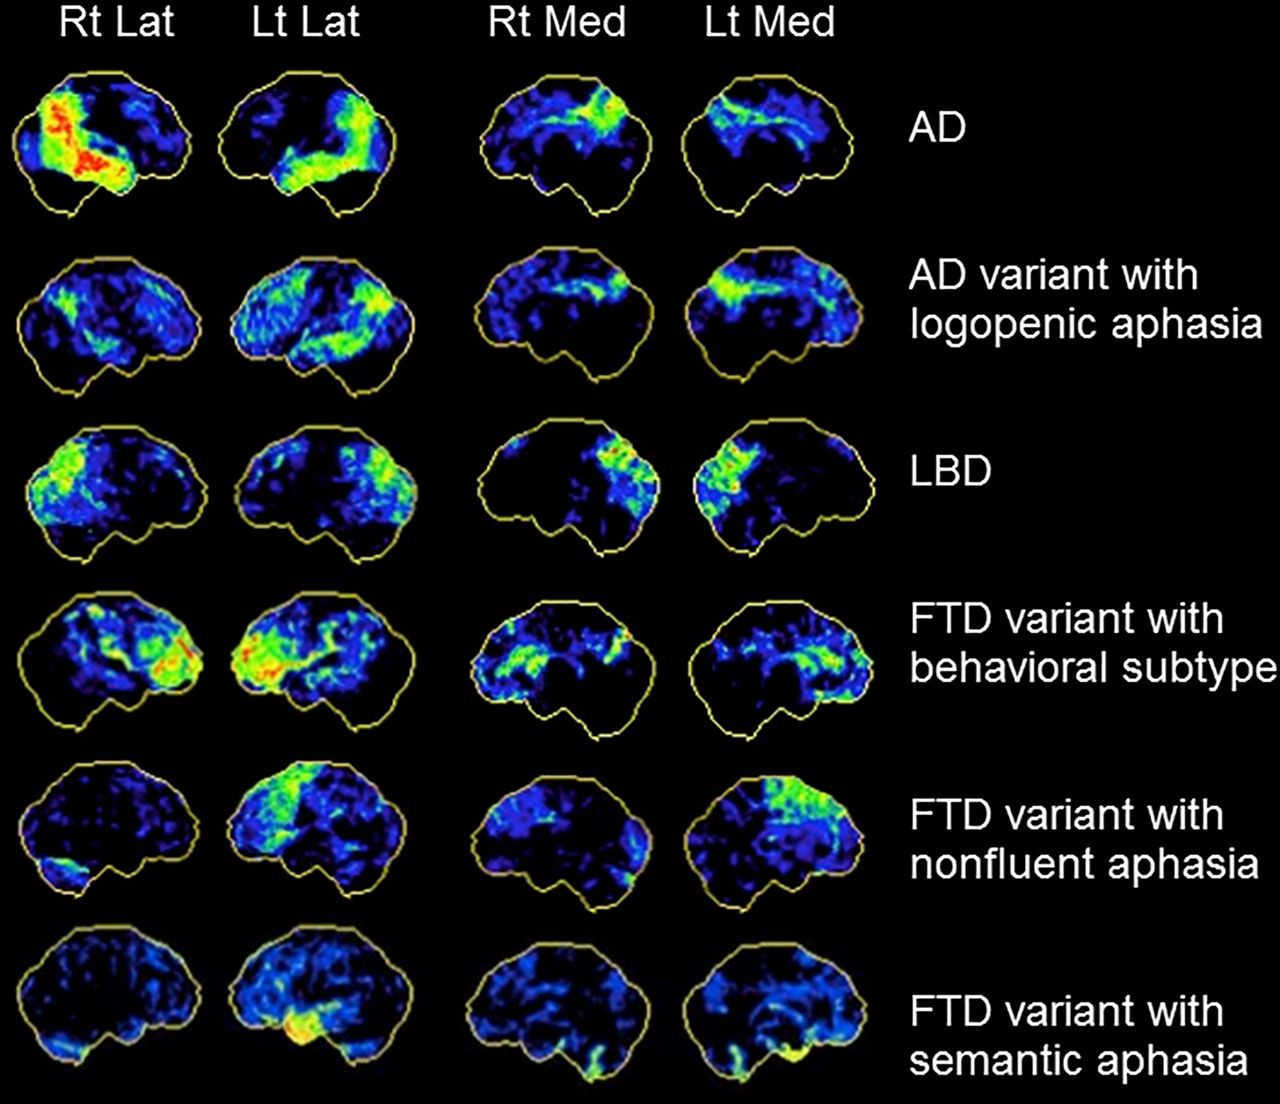
18F-FDG PET scan patterns displayed by Neurostat 3D-SSP for focal-onset dementias. Lat = lateral; LBD = Lewy body dementia; Lt = left; Med = medial; Rt = right.
For the calculation of AD prevalence rates, each 18F-FDG PET scan was classified as revealing AD only if at least 3 of the 4 image interpreters diagnosed AD. The Fleiss κ statistic was estimated as a measure of agreement between interpreters to evaluate interrater reliability (24). For training, interpreters were provided with Figure 1 by a PET brain imaging expert and instructed on how to use the patterns as a reference with which to classify each 18F-FDG PET scan. Each scan in the training montage was derived from a single patient for whom expert clinical diagnosis and brain amyloid scan results were concordant. For 18F-FDG PET scans that showed hypometabolism in both anterior and posterior brain regions, interpreters were instructed to use the balance method for Neurostat 3D-SSP interpretation as described by Foster et al. (25). This interpretation method attributes frontal and anterior temporal hypometabolism to FTD and parietal, posterior cingulate, and lateral temporal hypometabolism to AD and then guides an interpreter to imagine a pivot point in the middle of the brain. If the visible “weight” of hypometabolism is predominantly anterior, then the scan is classified as showing FTD, whereas if it is predominantly posterior, then the scan is classified as showing AD.
For estimation of the diagnostic accuracies of the AD markers, the performance of a collection of the most common statistical measures was evaluated for the results obtained with each of the different markers used to classify patients in the study with a diagnosis of AD or not AD. The binary classifier for each diagnostic marker can be expressed as a 2 × 2 contingency table with 4 cells for the numbers of true-positive (TP), false-positive (FP), true-negative (TN), and false-negative (FN) results. Traditional measures, including sensitivity, specificity, accuracy, positive and negative predictive values, and positive and negative likelihood ratios, were calculated. Because a binary classifier may yield biased or invalid results for small sample sizes, especially when zero cells are present in the 2 × 2 contingency table, balanced accuracy was calculated in addition to conventional accuracy to address bias possibly introduced by subgroup selection (Table 2) for analysis by the AD binary classifier. Balanced accuracy was defined as the average of the sensitivity and the specificity. Table 3 summarizes the names, acronyms, and formulas for the various measures examined for selected subgroups of the study population of patients.
AD Prevalence Rates in Cohort Subgroups, as Indicated by Clinical and Imaging Diagnostic Markers
Statistical Measures for Diagnostic Accuracy
The diagnostic accuracy measures were analyzed independently for each of the 4 interpreters and then averaged across the interpreters with estimates of mean and variance. SEs for proportions were estimated in the conventional manner as Eq. 1where n is the number of samples used in the denominator to calculate the proportion p. As a simple indicator of small-sample bias evident with major discrepancies between conventional accuracy (CA) and balanced accuracy (BA), the discordance of the accuracies (DA) was defined here as
 Eq. 2the absolute value of their difference. Thus, the SE was interpreted as an estimate of variance, whereas the discordance of the accuracies was interpreted as an estimate of bias.
RESULTS
A total of 94 patients participated in the study; each received clinical evaluations, 11C-PiB PET scans, and 18F-FDG PET scans. Table 1 summarizes the sample sizes and demographics for each of the selected subgroups of patients in the study cohort. Table 2 shows the AD prevalence rates in each of these subgroups of patients, as indicated by the 3 different diagnostic markers, that is, 11C-PiB imaging, 18F-FDG imaging, and clinical evaluations. These prevalence rates, reported both with respect to each subgroup and with respect to the entire cohort, provided a check on the data analysis and demonstrated the variability obtained in rates across different selected subgroups when different diagnostic markers were used.
For both imaging markers, diagnoses were reported simply as AD or not AD. For 11C-PiB imaging, patients were scored as positive for AD on the basis of an objective standardized uptake value ratio of greater than 1.5 and were selected for subgroup 1. For 18F-FDG imaging, patients were scored as positive for AD on the basis of a subjective visual interpretation in Neurostat 3D-SSP that was considered positive by most of the image interpreters and were selected for subgroup 2. However, for the clinical evaluations, diagnoses were reported as AD, PPA-L, PPA-G, PPA-S, CBS, or other, thereby permitting the selection of the corresponding subgroups (3–7) as well as the pooled subgroups (8 and 9). For these clinical evaluations, patients were scored as positive for AD if given a clinical diagnosis of either AD or PPA-L, which is considered to be an AD variant. Prevalence rates for AD-positive scores were then calculated for each of the 3 different diagnostic markers (positive by 11C-PiB imaging, positive by 18F-FDG imaging, and positive by clinical evaluations) in each of the 10 different selected subgroups of patients in the study population.
In the entire cohort (subgroup 10; n = 94), the prevalence rates for AD-positive scores for amyloid imaging, metabolic imaging, and clinical evaluations were, respectively, 0.54, 0.52, and 0.46; the rate for clinical evaluations was about 10% lower than the rate for imaging markers. The rate for clinical evaluations would have been even lower than that for imaging markers if clinical PPA-L had not been considered a variant of clinical AD. Interrater reliability (κ) was estimated to be 0.80, with a 95% confidence interval of 0.78–0.82, for the 4 interpreters of the 18F-FDG PET scans with Neurostat 3D-SSP displays. This result was consistent with the κ value of 0.78 reported previously by Foster et al. (25).
Data from each of the clinically selected subgroups of patients were then further analyzed by comparing the diagnostic accuracy of the clinical evaluation marker with that of the 18F-FDG PET metabolic imaging marker; the 11C-PiB PET amyloid imaging marker was considered to be the gold standard of truth in the absence of a postmortem histopathologic diagnosis. Tables 4 and 5 show the diagnostic accuracy results obtained when clinical evaluations and 18F-FDG PET scans, respectively, were used as diagnostic markers for all statistical measures summarized in Table 3 and clinically selected patient subgroups 3–10 shown in Table 2. Missing values in Tables 4 and 5 could not be calculated because of the small sample size, zero cells in the 2 × 2 contingency table for the binary classifier, and an impossible division by zero in the formula for the statistical measure. The mean balanced accuracy and discordance of the accuracies in individual clinical diagnostic subgroups 3–7 were 0.75 and 0.13, respectively, for 18F-FDG PET scans and 0.50 and 0.30, respectively, for clinical evaluations. Analogously in pooled diagnostic subgroups 8 and 9, the mean balanced accuracy and discordance of the accuracies were 0.81 and 0.05, respectively, for 18F-FDG PET scans and 0.49 and 0.15, respectively, for clinical evaluations. In the entire cohort (subgroup 10; n = 94), the same comparison produced similar results; the mean balanced accuracy and discordance of the accuracies were 0.84 and 0.00, respectively, for 18F-FDG PET scans and 0.67 and 0.02, respectively, for clinical evaluations.
AD Diagnostic Accuracy Estimates for Clinical Evaluations
AD Diagnostic Accuracy Estimates for 18F-FDG PET Scans
In all of these comparisons, the balanced accuracy was higher and the discordance was lower for 18F-FDG PET scans than for clinical evaluations. Over a wider variety of patient groups, greater consistency with higher balanced accuracy and lower discordance implies greater robustness and validity for the diagnostic marker used with the patient group considered in the analysis. As diagnostic markers, 18F-FDG PET scans also performed better than clinical evaluations when the negative predictive value (0.83 vs. 0.57), the negative likelihood ratio (0.18 vs. 0.63), the sensitivity or TP rate (0.85 ± 0.05 [mean ± SE] vs. 0.41 ± 0.07), and the conventional accuracy (0.84 ± 0.04 vs. 0.65 ± 0.05) were considered. For the latter estimates of conventional accuracy with a 95% lower-level confidence limit of 0.76 for 18F-FDG PET scans and a 95% upper-level confidence limit of 0.75 for clinical evaluations, a nonoverlapping statistically significant difference between the 2 markers does exist, demonstrating the more accurate and robust performance of 18F-FDG PET scans than of clinical evaluations.
DISCUSSION
From a risk–benefit perspective, 18F-FDG PET metabolic imaging has been considered to be appropriate for the evaluation of AD by many clinicians and investigators for at least a decade, since the publication of a 2002 cost analysis by Silverman and Small (26). That same year, Silverman et al. also published a compelling individual case presentation (27) demonstrating the important benefit obtained with PET metabolic imaging, as shown by its ability to detect AD in a patient who had been given multiple prior incorrect diagnoses of other neuropsychiatric disorders over the course of several years. During the past decade, many studies and literature reviews (28–31) have demonstrated both the utility and the validity of PET metabolic imaging for evaluating dementia and related neurodegenerative disorders.
Relevant to the present study on PET brain imaging markers and metrics, several studies and reviews (25,32–36) evaluated the performance of various metrics derived from 18F-FDG PET metabolic imaging as markers for the detection of AD. This past work demonstrated that compared with clinical evaluations, PET brain imaging has higher sensitivity, specificity, and accuracy for the detection of AD and increases the treating physician’s level of confidence in diagnosing AD and in differentiating AD from other dementias.
Does the excellent performance of PET metabolic imaging compared with clinical evaluations also hold true for diagnostically challenging cohorts, such as patients with focal variants of AD or cohorts for whom confounding or multiple pathologies (37) may be present? For the cohort of patients investigated in the present study, who had symptoms suggestive of language-onset dementia and clinical diagnoses of AD, CBS, or a PPA variant, we observed diagnostic sensitivity, specificity, conventional accuracy, and balanced accuracy for AD of 0.85, 0.83, 0.84, and 0.84, respectively, with 18F-FDG PET scans and 0.41, 0.93, 0.65, and 0.67, respectively, with clinical evaluations (Tables 4 and 5). The diagnostic accuracy metrics for the 18F-FDG PET scans in the present study remained consistent with the results obtained by other investigators. Interestingly, the results of 84% accuracy, 85% sensitivity, and 83% specificity for our patient cohort matched closely the results of 86% sensitivity and 86% specificity obtained from a metaanalysis of the literature performed 10 y ago by Patwardhan et al. (32). Thus, we have demonstrated that PET metabolic imaging improves diagnosis relative to clinical evaluations for patients with focal-onset variants of AD and that prior estimates of the sensitivity and specificity of 18F-FDG PET imaging for detecting AD have remained stable over the past decade.
In the absence of postmortem histopathologic data for the cohort examined, a major limitation of our study is the possibility of multiple pathologies in at least some of the patients. Wang et al. (37) recently reported that such an occurrence may be common in clinical trials for AD patients. Rabinovici et al. (38) discussed this concern with regard to using 11C-PiB PET and 18F-FDG PET imaging to discriminate AD and FTD in the context of the hypothetical assumption that AD should be amyloid positive but that FTD should be amyloid negative (and tau or ubiquitin positive). Three possible explanations were offered for the presence of positive amyloid scans in patients with clinically diagnosed FTD: nonspecific binding of 11C-PiB to something other than β amyloid, comorbid AD and FTD pathology in the FTD clinical syndrome, and AD pathology mimicking an FTD phenotype. However, for the limited number of patients (n = 12) in the cohort from whom autopsy data were obtained (39), the results of 11C-PiB PET scans proved correct in every case.
Small sample size for some of the subgroups examined could be considered another potential limitation of the present study. Sample size for the present study may refer to the number of experts (the number of image interpreters or clinical experts) or the number of patients. Bias introduced by small sample size has a much greater impact in combination, that is, when there are both small numbers of experts and small numbers of patients. For this reason, we introduced the use of balanced accuracy and the discordance of the accuracies (difference between conventional accuracy and balanced accuracy) for studies of smaller subpopulations selected from a larger study population. Of the various metrics used to analyze diagnostic accuracy (including predictive values and likelihood ratios), we found balanced accuracy to be the most useful and robust, across a large diversity of subgroups with a small sample size (Tables 4 and 5), as an indicator of bias and potential problems. However, the limitation related to small sample size should not apply to our main results and conclusions based on subgroup 10, which represented the entire cohort, with a larger sample size (n = 94).
CONCLUSION
18F-FDG PET brain scans interpreted visually with stereotactic surface projection displays produced by Neurostat 3D-SSP software can accurately detect AD in patients with symptoms suggestive of language-onset dementia or a related syndrome as a focal variant of AD. In such diagnostically challenging cohorts, 18F-FDG PET brain scans can enhance clinical evaluations by adding objective data facilitating sensitive, specific, and accurate diagnoses in a more consistent manner than can be provided by even expert diagnosticians. Thus, 18F-FDG PET brain scans can be used as a reliable alternative to provide confirmation of anatomic localization for focal-onset dementias and may be more widely available than expert diagnosticians in some clinical practice locations. Future studies should continue to explore the relative abilities of metabolic imaging in comparison with amyloid imaging for revealing specific regional patterns of radiopharmaceutical uptake and retention in each clinical phenotype and endophenotype. In the meantime, the radiopharmaceutical 18F-FDG should remain less expensive and more likely to be covered by insurance than newly patented radiopharmaceuticals for amyloid imaging in many clinical practice locations for the duration of the patents. Finally, earlier diagnosis with greater robustness and validity for diverse cohorts will enable more appropriate and effective therapy.
DISCLOSURE
The costs of publication of this article were defrayed in part by the payment of page charges. Therefore, and solely to indicate this fact, this article is hereby marked “advertisement” in accordance with 18 USC section 1734. Funding was provided by Australian National Health and Medical Research Council (NHMRC) grants 603489, 1011689, 1037746, and 10475151; NHMRC Early Career Fellowship 1072451 to James R. Burrell; NHMRC Career Development Fellowship APP1022684 to Olivier Piguet; Australian Research Council (ARC) grant CE110001021; ARC Future Fellowship FT120100355 to Kirrie J. Ballard; and University of Sydney DVC Postdoctoral Fellowship S0716U2644 to Cristian E. Leyton. No other potential conflict of interest relevant to this article was reported.
Acknowledgments
We thank Sharon Savage, Kerryn Pike, Gareth Jones, and Fiona Lamb for their assistance with this study. A preliminary abstract of this work was presented at the 2014 SNMMI Annual Meeting.
Footnotes
Published online Aug. 6, 2015.
- © 2015 by the Society of Nuclear Medicine and Molecular Imaging, Inc.
REFERENCES
- Received for publication May 19, 2015.
- Accepted for publication July 20, 2015.


