


Abstract
This study compared several parametric imaging methods to determine the optimal approach for visual assessment of parametric Pittsburgh compound-B (11C-PIB) PET images to detect cortical amyloid deposition in different memory clinic patient groups. Methods: Dynamic 11C-PIB scanning of 120 memory clinic patients was performed. Parametric nondisplaceable binding potential (BPND) images were compared with standardized uptake value (SUV) and SUV ratio images. Images were visually assessed by 3 independent readers, and both interreader and intermethod agreement was determined. Results: Both 90-min (Fleiss κ = 0.88) and 60-min (Fleiss κ = 0.89) BPND images showed excellent interreader agreement, whereas agreement was good to moderate for SUV ratio images (Fleiss κ = 0.68) and SUV images (Fleiss κ = 0.59). Intermethod agreement varied substantially between readers, although BPND images consistently showed the best performance. Conclusion: The use of BPND images provided the highest interreader and intermethod agreement and is therefore the method of choice for optimal visual interpretation of 11C-PIB PET scans.
Alzheimer disease (AD), the most common cause of dementia, is characterized by accumulation of the protein amyloid-β, which starts more than a decade before clinical symptoms occur (1). Recently, it has become possible to visualize and quantify this deposition in vivo using PET and the radiotracer Pittsburgh compound-B (11C-PIB) (2). 11C-PIB PET may be useful for distinguishing AD from other types of dementia, such as frontotemporal dementia and corticobasal degeneration (3,4). In patients with mild cognitive impairment (MCI), increased 11C-PIB binding is predictive of conversion to AD (5,6). These findings underline the great potential of 11C-PIB PET for early and accurate diagnosis of AD in different memory clinic patient groups.
In research applications, emphasis has been on quantitative or semiquantitative analysis of 11C-PIB images. Receptor parametric mapping with fixed efflux rate constant (RPM2) has appeared to be more reliable quantitatively (7), although the main disadvantage of RPM2 compared with standardized uptake value ratio (SUVr) is a longer scan duration. For clinical purposes, visual interpretation of 11C-PIB images may be sufficient rather than deriving quantitative measures. Previous studies have found a good correlation between visual interpretation of 11C-PIB images and clinical diagnosis using either SUVr or RPM2 images (8–10). The aim of the present study was to compare the different parametric imaging methods to determine the optimal approach for visual assessment of 11C-PIB images.
MATERIALS AND METHODS
Subjects
A total of 120 subjects with 11C-PIB PET data available were included from the memory clinic–based Amsterdam Dementia Cohort. Clinical diagnosis was established without awareness of PET results and after a standard dementia screening (11). Thirty patients met the criteria of the National Institute on Aging–Alzheimer’s Association for probable AD (12). Thirty patients were diagnosed as having non-AD dementia, including frontotemporal lobe dementia (13), Lewy body dementia (14), corticobasal degeneration (15), progressive supranuclear palsy (16), and vascular dementia (17). Thirty patients met the criteria of Petersen et al. (18) for MCI. The control group consisted of 30 subjects with subjective complaints or controls who had been recruited through advertisements in newspapers. Written informed consent was obtained from all patients. The Medical Ethics Review Committee of the VU University Medical Center approved this study.
PET
Dynamic PET scans were obtained using an ECAT EXACT HR+ scanner (Siemens/CTI) (19). The mean (±SD) injected activity was 369 ± 25 MBq and did not differ between groups (P = 0.57). Scanning was performed 4 ± 3 mo after the clinical diagnosis was made.
After 11C-PIB injection, 4 different parametric 11C-PIB images were generated: nondisplaceable binding potential (BPND) images using RPM2 applied to data from 0 to 60 min, BPND images using RPM2 applied to data from 0 to 90 min, SUV images of the 60- to 90-min interval (adjusted for injected mass and body weight), and SUVr images of the 60- to 90-min interval. For RPM2 and SUVr, cerebellar gray matter was used as reference tissue.
Three independent nuclear medicine physicians, masked to clinical information and MR imaging, assessed all images in a randomized order. The level of experience in visual reading of 11C-PIB images differed among readers. The most experienced reader rated multiple 11C-PIB images each week, the second had substantial experience, and the third was a nuclear medicine physician in training.
Before definitive visual reading, a training session was conducted including mutual reading of 60 images, which had been generated by all 4 parametric methods based on data from 15 subjects not included in this study.
Transverse, sagittal, and coronal views were shown in the software package Vinci 2.56 (MPI für neurologische Forschung). Raters were able to scroll through the slices in the above-mentioned orientations and scale images manually using rainbow color scaling. Images were rated as either 11C-PIB–positive (binding in more than one cortical brain region, that is, frontal, parietal, temporal, or occipital) or 11C-PIB–negative (predominantly white matter binding).
Statistics
Differences between groups for baseline characteristics were assessed using ANOVA with post hoc Bonferroni, Kruskal–Wallis, and χ2 tests, when appropriate. A P value of less than 0.05 was considered significant. Cohen κ for assessment of intermethod agreement between 2 methods and Fleiss κ for assessment of interreader agreement among 3 readers were calculated using SAS for Windows (Microsoft), version 9.2 (SAS Institute). Both were considered poor if κ was less than 0.20, satisfactory if κ was 0.21–0.40, moderate if κ was 0.41–0.60, good if κ was 0.61–0.80, and excellent if κ was more than 0.80.
RESULTS
The diagnostic groups did not significantly differ with respect to age (66 ± 8 y) or sex (33% female). As expected, controls scored higher on the Mini-Mental State Examination (score of 29) than MCI patients (score of 27, P < 0.05), who in turn scored higher than AD patients (score of 22, P < 0.001) and non-AD dementia patients (score of 24, P < 0.05). Furthermore, using 90-min BPND images, 93% of the AD patients were PIB-positive, followed by MCI patients (50%), healthy subjects (33%), and non-AD dementia patients (30%).
Interreader Agreement
Interreader agreement was excellent for visual assessment of 90-min BPND images (Fleiss κ = 0.88) and 60-min BPND images (Fleiss κ = 0.89), good for SUVr images (Fleiss κ = 0.68), and moderate for SUV images (Fleiss κ = 0.59; Table 1).
Interreader Agreement (Fleiss κ)
Between diagnostic groups, complete interreader agreement was found in the AD group (Fleiss κ = 1.0) for all analytic methods. For the other diagnostic groups, the highest agreement was found for both 60-min (Fleiss κ = 0.82–0.89) and 90-min BPND images (Fleiss κ = 0.76–0.91), followed by SUVr images (Fleiss κ = 0.52–0.73) and SUV images (Fleiss κ = 0.44–0.56) (Table 1).
Intermethod Agreement
Intermethod agreement differed among readers, with moderate to good agreement (Fleiss κ = 0.54) between analytic methods seen in the reader with substantial experience and excellent agreement between analytic methods (Fleiss κ = 0.92) seen in the reader with most experience (Table 2). The least experienced reader showed intermediate results with good to excellent agreement (Fleiss κ = 0.79). Only for the comparison of 60-min and 90-min BPND images was intermethod agreement good to excellent (Cohen κ = 0.74–0.88) for all 3 readers.
Intermethod Agreement
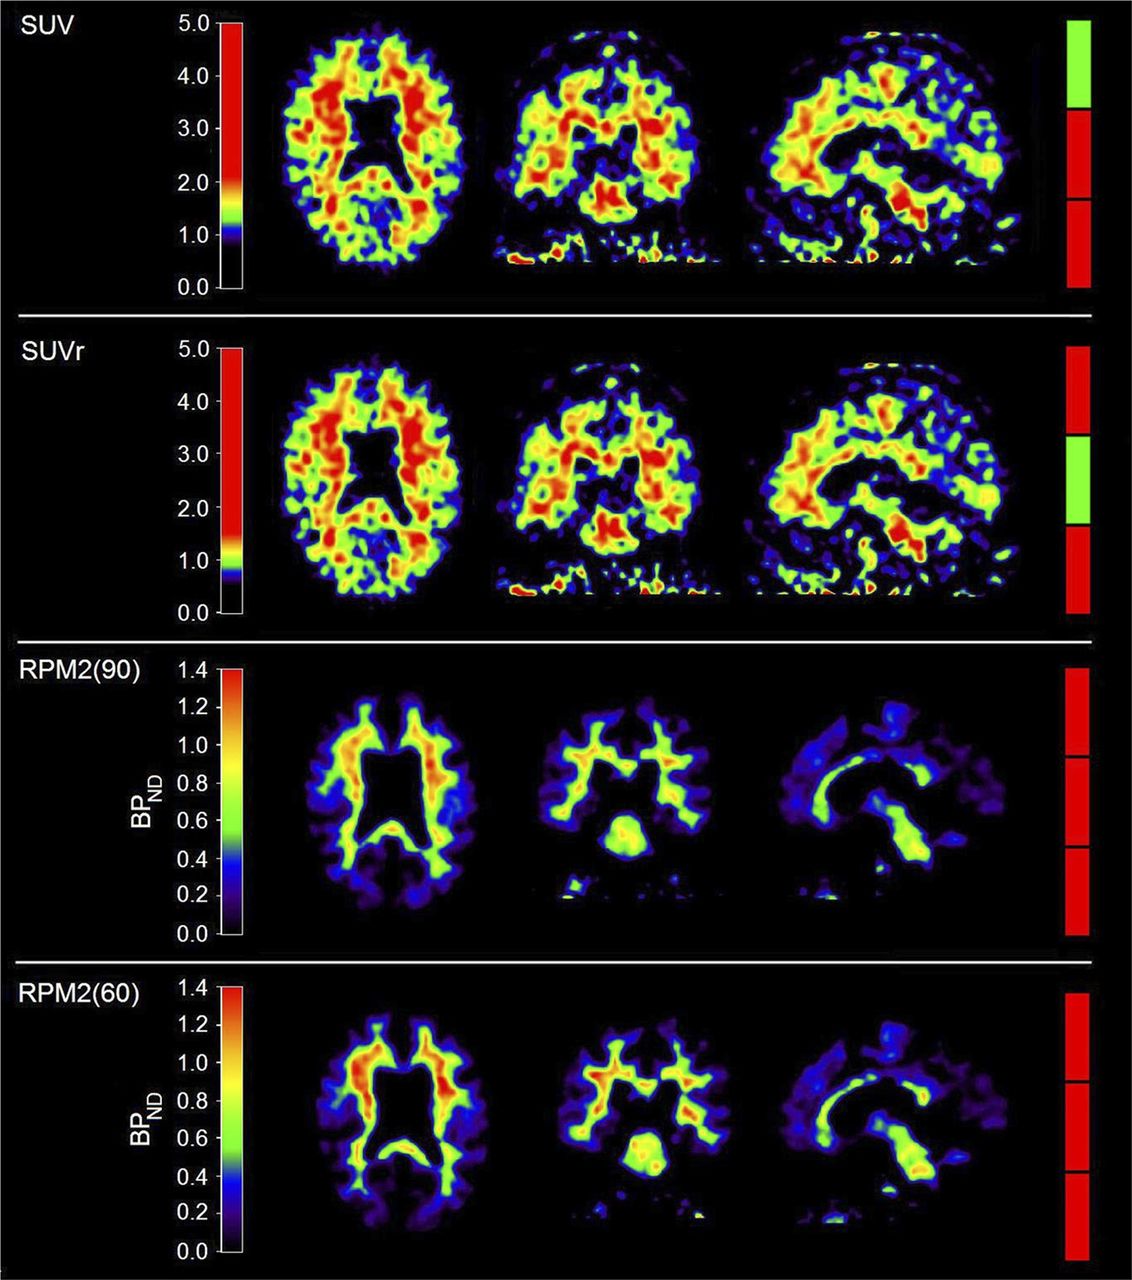
Figure 1 shows an example of disagreement in visual rating of 11C-PIB images of a frontotemporal dementia patient. Overall, the rating was 11C-PIB–positive in 57% of the SUV images, 59% of the SUVr images, 51% of the 90-min BPND images, and 49% of the 60-min BPND images.

Example of visual interreader disagreement about different parametric 11C-PIB images. From left to right are shown axial, coronal, and sagittal views. Colored bars on right indicate visual interpretation by 3 independent readers, with green indicating 11C-PIB-positive rating and red 11C-PIB-negative rating. RPM2(90) and RPM2(60) indicate RPM2 applied on 90- and 60-min scans, respectively.
DISCUSSION
In the present study, excellent interreader agreement for visual interpretation of 11C-PIB BPND images was found, with moderate to good agreement for SUVr and SUV images. Intermethod agreement varied substantially among readers, although both 60-min and 90-min BPND images consistently showed the best performance.
In accordance with previous studies, excellent interreader agreement for all investigated methods was found in the case of patients diagnosed with AD. In non-AD dementia patients, MCI patients, and controls, however, agreement among readers was poorer. A possible explanation is that amyloid deposition is a very early event and therefore a borderline amyloid load is seen mostly in the prodromal stages of AD. In addition, amyloid deposition can also be found in dementia with Lewy bodies, although this is generally lower and more variable than in AD (20). This variety in levels of amyloid deposition may lead to increased difficulty in visual reading, resulting in lower interreader agreement.
Substantial variation in reader performance was found with regard to intermethod agreement over the various methods, predominantly in the less experienced readers. Therefore, reading experience may have an impact on visual interpretation, and extensive training may be necessary to overcome the difficulty in reading SUV and SUVr images.
The best interreader agreement was found for BPND images. A disadvantage of the RPM2 method is the need for longer (dynamic) scans, which increase patient burden and the risk of patient motion. In the present study, 90- and 60-min BPND images showed comparable results regarding both interreader and intermethod agreement. Therefore, scan duration for BPND images used for visual interpretation may be limited to 60 min.
A major limitation of this study is the lack of a gold standard, as no postmortem data were available, hampering relating the findings to underlying neuropathology. Furthermore, because the time interval commonly used for generating SUVr images varies greatly, results cannot be generalized to SUVr images generated using other time intervals. We chose the 60- to 90-min interval because this is when pseudoequilibrium is nearly achieved (7).
These findings are important in light of new 18F-labeled amyloid tracers that are expected to become widely available in the next few years to obtain SUVr images for clinical use. In addition, these tracers show lower target-to-background ratios than 11C-PIB and higher white matter binding, which may increase reading difficulty. Therefore, caution is necessary for accurate reading of these newly available clinical tools.
CONCLUSION
BPND images showed the highest interreader and intermethod agreement in visual interpretation of 11C-PIB images in the different memory clinic patient groups. It is therefore the method of choice for optimal visual interpretation of 11C-PIB images. Reading experience may have an impact on visual interpretation, especially for SUVr and SUV images. Extensive training may be necessary to overcome the difficulty in reading SUV and SUVr images.
DISCLOSURE
The costs of publication of this article were defrayed in part by the payment of page charges. Therefore, and solely to indicate this fact, this article is hereby marked “advertisement” in accordance with 18 USC section 1734. This study was performed within the framework of the Center for Translational Molecular Medicine (www.ctmm.nl), project LeARN (grant 02N-101). It was financially supported by the Internationale Stichting Alzheimer Onderzoek (ISAO, grant 05512) and the American Health Assistance Foundation (AHAF, grant A2005-026). The VUmc Alzheimer center is supported by Alzheimer Nederland and Stichting VUmc Fonds and Stichting Diorapthe. No other potential conflict of interest relevant to this article was reported.
Footnotes
Published online Jun. 2, 2014.
- © 2014 by the Society of Nuclear Medicine and Molecular Imaging, Inc.
REFERENCES
- Received for publication February 17, 2014.
- Accepted for publication April 19, 2014.


Jump to section
Related Articles
Cited By...
- Performance of a [18F]Flortaucipir PET Visual Read Method Across the Alzheimer Disease Continuum and in Dementia With Lewy Bodies
- Assessing Amyloid Pathology in Cognitively Normal Subjects Using 18F-Flutemetamol PET: Comparing Visual Reads and Quantitative Methods
- PET Amyloid Analyses
- Standardized Expression of 18F-NAV4694 and 11C-PiB {beta}-Amyloid PET Results with the Centiloid Scale
- Performance of 11C-Pittsburgh Compound B PET Binding Potential Images in the Detection of Amyloid Deposits on Equivocal Static Images