


Abstract
The goal of this study was to clarify whether binding potential (BP) images using 11C-Pittsburgh compound B (11C-PiB) and dynamic PET can reliably detect cortical amyloid deposits for patients whose 11C-PiB PET static images are ambiguous and whether visual ratings are affected by white matter retention. Methods: Static and BP images were constructed for 85 consecutive patients with cognitive impairment after 11C-PiB dynamic PET. Cortical uptake was visually assessed as positive, negative, or equivocal for both types of images. Quantitatively, the standardized uptake value ratio (SUVR) from the static image, the nondisplaceable BP from the dynamic image for mean gray matter uptake, and the ratio of gray matter uptake to white matter retention were compared among 11C-PiB–positive, 11C-PiB–equivocal, and 11C-PiB–negative groups. Results: Forty-three scans were visually assessed as 11C-PiB–positive in both the static and the BP images. Ten scans were 11C-PiB–equivocal in the static images. In 8 of them, the BP images were 11C-PiB–positive, whereas the other 2 were 11C-PiB–equivocal. Thirty-two scans were assessed as 11C-PiB–negative in the static images. In the BP images, 4 were 11C-PiB–positive and 2 were 11C-PiB–equivocal. The mean gray matter uptake of 11C-PiB in SUVR and nondisplaceable BP, respectively, showed statistically significant differences among the 11C-PiB–positive, 11C-PiB–equivocal, and 11C-PiB–negative groups. The ratio of gray matter uptake to white matter retention was lower in the BP images than static images from the 11C-PiB–negative and 11C-PiB–equivocal groups, whereas it was higher in the 11C-PiB–positive group. Conclusion: 11C-PiB PET BP images can clarify visual interpretation of clinical static 11C-PiB–equivocal images by reducing the interference of nonspecific white matter retention. We conclude that 11C-PiB–equivocal PET findings on static images reflect cortical amyloid deposits, which can be verified using BP images. Furthermore, quantitative assessments, such as SUVR and nondisplaceable BP, are of no use for correctly rating equivocal visual findings.
The amyloid imaging tracer 11C-Pittsburgh compound B (11C-PiB) has been developed for in vivo PET imaging of pathology in Alzheimer disease (AD) (1–3). AD is characterized by the presence of amyloid plaques containing fibrillar amyloid β and neurofibrillary tangles as well as significant loss of neurons in the brain (4–6). 11C-PiB ([N-methyl-11C] 2-(4′-methylaminophenyl)-6-hydroxybenzothiazole) is a thioflavin-T derivative, a small molecule known to bind to amyloid proteins (1), and previous studies have indicated that many patients with AD show cerebral cortical 11C-PiB accumulation; this has been corroborated by pathologic studies (7–9).
Cerebral cortical amyloid deposits are commonly rated as 11C-PiB–positive or 11C-PiB–negative based on uptake assessed by 11C-PiB PET. However, the visual evaluation of static images can result in equivocal ratings (10). Nonspecific white matter 11C-PiB retention is believed to conceal slight cortical uptake (11). Conversely, kinetic model–based approaches with dynamic data for reversibly bound radiotracers, such as 11C-PiB, allow for the quantification of parameters that more directly reflect the binding density, therefore making it easier to detect amyloid deposits. Static images and distribution volume images are considered comparable when using 11C-PiB PET after the patient has achieved an equilibrium state (3).
The goal of the present study was to evaluate the visual interpretation of 11C-PiB–equivocal static images, compared with the visual interpretation of binding potential (BP) images, and to evaluate the effect of white matter retention on rating, regardless of whether cortical uptake is present.
MATERIALS AND METHODS
Patient Population
This retrospective study included 85 patients (38 men and 47 women; mean age ± SD, 69.2 ± 10.1 y; mean Mini-Mental State Examination score, 23.4 ± 5.1) who underwent 11C-PiB dynamic PET from June 2011 to December 2013. The study included 26 patients with AD, 20 with mild cognitive impairment, 5 with frontotemporal lobar degeneration, 8 with Lewy body disease, and 26 with no clear diagnosis. We used the diagnostic criteria of the Neurologic and Communicative Disorders and Stroke-Alzheimer Disease and Related Disorders Association for AD (12) as well as the third report of the Dementia with Lewy Bodies Consortium for DLB (13). Patients with mild cognitive impairment and frontotemporal lobar degeneration fulfilled the published criteria (14,15). All subjects underwent 18F-FDG PET screening within 1–175 d (mean, 15.2 d; median, 12 d) of 11C-PiB PET scanning. The institutional ethics committee approved this study, and all subjects or guardians signed a written informed consent form.
Data Acquisition
Data acquisition of 11C-PiB PET and 18F-FDG PET was similar to a previous study (10). In brief, PET scans were obtained using a PET scanner (ECAT Accel; Siemens AG) in the 3-dimensional mode. For 11C-PiB PET, data were continuously acquired for 70 min after intravenous administration of 555 ± 185 MBq of 11C-PiB. For 18F-FDG PET, a 30-min emission scan was acquired, starting 30 min after intravenous injection of 185 MBq of 18F-FDG. This acquisition was solely for the purpose of assisting registration of the other images.
Image Processing
Static images of the 11C-PiB PET scans consisted of the sum of four 5-min frames from 50 to 70 min. For BP images, data analyses were done with the PMOD software package (version 3.308; PMOD Technologies Ltd.) using the full set of dynamic data (0–70 min after injection) as follows: parametric images of regional 11C-PiB uptake (i.e., BP images) were generated using Logan graphical analysis, which referenced the cerebellar cortex (16).
Spatial normalization was performed as follows. Each static and BP image was coregistered with the corresponding 18F-FDG PET image using SPM8 (Wellcome Department of Imaging Neuroscience). First, spatial normalization of the 18F-FDG PET images to the Montreal Neurologic Institute space was performed using the SPM8 program. Next, spatial normalization of the coregistered static and BP images to the Montreal Neurologic Institute space was performed using the individual parameters obtained from 18F-FDG PET normalization.
Image Analysis
The 11C-PiB PET static image and the BP image of all scans were visually assessed by 2 experienced nuclear medicine physicians masked to clinical information (10). In brief, each image was classified as 11C-PiB–positive, 11C-PiB–equivocal, or 11C-PiB–negative. When cortical accumulation was suspected, but cortical accumulation was not greater than in the cerebral white matter (from directly beneath cortex to periventricular region), an equivocal rating was assigned. Any level of 11C-PiB uptake in the white matter was identified as 11C-PiB–negative. In addition, we visually examined whether the static or BP image had more white matter uptake. The degree of gray/white matter contrast was compared between the static and the BP image if the assessment was 11C-PiB–positive or 11C-PiB–equivocal; the length of 11C-PiB accumulation from the periventricular area was compared between the static and the BP image if the assessment was 11C-PiB–negative.
An automated quantitative analysis was performed as follows. Standardized uptake value ratios (SUVRs) (referenced to the cerebellar cortex) and nondisplaceable BP (BPND) were measured using the template volumes of interest (frontal, parietotemporal, precuneus/posterior cingulate, striatum, cerebral white matter, and cerebellar cortex) set in the Montreal Neurologic Institute space. Then, we calculated the mean gray matter SUVR and BPND from the 4 gray matter values. In addition, the ratio of mean gray matter uptake to white matter retention (R-G/WM) of 11C-PiB was calculated to provide a quantitative measure of whether or not nonspecific white matter retention affected the visual ratings.
Furthermore, for other visual and quantitative assessments, because BPND is equal to the distribution volume ratio (DVR) minus a value of 1, as described by Innis et al. (17), we obtained spatially normalized SUVR minus 1 (sn-SUVR – 1) images considered to be equivalent to BP images as in the method of Klumpers et al. (18) and calculated DVR (BPND + 1).
We visually compared not only the static and BP images, but also the sn-SUVR – 1 images and spatially normalized BP (sn-BP) images of individual 11C-PiB PET. Quantitatively, mean gray matter uptake and the R-G/WM of SUVR, BPND, and DVR were compared.
We investigated the effect of nonspecific white matter retention on the visual rating and discussed the true interpretation of 11C-PiB–equivocal static images.
Statistical Analysis
Data are presented as mean ± SD unless otherwise stated. The associations between SUVR and BPND were analyzed using the Pearson correlation coefficient test. One-way ANOVA and the post hoc Tukey–Kramer test were used to assess differences in SUVR, BPND, and DVR values among the 11C-PiB–positive, 11C-PiB–equivocal, and 11C-PiB–negative groups. A P value of less than 0.05 was considered statistically significant.
RESULTS
The results of visual assessments of 11C-PiB PET static and BP images are shown in Table 1. Ten subjects were visually assessed as 11C-PiB–equivocal from the static image; 8 of 10 were visually rated as 11C-PiB–positive from the BP image. Of 32 11C-PiB–negative subjects from the static image, 4 were evaluated as 11C-PiB–positive and 2 as 11C-PiB–equivocal from the BP image. The visual ratings of sn-SUVR – 1 and sn-BP images were the same as the static and BP images, respectively. Regarding visual white matter uptake analysis, 66 scans showed a higher uptake in the static image than in the BP image, and 19 scans showed an equivalent uptake. No scans showed higher white matter uptake in the BP image than in the static image (Table 2). Of 10 subjects whose static PiB rating was equivocal, 9 showed higher white matter uptake in the static image than in the BP image.
Comparison of Visual Assessments of Static and BP Images
Comparison of Visual White Matter Uptake Between Static and BP Images Among 3 Static Rating Groups
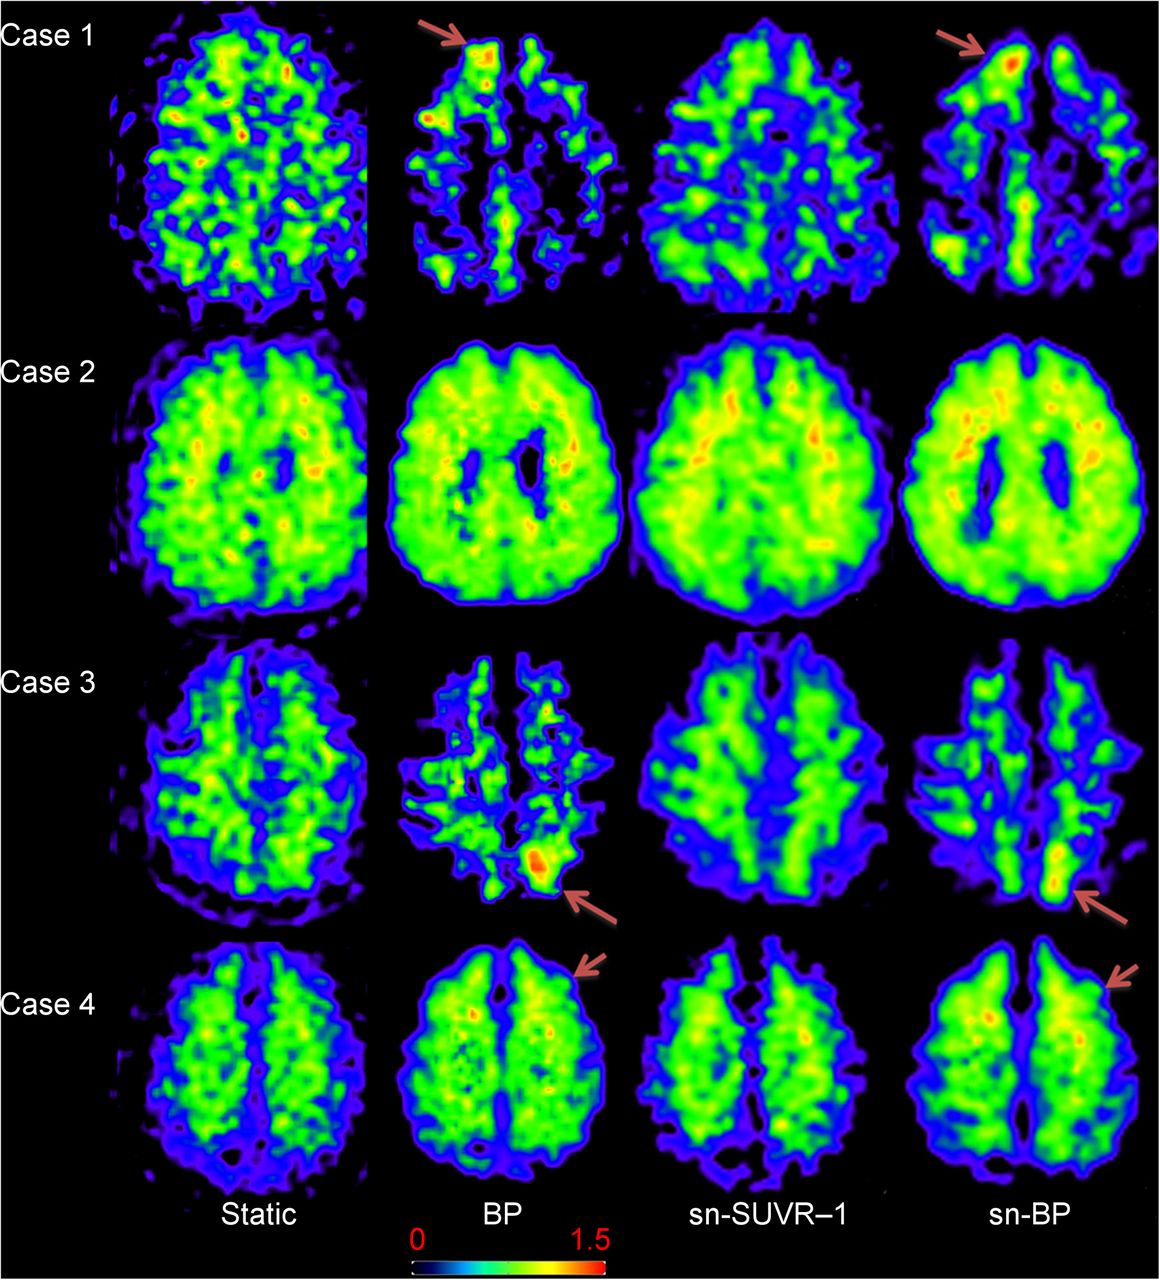
The demographics and results of visual and quantitative assessments of 10 11C-PiB–equivocal subjects and 6 static-negative and BP-nonnegative subjects are shown in Table 3. In 8 static 11C-PiB–equivocal and BP 11C-PiB–positive subjects, 7 visually showed lower white matter uptake in BP images than static images. All 4 static 11C-PiB–negative and BP 11C-PiB–positive subjects also showed lower white matter uptake in the BP images. Three of 4 BP 11C-PiB–equivocal subjects showed equivalent white matter uptake in both static and BP images. Representative images are provided in Figure 1. White matter uptake was visually less in BP and sn-BP images than in static and sn-SUVR images (Fig. 1, cases 1 and 3), resulting in easier detection of cortical uptake on BP and sn-BP images. In contrast, cortical uptake was difficult to detect when white matter uptake was equivalent in static and BP images or in sn-SUVR images and sn-BP images (Fig. 1, cases 2 and 4).
Demographics and Results of 10 11C-PiB–Equivocal and 6 11C-PiB–Negative Subjects

Representative images of subjects with 11C-PiB–different ratings in static, BP, sn-SUVR – 1, and sn-BP images. Case 1 is an 80-y-old man: mild cognitive impairment, SUVR-equivocal, and BP-positive. Case 2 is a 72-y-old woman: AD, SUVR- and BP-equivocal. Case 3 is an 83-y-old man: AD, SUVR-negative and BP-positive. Case 4 is a 74-y-old woman, undiagnosed, SUVR-negative and BP-equivocal. SUVR, BP, sn-SUVR – 1, and sn-BP images are demonstrated in order from left to right. Arrows in cases 1 and 3 show 11C-PiB–positive regions, and those in case 4 show 11C-PiB–equivocal portions. In case 2, extended cortical uptake is suspected.
According to quantitative analyses, a significant correlation was observed between SUVR and BPND for the 11C-PiB PET scans (Fig. 2). There were no negative results for BPND in this investigation. For 11C-PiB–negative, 11C-PiB–equivocal, and 11C-PiB–positive groups, mean gray matter SUVR was 1.02 ± 0.07, 1.50 ± 0.24, and 2.11 ± 0.34, whereas BPND was 0.10 ± 0.09, 0.38 ± 0.27, and 0.44 ± 0.37, respectively, with statistically significant differences (P < 0.01) among the 3 groups (Fig. 3). Although both mean gray matter SUVR and BPND of the 11C-PiB–equivocal group were intermediate between values from the 11C-PiB–negative and 11C-PiB–positive groups, the range of 11C-PiB–equivocal values overlapped with the 11C-PiB–negative and 11C-PiB–positive groups, especially for BPND.
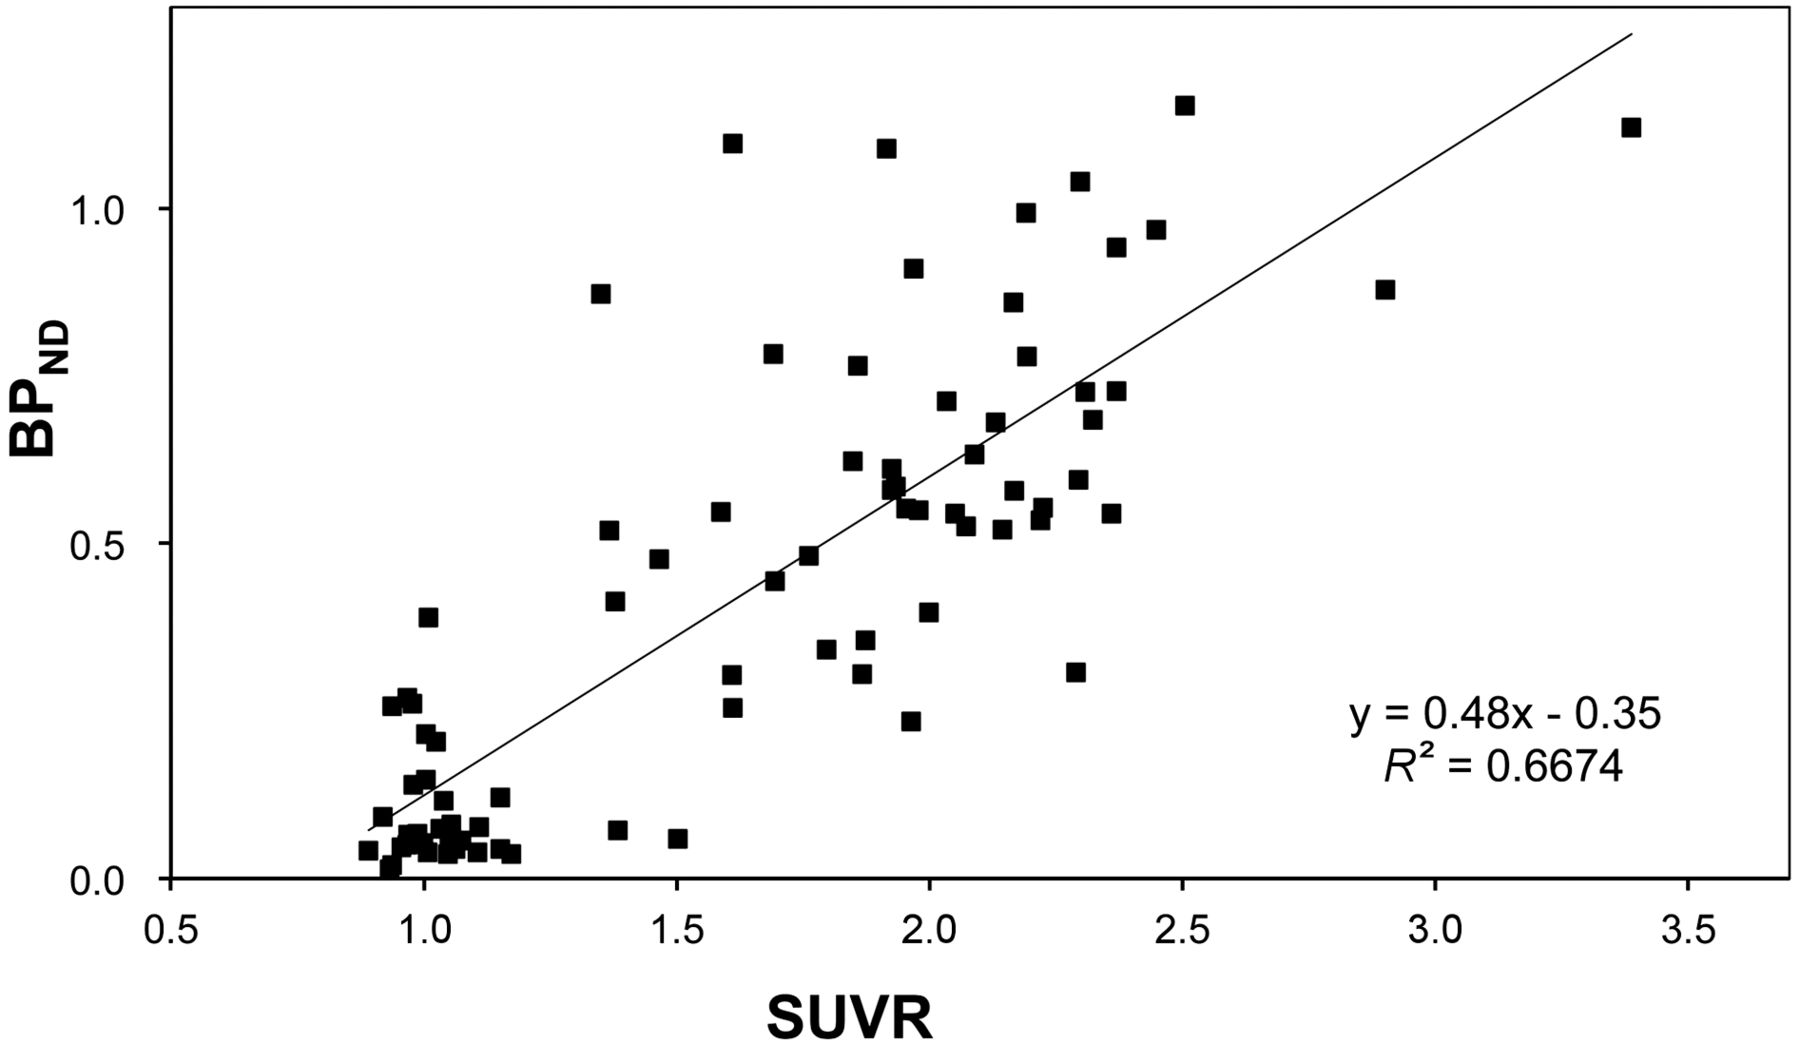
Correlation between mean gray matter SUVR and BPND in all subjects.
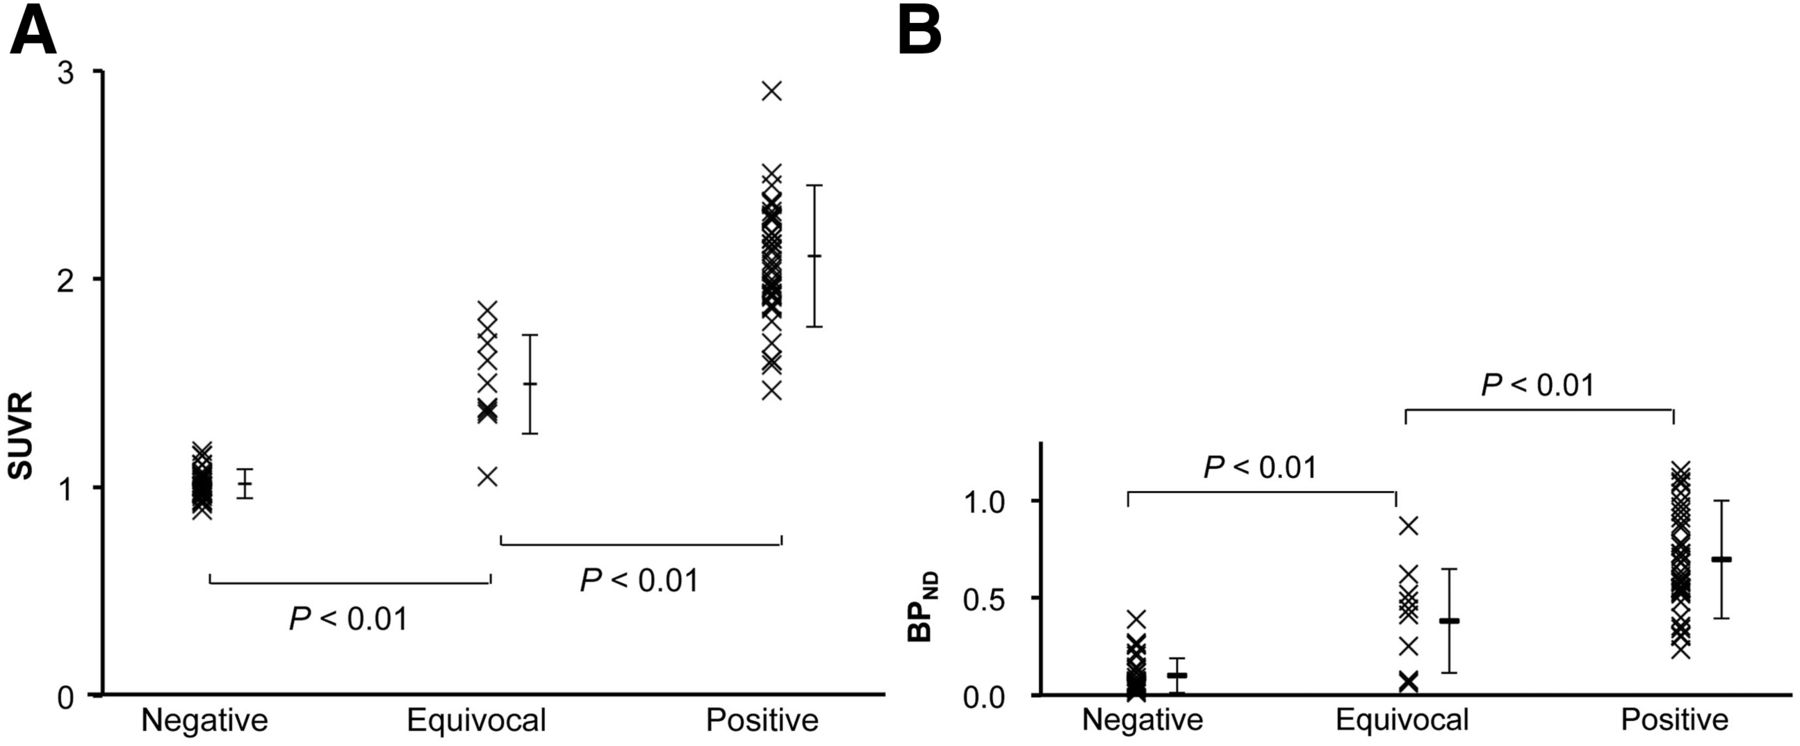
Distribution and values of mean gray matter uptake among 11C-PiB–negative, 11C-PiB–equivocal, and 11C-PiB–positive groups (SUVR [A], BPND [B]).
The R-G/WM of SUVR, BPND, and DVR values calculated for the 3 groups are shown in Figure 4.

Ratio of gray matter 11C-PiB uptake to white matter retention in SUVR (A), BPND (B), and DVR (C) among 11C-PiB–negative, 11C-PiB–equivocal, and 11C-PiB–positive groups.
Of the 3 metrics, BPND showed the largest contrast of R-G/WM between 11C-PiB–negative and 11C-PiB–positive groups. In the static 11C-PiB–positive group, mean R-G/WM was 0.96 in SUVR and 1.07 in DVR, whereas it was 1.20 in BPND. Likewise, in the static 11C-PiB–negative group, mean R-G/WM was 0.56 in SUVR and 0.81 in DVR, whereas it was 0.28 in BPND. The R-G/WM of SUVR was higher than the BPND in the 11C-PiB–negative and 11C-PiB–equivocal groups and lower in the 11C-PiB–positive group. DVR showed the least differences among the 3 groups.
DISCUSSION
Our investigation revealed 4 interesting findings. First, we showed that BP images were visually more sensitive than static images for the detection of cortical 11C-PiB uptake in 11C-PiB static images visually assessed as equivocal. It is sometimes difficult to visually make dichotomized classifications of 11C-PiB PET findings (10). Assessments of in vivo 11C-PiB PET for cortical amyloid deposits have been performed using the distribution volume or DVR with dynamic data, and Price et al. (3) reported that the Logan graphical analysis was practical and reliable. However, 11C-PiB PET static images have been commonly used for clinical purposes, because they do not require dynamic scans and blood sampling. The DVR in PET is defined as the ligand concentration ratio of target tissue and blood at equilibrium, and static images are obtained at equilibrium after radiotracer administration. Therefore, static images and DVR images are considered comparable (19). The BP reflects the receptor concentration and ligand affinity for receptors in the target tissue (20), and BPND is DVR – 1 (3,17–19). Generally, DVR images, not BP images, have been used, because BPND analyses may produce negative values (3,19). The present study compared BP images generated using the Logan graphical analysis with static images. Because static images and BP images produce different results, we compared sn-SUVR – 1 images with sn-BP images. Although sn-SUVR – 1 and sn-BP images are scored as equivalent, ratings of sn-SUVR – 1 were the same as static images. In other words, sn-SUVR – 1 images were not able to detect cortical uptake, whereas sn-BP images could. These results indicate that static and dynamic parametric images are essentially different. Comparisons between static and BP images produced the same visual findings as those between sn-SUVR – 1 and sn-BP images. Therefore, we consider that comparisons between static images and BP images are possible. Zwan et al. compared SUVR images with BP images to determine the optimal approach for visual assessment of 11C-PiB PET; they concluded that BP images were the method of choice for detecting cortical amyloid deposition, because an excellent inter-interpreter agreement was obtained in BP images compared with SUVR images (21). This fact suggests that it is easier to rate cortical 11C-PiB uptake on BP images than on static images. Tracer kinetic analysis can remove nonspecific binding that occurs to sites other than amyloid β, for example, membranes and lipid fractions, metabolites, or vascular activity. Subsequently, parameters, such as DVR or BPND, can be estimated (22). In the present study, 11C-PiB binding to amyloid β is more precise in BP images than in static images. Therefore, we found that BP imaging reduced the rate of static 11C-PiB–equivocal (12%) to 5%.
Second, quantitative assessments, such as SUVR and BPND, were found to be of no use for correctly rating equivocal visual findings. The fact that there was overlap in the ranges of quantitative values for the 3 groups demonstrated that quantification was not helpful for interpreting 11C-PiB–equivocal findings, despite the fact that differences were statistically significant among the 3 groups. In other words, focal or slight cortical 11C-PiB uptake showed low quantitative values in the 11C-PiB–equivocal or 11C-PiB–positive groups. Therefore, visual assessments can detect amyloid β earlier than quantitative analyses, as described by Cohen et al. when they compared visual findings with quantitative analysis of 11C-PiB PET in healthy controls (23).
Third, white matter retention was visually assessed to be greater in static images than in BP images. This demonstrates that lower white matter uptake allows for more sensitive detection of cortical uptake in BP images—that is, the changes of assessments are related to the degree of retention of white matter. The image difference between SUVR and BPND depends on the reference regions. Thus, these results might change depending on the characteristics of participants. We suppose that the detectability of cortical 11C-PiB uptake is visually affected by nonspecific white matter retention (11).
Finally, the ratio of gray matter uptake to white matter retention showed the greatest differences between the 11C-PiB–negative group and the 11C-PiB–positive group in BPND among the 3 metrics—SUVR, BPND, and DVR. This result indicates that visual assessment of a BP image can detect cortical uptake more sensitively than SUVR. In our opinion, these results suggest that BP images detect cortical uptake with more sensitivity than true DVR images. In addition, this finding supports the visual finding of lower nonspecific white matter retention in BP images.
On microscopic examination, no amyloid β deposits are found in white matter (5,11). The exact cause of nonspecific white matter binding of amyloid β tracers, such as 11C-PiB PET, is not known. It has been suggested that binding is largely attributable to slower clearance in white matter due to less blood flow, compared with cortical blood flow (11). Conversely, the reason why white matter binding in BP images is lower than in static images remains unclear. We hypothesized that dynamic data acquisition, starting immediately after radiotracer injection along with appropriate analysis, accounts for more factors, such as slow flow, clearance, and lipophilicity, than static imaging that is acquired at the time of equilibrium.
It has been expected that 18F-labeled amyloid tracers would become widely available to allow for acquisition of SUVR images for clinical use (24–28). However, these tracers, other than 18F-AZD4694, show lower cortical-to-white matter contrast than 11C-PiB PET as well as higher white matter binding, which may increase reading difficulty. Therefore, for these tracers, we suggest that visual assessment of cortical uptake using BP images might be more efficient and more accurate than the visual assessment of static images. As a side note, we point out that the data acquisition time is shorter with 18F-florbetapir and 18F-ADZ4694 than with 11C-PiB (26–28).
Our study has some limitations. First, there was no pathologic material for correlation. Therefore, we were not able to compare the 11C-PiB PET findings with AD pathology to determine sensitivity, specificity, and accuracy of the images. Our finding shows that BPND sensitivity is better. However, because we do not have a gold standard (histologically proven cases), we cannot show the higher specificity of BPND.
Second, because subjects included various patients with or without AD as part of this retrospective study, the results of this research may not reflect pure AD-related amyloid pathology, because amyloid deposits occur in subjects with cerebral amyloid angiopathy (29) and Lewy body disease (30,31) and in cognitively intact subjects (32). Third, because of the small sample size, we were not able to refer to the relationship between visual 11C-PiB–equivocal ratings and quantitative values, 11C-PiB–equivocal and clinical findings including Mini-Mental State Examination, and that of small cortical amyloid deposits and noncognitive older subjects. Fourth, BPND had a wide variation relative to SUVR. We suggest further research to address these limitations.
Finally, in the case of the 2 static 11C-PiB–equivocal scans unsolved by BP analysis, we are unsure what should be done. Perhaps additional research, such as other kinetic analyses or repeated scans, would assist in the diagnosis.
CONCLUSION
Although BP analyses have a higher detection rate of cortical 11C-PiB uptake than static images, these analyses are not practical in clinical situations. Our study demonstrates that most 11C-PiB–equivocal findings on static images show as 11C-PiB–positive on BP images. Therefore, we argue that 11C-PiB–equivocal findings in static images could be considered as 11C-PiB–positive. Furthermore, importantly, we found that quantitative assessments, such as SUVR and BPND, were not helpful for correctly rating equivocal visual findings.
DISCLOSURE
The costs of publication of this article were defrayed in part by the payment of page charges. Therefore, and solely to indicate this fact, this article is hereby marked “advertisement” in accordance with 18 USC section 1734. This study was supported in part by JSPS KAKENHI grant 50534103 and the 21st Century Research and Development Incentive Wages at Kinki University. No other potential conflicts of interest relevant to this article are reported.
Acknowledgments
We thank Yoshiyuki Nakayama for his support for brain 18F-FDG PET and 11C-PiB PET at Kinki University Hospital.
Footnotes
Published online Sep. 10, 2015.
- © 2015 by the Society of Nuclear Medicine and Molecular Imaging, Inc.
REFERENCES
- Received for publication February 24, 2015.
- Accepted for publication August 31, 2015.


Jump to section
Related Articles
Cited By...
- No citing articles found.