


Abstract
A common quantitative output value for PET measures of β-amyloid (Aβ) binding across tracers and methods would allow better comparison of data across sites and application of universal diagnostic and prognostic values. A method has recently been developed that generates a unit of measurement called the centiloid. We applied this method to 2-[2-18F-fluoro-6-(methylamino)-3-pyridinyl]-1-benzofuran-5-ol (18F-NAV4694) and 11C-Pittsburgh compound B (11C-PiB) Aβ images to derive the scaling factor required to express tracer binding in centiloids. Methods: Fifty-five participants, including 10 young controls (33 ± 7 y old), underwent both 11C-PiB and 18F-NAV4694 imaging no more than 3 mo apart, with the images acquired 50–70 min after tracer injection. The images were spatially normalized and analyzed using the standard centiloid method and regions (cortex and whole-cerebellum reference) downloaded from the Global Alzheimer Association Interactive Network website. Results: SUV ratios (SUVRs) showed a strong correlation in tracer binding (18F-NAV4694 SUVR = 1.09 × 11C-PiB SUVR – 0.08, R2 = 0.99). The equation to convert 18F-NAV4694 to centiloids [100 × (18F-NAV4694 SUVR – 1.028)/1.174] was similar to a published equation for 11C-PiB [100 × (11C-PiB SUVR – 1.009)/1.067]. In the young controls, the variance ratio (18F-NAV4694 centiloid SD divided by 11C-PiB centiloid SD) was 0.85. Conclusion: The results for both 11C-PiB and 18F-NAV4694 can now be expressed in centiloids, an important step that should allow better clinical and research use of Aβ imaging. The standard centiloid method also showed that 18F-NAV4694 has slightly higher Aβ binding and lower variance than 11C-PiB, important properties for detecting early Aβ deposition and change over time.
There is wide variability in the numbers and methods used to report quantitative PET measures of β-amyloid (Aβ) tracer binding in the brain (1). Results vary for each of the available tracers because of differences in their specific and nonspecific binding properties and in their recommended reference regions (2–5). Results are also influenced by the timing of the acquisition after tracer administration, the duration of the acquisition, the image reconstruction algorithm used, whether partial-volume correction is applied, the choice and extent of cortical regions, and the type of quantitative method used, such as SUV ratio (SUVR), distribution volume ratio, or binding potential (6–16). Consequently, most imaging labs have had to derive a reference range for their method and tracers or rely on subjective visual interpretation.
This lack of consistency in image analysis methods and highly variable expression of the results impedes the pooling of data across sites and comparison of studies (17). Lack of standardization prevents the application of universal cut points for diagnostic and prognostic purposes (18) and limits comparison of the relative effectiveness of therapies that claim to reduce Aβ burden (17).
An international working party of Aβ imaging researchers has developed a method to standardize quantitative PET measures of Aβ binding by scaling the outcome to the centiloid scale (18). This scale has a zero-centiloid point that corresponds to the mean result from scans of young adults who, based on age, are reasonably assumed to be free of Aβ plaques. The 100-centiloid point corresponds to the mean result from scans of patients with typical Alzheimer disease (AD) of mild severity, the AD stage at which Aβ burden peaks (19,20). Consequently, the measurement unit has been named to reflect the 100-point scale and the application to amyloid, hence the term “centi-loid.”
The data to convert 11C-PiB Aβ PET results to centiloids are available on the Global Alzheimer Association Interactive Network website (GAAIN) (http://www.gaain.org). This website provides free access to a standard cortical volume of interest (VOI) that covers the areas of significant 11C-PiB Aβ binding in AD (Fig. 1A) and a whole-cerebellum VOI (Fig. 1B) for use as the reference region. The standard cortical template was derived by subtracting a mean 11C-PiB image of older healthy subjects (normalized in Montreal Neurological Institute (MNI)–152 space with SPM8 [Wellcome Trust Centre for Neuroimaging]) from a mean 11C-PiB image of AD patients. The resultant subtraction VOI was smoothed and then subjected to a threshold that included only voxels with a difference of more than 1.05 SUVR units. This data-driven VOI includes frontal, temporal, parietal (including precuneus), cingulate, insular, and anterior striatal gray matter (Fig. 1A). The website supplies the linear equation that converts to centiloids the SUVR (obtained by the standard centiloid method) for any 11C-PiB scan acquired from 50 to 70 min after injection. A validation set of 11C-PiB scans and MR scans is also supplied. Users can confirm that they are applying the method correctly by comparing their own results for the validation scans to the results supplied with the validation scans before analyzing their own scans. It is then possible to derive an additional linear equation to convert the results from any in-house analysis method to centiloids by analyzing 11C-PiB images that have been converted to parametric centiloid images by the standard centiloid method (18).
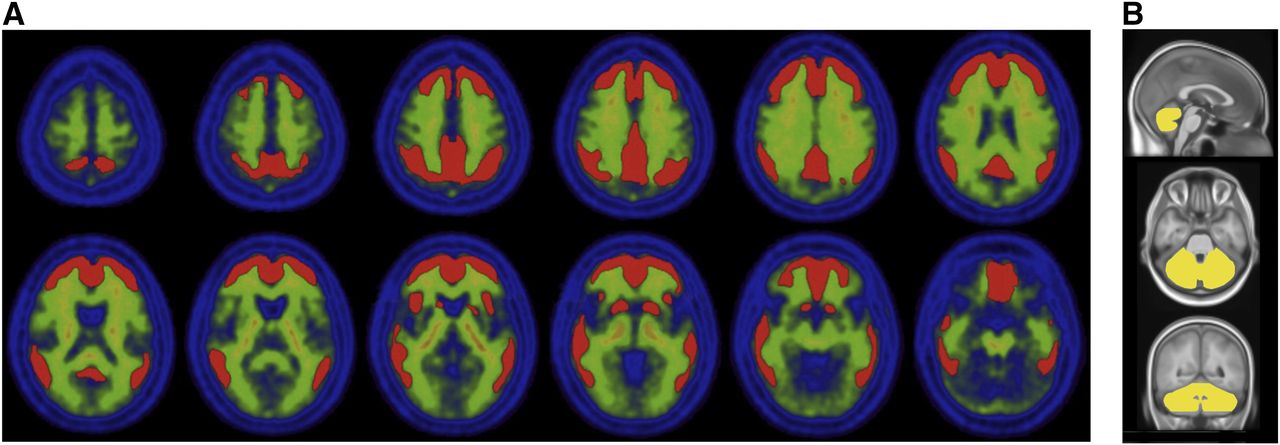
Standard centiloid method. (A) Cortical VOI normalized to MNI-152 space. (B) Whole-cerebellum reference region superimposed on MNI-152 MRI template. (Adapted with permission of (18).)
To convert SUVR to centiloids for a tracer other than 11C-PiB, a site must first obtain matching scans from the same individual using both 11C-PiB and the other tracer, according to the standard centiloid method described by Klunk et al. (18). The matching scans must cover the spectrum of Aβ tracer binding ranging from young controls to patients with mild AD. A linear conversion equation (scaling factor) is then derived from VOIs on these scans to express the results in centiloids. By uploading the matched scans to GAAIN, the site can make them available to other sites wishing to convert their own PET results to centiloids. Furthermore, the other sites can then display a range of their scans as parametric images in centiloids, apply their own in-house analysis method, and derive a second scaling factor that allows their own analysis method to convert the results directly into centiloids (18).
2-[2-18F-fluoro-6-(methylamino)-3-pyridinyl]-1-benzofuran-5-ol (18F-NAV4694, formerly known as AZ4694) is an Aβ imaging radiopharmaceutical that has imaging characteristics nearly identical to those of 11C-PiB but with the convenience of 18F labeling (21,22). The steric structure is similar to that of 11C-PiB (Fig. 2), as are the time–activity curves and blood clearance rates (23). A head-to-head study on a range of healthy older individuals and patients with mild cognitive impairment and AD demonstrated that the images and neocortical SUVRs for 18F-NAV4694 are nearly identical to those for 11C-PiB (24). Like 11C-PiB, 18F-NAV4694 has higher specific cortical binding and lower nonspecific white matter binding than has been reported for other 18F-labeled Aβ radiopharmaceuticals (3,23,25,26).
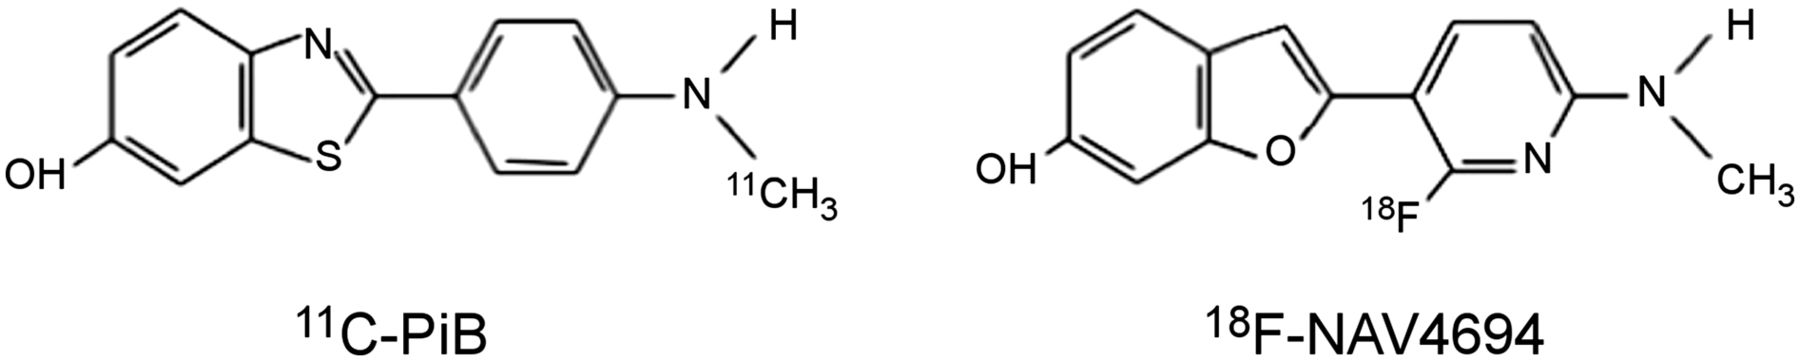
Chemical structures of 11C-PiB and 18F-NAV4694.
In this article, we describe the data acquisition and derived scaling factor required to convert 18F-NAV4694 SUVRs to centiloids.
MATERIALS AND METHODS
The study was approved by the institutional review board of Austin Health, and all subjects signed an informed consent form.
Subjects
Matching 11C-PiB and 18F-NAV4694 PET scans were obtained for 55 subjects. The cohort comprised 10 young controls recruited specifically for this study and a previously published cohort of 25 elderly controls, 10 patients with mild cognitive impairment, 7 patients with mild AD, and 3 patients with frontotemporal dementia (24). All subjects from the previously published cohort were included in this analysis. The demographics of the cohort are shown in Table 1.
Demographics
Scanning
The matching 11C-PiB and 18F-NAV4694 PET scans for each individual were obtained within 3 mo of each other and with a minimum of 2 h between scans if 11C-PiB PET was done first or 24 h if 18F-NAV4694 PET was done first. All scans were acquired on an Allegro PET camera (Philips) in 3-dimensional mode and were processed using a rotating 137Cs point source for attenuation correction. Images were reconstructed using a 3-dimensional row-action maximum likelihood algorithm.
The participants were injected with 370 MBq of 11C-PiB and 250 MBq of 18F-NAV4694. As per the centiloid standard protocol, the 11C-PiB acquisition was from 50 to 70 min after injection. Because this is also the optimal and recommended time for deriving SUVR with 18F-NAV4694 PET (23,24), the same imaging window was used for both tracers. Examples of matching images with both tracers in a young control subject and a patient with mild AD are shown in Figure 3.
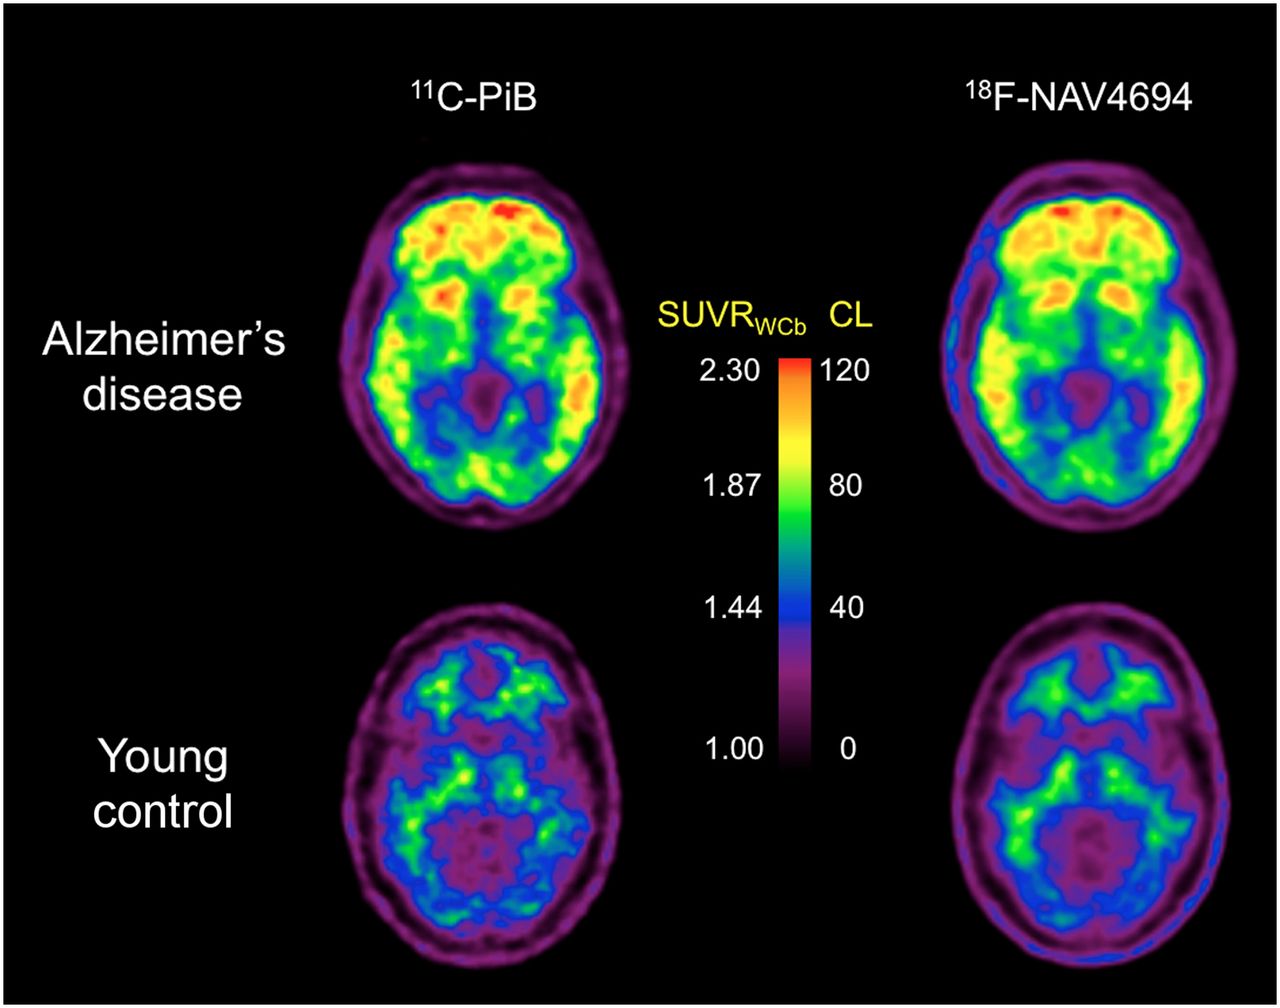
11C-PiB and 18F-NAV4694 images of mild-AD patient and young control. Color scale is set to SUVR units (calculated using standard centiloid method with whole-cerebellum [WCb] reference region) and to matching centiloid (CL) units.
All subjects underwent MRI on a 3-T Trio camera (Siemens). A T1-weighted magnetization-prepared rapid gradient-echo sequence with 1 × 1 × 1.2 mm voxels was used for image registration. Partial-volume correction was not performed.
Image Analysis
Each subject’s MR images were coregistered to the MNI-152 template using SPM8, and then each subject’s PET images were coregistered via the derived MRI transformation parameters using the SPM8 unified segmentation method, as described in detail in the centiloid methodology paper (18). The standard centiloid cortex and whole-cerebellum reference VOIs were downloaded from GAAIN (Fig. 1) and applied to each scan.
The local processing pipeline was first validated on the standard set of 11C-PiB images obtained from GAAIN. Then, the matching 11C-PiB and 18F-NAV4694 images were analyzed using the standard method and the centiloid templates from GAAIN to derive SUVR measures, which were plotted against each other. The resulting linear equation was used to convert the standard 18F-NAV4694 SUVR to the equivalent, or “calculated,” 11C-PiB SUVR that is, 18F-NAV4694 SUVR = m × (11C-PiB SUVR) + b; so that, by rearrangement of the equation, calculated 11C-PiB SUVR = (18F-NAV4694 SUVR − b)/m.
As per the standard method, 18F-NAV4694 SUVR was first converted to calculated 11C-PiB SUVR, and then calculated 11C-PiB SUVR was converted to centiloids.
Finally, the equation to directly convert 18F-NAV4694 SUVR to centiloids was derived by plotting 18F-NAV4694 SUVR against the centiloids derived via conversion to calculated 11C-PiB SUVR.
The mean and variance of the 11C-PiB and 18F-NAV4694 centiloids were compared in the young controls, and the variance ratio was expressed as the 18F-NAV4694 centiloid SD divided by the 11C-PiB centiloid SD.
RESULTS
Validation of our local Austin Health implementation of the standard centiloid method using 11C-PiB scans from GAAIN gave a linear fit of Austin centiloids = 1.00 × GAAIN centiloids – 0.07, with R2 = 0.9999. The fit exceeded the minimum specified acceptance criteria (i.e., R2 > 0.98; slope, 0.98–1.02; intercept, between −2 and +2) (18), confirming that our implementation of the method was accurate.
The locally acquired matching 11C-PiB and 18F-NAV4694 images were then analyzed with the standard centiloid templates and method and demonstrated a close linear correlation: 18F-NAV4694 SUVR = 1.09 × 11C-PiB SUVR – 0.08, R2 = 0.99 (Fig. 4). This satisfied the criterion that the correlation between tracers be greater than 0.70 to be valid for the centiloid process.

Plot of matching 11C-PiB SUVR and 18F-NAV4694 SUVR for each subject. SUVR was calculated using standard centiloid method with whole-cerebellum (WCb) reference region.
18F-NAV4694 SUVR was converted to the equivalent 11C-PiB SUVR using the above equation, and those results were then transformed to centiloids (Fig. 5). From these data, the linear equation required to directly convert 18F-NAV4694 binding to centiloids was 100 × (18F-NAV4694 SUVR – 1.028)/1.174.
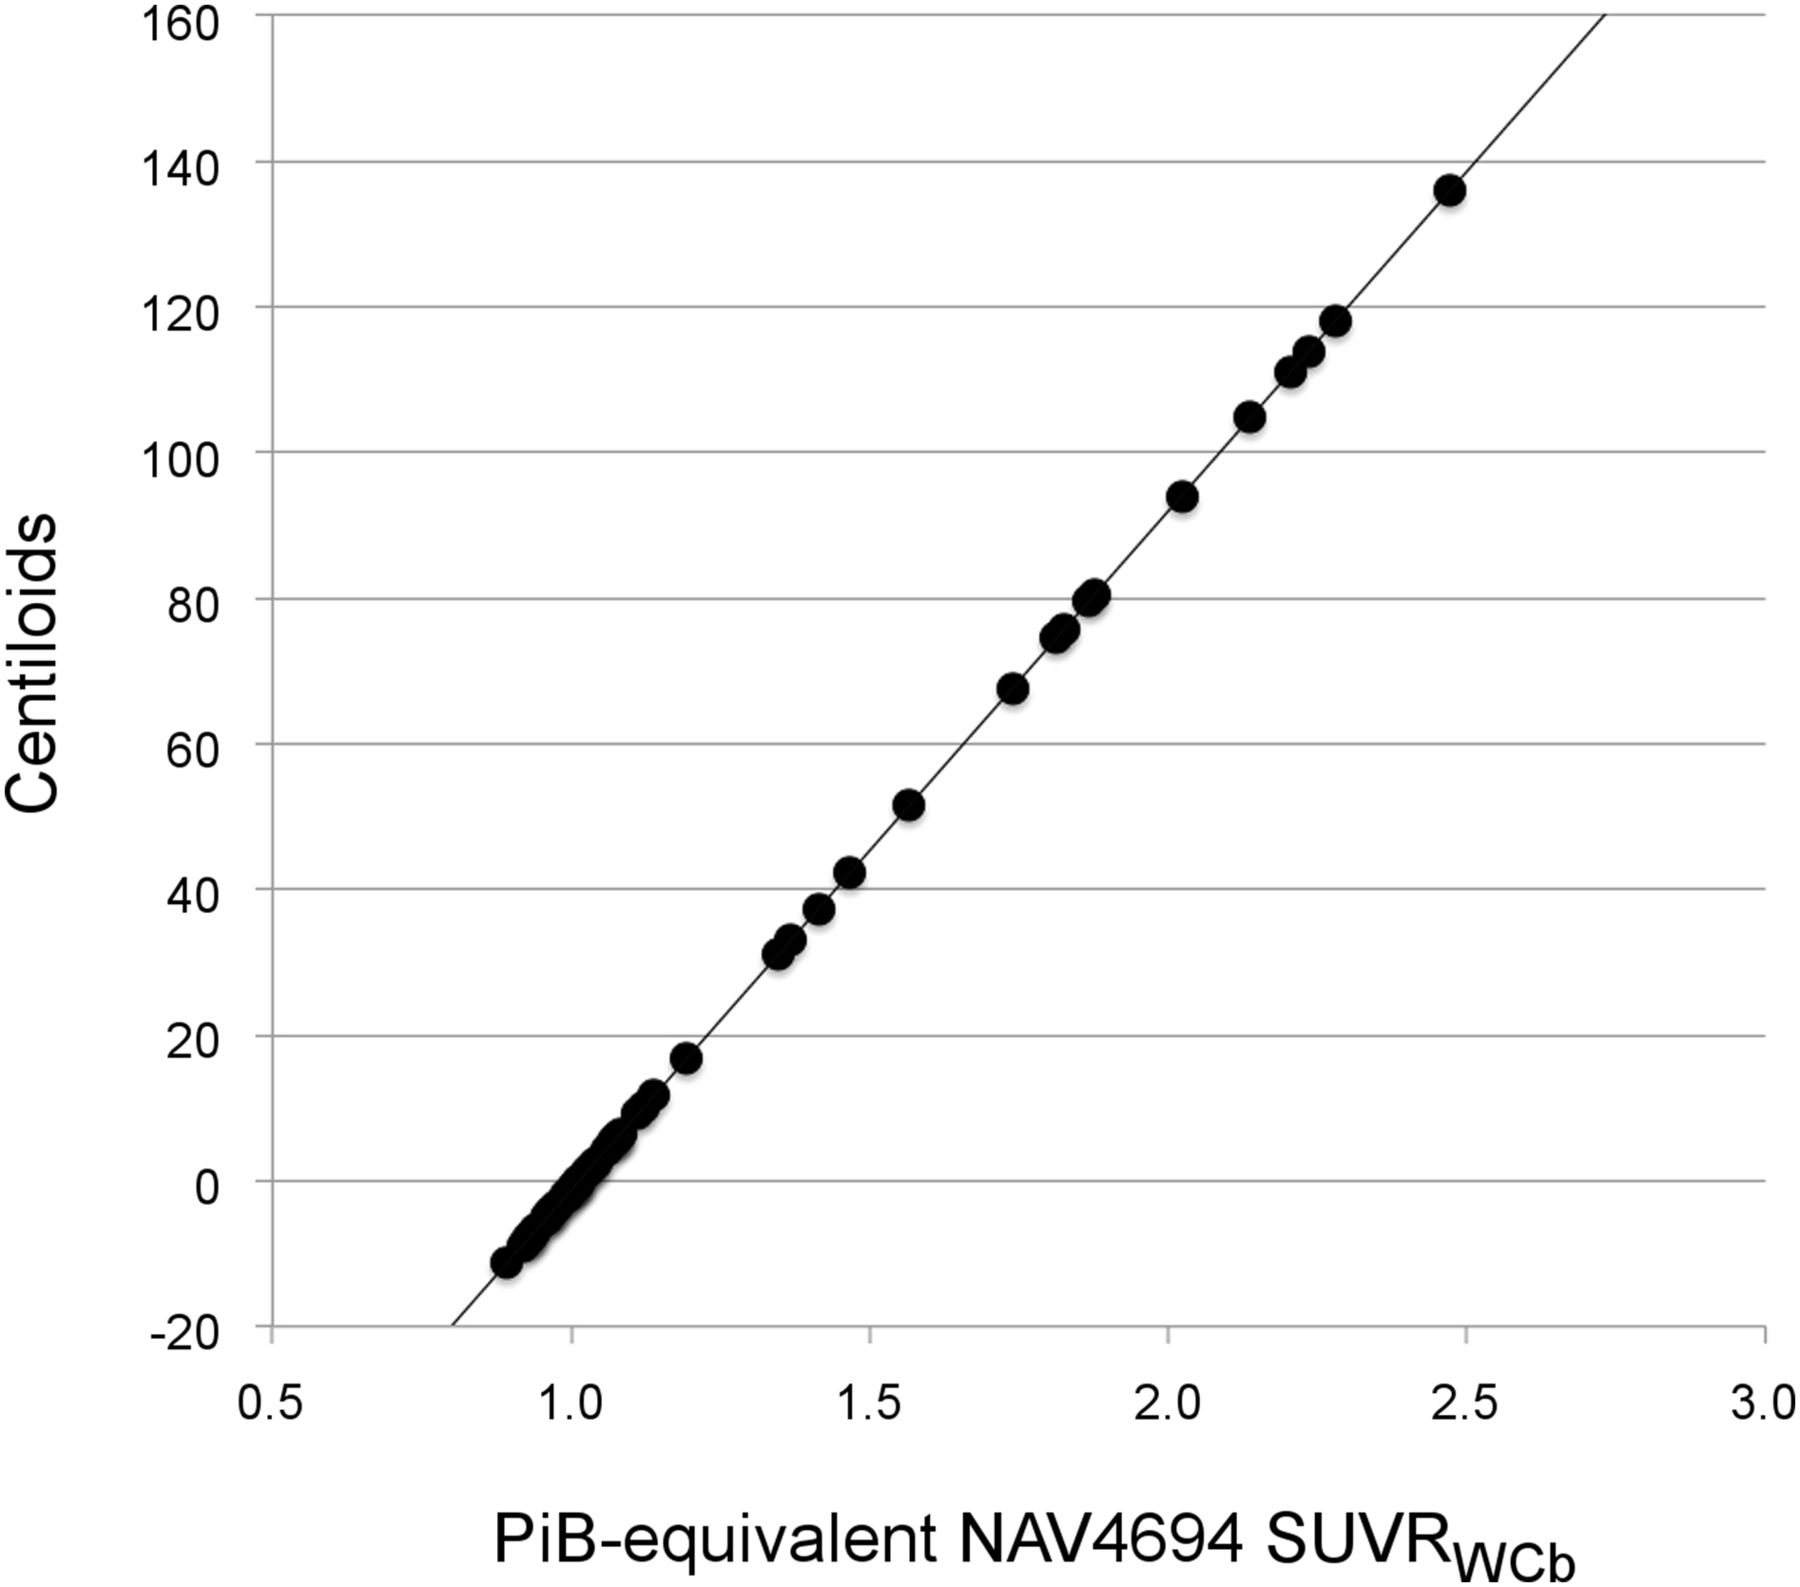
Plot of 11C-PiB–equivalent 18F-NAV4694 SUVR against centiloid value for each 11C-PiB SUVR. Good spread of data points is seen across centiloid range. SUVR was calculated using standard centiloid method with whole-cerebellum (WCb) reference region.
The mean and variance in the young controls were −3.8 ± 3.7 centiloids for 18F-NAV4694 and −3.4 ± 4.34 centiloids for 11C-PiB, yielding a variance ratio of 0.85.
DISCUSSION
The study demonstrated that the Aβ imaging tracer 18F-NAV4694 has binding properties that allow conversion of SUVR output to centiloids by linear transformation. The linear equation we derived enables the results of 18F-NAV4694 scans acquired 50–70 min after tracer injection and analyzed by the standard centiloid method to be converted to centiloids without the need to collect matching 11C-PiB scans. Other sites may now apply this equation and method to their own 18F-NAV4694 scans. The standard centiloid method uses widely available, public domain programs to facilitate the conversion. The 18F-NAV4694 and matched 11C-PiB scans used in this analysis have been uploaded to the centiloid site on GAAIN to serve as a validation dataset for other users.
An additional benefit of the standard centiloid method is that it provides a standardized mechanism for comparing Aβ tracers against 11C-PiB. The tight correlation between 18F-NAV4694 and 11C-PiB binding (R2 = 0.99) and the slope of their plot (18F-NAV4694 SUVR = 1.09 × 11C-PiB SUVR – 0.08) reveal that binding of 18F-NAV4694 to Aβ is similar to—even slightly higher than—binding of 11C-PiB to Aβ. In the young controls, the variation in binding was also lower for 18F-NAV4694 than for 11C-PiB, possibly because the 18F radiolabel on NAV4694 has a longer half-life (109 min) than the 11C radiolabel on PiB (20 min), resulting in a higher counting rate during the scanning window and better images. These findings suggest that the longer-half-life 18F-labeled NAV4694 not only may have the advantage of efficient production and use but also may be better able to detect early Aβ accumulation and small changes over time.
This study has not addressed the issue of regional tracer binding. However, it is expected that regional centiloid values can be derived by creating centiloid parametric images using the global centiloid transformation before applying VOIs. The value obtained from the voxels in a VOI would then be in centiloids.
Ideally, a site will reprocess its 18F-NAV4694 images using the standard centiloid method and apply the conversion equation provided here to quantify the results in centiloids. However, it may be possible to globally convert a local-method SUVR directly to centiloids by analyzing the standard 18F-NAV4694 dataset we placed on GAAIN. Provided there is a good correlation with the standard centiloid templates for these images (R2 > 0.7) (18), centiloid parametric images generated by the standard centiloid method and regions can be used to derive a further linear transformation permitting the locally preferred analysis method to express the results directly in centiloids.
In this study population, the mean 11C-PiB value in young controls was –3.4 centiloids, slightly below the anticipated mean of zero. This result may be due to random variations in the study population or to variations in our imaging equipment or image reconstruction methods. In either case, because the effect was common to both the 11C-PiB images and the 18F-NAV4694 images, it should have had no impact on calculation of the conversion equation. However, differences in PET systems and reconstruction methods between our site and other sites might have a slight effect on use of the conversion equation at other sites. Further work is needed to identify whether equipment-specific equations may be needed.
CONCLUSION
The standard centiloid method for quantification of Aβ PET results should support better clinical and research use of Aβ imaging. By providing cut-points that are applicable to all Aβ scans, the method will allow the use of multiple Aβ tracers in multicenter, anti-Aβ therapeutic trials and provide better diagnostic and prognostic data to clinicians. Both 11C-PiB and 18F-NAV4694 measures of Aβ burden can now be expressed in centiloids, and the conversion equations for other tracers are expected to become available soon.
DISCLOSURE
The costs of publication of this article were defrayed in part by the payment of page charges. Therefore, and solely to indicate this fact, this article is hereby marked “advertisement” in accordance with 18 USC section 1734. Cristopher Rowe has received research grants for imaging in dementia from Bayer-Schering Pharma, Avid Radiopharmaceuticals, GE Healthcare, Piramal, Astra Zeneca, and Navidea. He has been a consultant or paid speaker at sponsored conference sessions for Bayer-Schering Pharma, Piramal, GE Healthcare, Astra Zeneca, Roche, and Janssen. Victor Villemagne has been a consultant or paid speaker at sponsored conference sessions for Bayer-Schering Pharma, Piramal, GE Healthcare, Astra Zeneca, and Novartis. The study was partially supported by grants 1044361 and 1071430 from the National Health Medical Research Council (NHMRC) of Australia and by a research grant for imaging in dementia from Navidea. The funding sources had no input into the design or conduct of the study; the collection, management, analysis, or interpretation of the data; the preparation, review, or approval of the manuscript; or the decision to submit the manuscript for publication. No other potential conflict of interest relevant to this article was reported.
Acknowledgments
We thank Prof. Michael Woodward, Dr. John Merory, Fiona Lamb, and the Brain Research Institute for their assistance with this study.
Footnotes
Published online Feb. 16, 2016.
- © 2016 by the Society of Nuclear Medicine and Molecular Imaging, Inc.
REFERENCES
- Received for publication December 19, 2015.
- Accepted for publication January 29, 2016.


Jump to section
Related Articles
Cited By...
- Impact of Plasma pTau181 Levels on Clinician Diagnostic Confidence and Management in Memory and Cognition Clinics: A Multi-site Before-and-After Study
- A head-to-head comparison of multiple amyloid PET radiotracers for Down syndrome clinical trials
- Updated Appropriate Use Criteria for Amyloid and Tau PET: A Report from the Alzheimers Association and Society for Nuclear Medicine and Molecular Imaging Workgroup
- Concordance between amyloid-PET quantification and real-world visual reads: results from IDEAS
- Alignments between cortical neurochemical systems, proteinopathy and neurophysiological alterations along the Alzheimers disease continuum
- Alzheimers Disease biological PET staging using plasma p217+tau
- The RSNA QIBA Profile for Amyloid PET as an Imaging Biomarker for Cerebral Amyloid Quantification
- Assessing Reactive Astrogliosis with 18F-SMBT-1 Across the Alzheimer Disease Spectrum
- First-in-Humans Evaluation of 18F-SMBT-1, a Novel 18F-Labeled Monoamine Oxidase-B PET Tracer for Imaging Reactive Astrogliosis
- Plasma p-tau181/A{beta}1-42 ratio predicts A{beta}-PET status and correlates with CSF-p-tau181/A{beta}1-42 and future cognitive decline
- The heritability of amyloid burden in older adults: the Older Australian Twins Study
- Plasma p217+tau vs NAV4694 amyloid and MK6240 tau PET across the Alzheimer continuum
- Association of {beta}-Amyloid Level, Clinical Progression, and Longitudinal Cognitive Change in Normal Older Individuals
- Association of deficits in short-term learning and A{beta} and hippocampal volume in cognitively normal adults
- Association of education with A{beta} burden in preclinical familial and sporadic Alzheimer disease
- PET Amyloid Analyses