


Abstract
Quantification of β-amyloid (Aβ) in vivo is often accomplished using the distribution volume ratio (DVR), based on a simplified reference tissue model. We investigated the local relationships between DVR and cerebral blood flow (CBF), as well as relative CBF (R1), in nondemented older adults. Methods: Fifty-five nondemented participants (mean age, 78.5 y) in the Baltimore Longitudinal Study of Aging underwent 15O-H2O PET CBF and dynamic 11C-PiB PET. 15O-H2O PET images were normalized and smoothed using SPM. A simplified reference tissue model with linear regression and spatial constraints was used to generate parametric DVR images. The DVR images were regressed on CBF images on a voxel-by-voxel basis using robust biologic parametric mapping, adjusting for age and sex (false discovery rate, P = 0.05; spatial extent, 50 voxels). DVR images were also regressed on R1 images, a measure of the transport rate constant from vascular space to tissue. All analyses were performed on the entire sample, and on high and low tertiles of mean cortical DVR. Results: Voxel-based analyses showed that increased DVR is associated with increased CBF in the frontal, parietal, temporal, and occipital cortices. However, this association appears to spare regions that typically show early Aβ deposition. A more robust relationship between DVR and CBF was observed in the lower tertile of DVR, that is, negligible cortical Aβ load, compared with the upper tertile of cortical DVR and Aβ load. The spatial distributions of the DVR–CBF and DVR–R1 correlations showed similar patterns. No reliable negative voxelwise relationships between DVR and CBF or R1 were observed. Conclusion: Robust associations between DVR and CBF at negligible Aβ levels, together with similar spatial distributions of DVR–CBF and DVR–R1 correlations, suggest that regional distribution of DVR reflects blood flow and tracer influx rather than pattern of Aβ deposition in those with minimal Aβ load. DVR–CBF associations in individuals with a higher DVR are more likely to reflect true associations between patterns of Aβ deposition and CBF or neural activity. These findings have important implications for analysis and interpretation of voxelwise correlations with external variables in individuals with varying amounts of Aβ load.
Since the initial visualization of β-amyloid (Aβ) in vivo (1), several studies have investigated Aβ deposition in nondemented older adults using 11C-Pittsburgh compound B (PiB) (2–6). Accurate quantification of Aβ is especially important in this population, where associations with other biomarkers and individual differences in cognition and genetic, metabolic, and other medical covariates may enhance understanding of the pathophysiology and temporal sequence of changes in Alzheimer disease (AD), including the timing of Aβ deposition in relation to changes in brain structure and function (7).
An inverse association between Aβ deposition and regional cerebral glucose metabolism has been demonstrated in AD (1,8,9). However, recent findings suggest that deficits in cerebral glucose metabolism, measured by 18F-FDG PET, may not always match the regional distribution of Aβ deposition. For example, in atypical clinical variants of AD, such as the logopenic variant of primary progressive aphasia and posterior cortical atrophy, the pattern of glucose hypometabolism is consistent with the clinical presentation of these AD variants despite similarly widespread Aβ deposition by the time of clinical diagnosis (10). The association between Aβ deposition and glucose metabolism is even less clear in nondemented older adults, with studies yielding conflicting results (11–13). Because of considerations of participant burden and cost, it is not always feasible to perform both 11C-PiB PET and 18F-FDG PET on the same individual. Measures of regional cerebral blood flow (CBF) obtained with 15O-H2O PET provide an alternative for investigation of regional brain function that is more readily integrated into an 11C-PiB PET study because of the short 15O half-life and imaging duration.
In addition, dynamic acquisition of 11C-PiB PET studies allows estimation of parameters that may reflect both Aβ and CBF. For example, the simplified reference tissue model (SRTM) with linear regression and spatial constraint (14) provides estimates of the distribution volume ratio (DVR) for detection of Aβ and an estimate of R1 (relative CBF). R1 is the target–to–reference tissue ratio of the tracer transport rate constant from vascular space to tissue (K1/K1ref) (14) and correlates well with regional cerebral glucose metabolism, measured by 18F-FDG PET (15). As such, R1 can be used to enhance our understanding of the relationship between regional brain function and Aβ deposition in nondemented older adults on whom 18F-FDG PET is not performed.
In this study, we first investigated the voxelwise association of 11C-PiB PET measures of Aβ deposition with concurrently acquired CBF measurements obtained from 15O-H2O PET in nondemented participants in the Baltimore Longitudinal Study of Aging. Next, we used the same approach to examine the relationship between the DVR measure of Aβ burden and the R1 estimate of CBF based on the same 11C-PiB PET dynamic studies. We hypothesized that in nondemented older adults, DVR would be positively correlated with CBF and that this relationship would vary with the spatial distribution of Aβ deposition. Second, we expected that spatial patterns of associations between DVR and R1 would parallel those between DVR and 15O-H2O measures of CBF.
MATERIALS AND METHODS
Participants
The participants were 55 nondemented adults (mean age ± SD, 78.5 ± 6.3 y) from the neuroimaging substudy of the Baltimore Longitudinal Study of Aging (16) who underwent 11C-PiB PET and resting 15O-H2O PET on the same day. Seven of the participants had a Clinical Dementia Rating Scale (17) score of 0.5, 3 of whom met consensus conference–based criteria for mild cognitive impairment at the time of the study. Consensus diagnosis followed established procedures (18,19) and was based on serial neuropsychologic evaluations and the Clinical Dementia Rating Scale score, which was typically informant-based. The neuropsychologic measures used for consensus diagnosis included tests of mental status, word knowledge, verbal ability, memory, language, verbal fluency, attention, executive function, and visuospatial ability. Mild cognitive impairment was diagnosed in participants with progressive decline in a single cognitive domain or in more than a single domain with absence of documented functional impairment. Dementia was diagnosed according to the criteria of the Diagnostic and Statistical Manual of Mental Disorders III-R (20), and AD was diagnosed according to the criteria of the National Institute of Neurologic and Communicative Disorders and Stroke–Alzheimer’s Disease and Related Disorders Association (21). Exclusionary criteria included stroke or head trauma. Sample characteristics are shown in Table 1.
Demographic, Genetic, and Cognitive Data
This study was approved by the Institutional Review Boards of the National Institute on Aging Intramural Research Program and the Johns Hopkins Medicine institutions. Written informed consent was obtained from each participant at each visit.
11C-PiB PET Image Acquisition and Processing
Dynamic 11C-PiB PET studies were performed on an Advance scanner (GE Healthcare) in 3-dimensional mode, and 33 time frames (70-min acquisition) were obtained. Image acquisition started immediately after intravenous bolus injection of 539.5 ± 30.0 MBq (14.58 ± 0.81 mCi) of 11C-PiB with a specific activity of 205.7 ± 110.3 GBq (5.56 ± 2.98 Ci)/μmol. Participants were fitted with a thermoplastic mask to minimize motion during scanning. Transmission scans in 2-dimensional mode using a 68Ge source were used for attenuation correction. Dynamic images were reconstructed using filtered backprojection with a ramp filter (image size, 128 × 128; pixel size, 2 × 2 mm; slice thickness, 4.25 mm), yielding a spatial resolution of about 4.5 mm in full width at half maximum at the center of the field of view.
MR images, coregistered to the corresponding 11C-PiB PET images, were used to define ROIs. Spoiled gradient recalled or magnetization-prepared rapid-acquisition gradient echo MR images (124 slices; image matrix, 256 × 256; pixel size, 0.94 × 0.94 mm; slice thickness, 1.5 mm) were coregistered to the mean of the first 20 min of dynamic PET images for each participant using the mutual information method in the Statistical Parametric Mapping software (SPM2; Wellcome Department of Cognitive Neurology). With the exception of a single claustrophobic participant whose structural MR images were obtained 10 y before the initial 11C-PiB PET assessment, participants underwent structural MR imaging within 3 y of each 11C-PiB PET study. The cerebellar gray-matter ROI, which was used as the reference region, was manually drawn on the MR images and then applied to the 11C-PiB PET images. In addition to the ROI on the cerebellum, 15 other ROIs were manually drawn on the coregistered MR images to sample the PET radioactivity (14,22).
Parametric DVR images were generated by simultaneous fitting of an SRTM with linear regression and spatial constraint to dynamic 11C-PiB PET images (14,23). DVRs for the 15 ROIs were then extracted from the parametric images. Mean cortical DVR (cDVR) was calculated by averaging DVRs from the orbitofrontal, prefrontal (including middle and inferior frontal gyri), superior frontal, parietal, lateral temporal, occipital, and anterior and posterior cingulate regions. Parametric images were then spatially normalized using an R1 (K1/K1ref) template (14) and smoothed with a gaussian filter of 8, 8, and 8 mm in the x, y, and z planes, respectively. We defined minimal cDVR as DVRs below 1.062, based on the test–retest variability for DVR of ±6.2% using SRTM analysis (24) and the fact that a DVR of 1 was considered to denote absence of specific binding.
15O-H2O PET Acquisition and Image Processing
Resting-state 15O-H2O scans were acquired on an Advance PET scanner in 3-dimensional mode. Images were obtained for 60 s once the total radioactivity counts in the brain reached threshold levels, as described previously (25). A transmission scan in 2-dimensional mode using a 68Ge rotating source was applied for attenuation correction. 15O-H2O scanning was performed after the transmission scan and before the 11C-PiB PET scan, with 10 min allowed between scans.
Using Statistical Parametric Mapping (SPM5), 15O-H2O PET scans were spatially normalized into standard stereotaxic space and smoothed using a gaussian kernel to a full width at half maximum of 10, 10, and 10 mm in the x, y, and z planes, respectively. To control for variability in global flow, rCBFs at each voxel were ratio-adjusted to the mean global flow and scaled to 50 mL/100 g/min for each image.
Voxelwise Relationship of DVR with CBF and R1
We used Robust Biologic Parametric Mapping (robust BPM), version 2.1 (26,27), to determine voxelwise DVR–CBF and DVR–R1 relationships. BPM allows voxelwise regression of data from 2 imaging modalities using least-squares regression (28). Robust BPM extends this approach by using robust regression (M-estimation) (29) to account for outliers in the imaging data (26).
We first regressed DVR images on globally adjusted CBF images, using age and sex as covariates, in the entire sample of 55 participants. We then repeated the regression analyses for the upper (n = 18) and lower (n = 18) tertiles defined by cDVR. Subsequently, we regressed DVR images on R1 images, using age and sex as covariates, both in the whole group and in the upper- and lower-tertile subgroups defined by cDVR. Significant effects for all analyses were generated, with false-discovery-rate correction at P = 0.05 and a spatial extent of more than 50 voxels.
RESULTS
Cortical 11C-PiB Retention
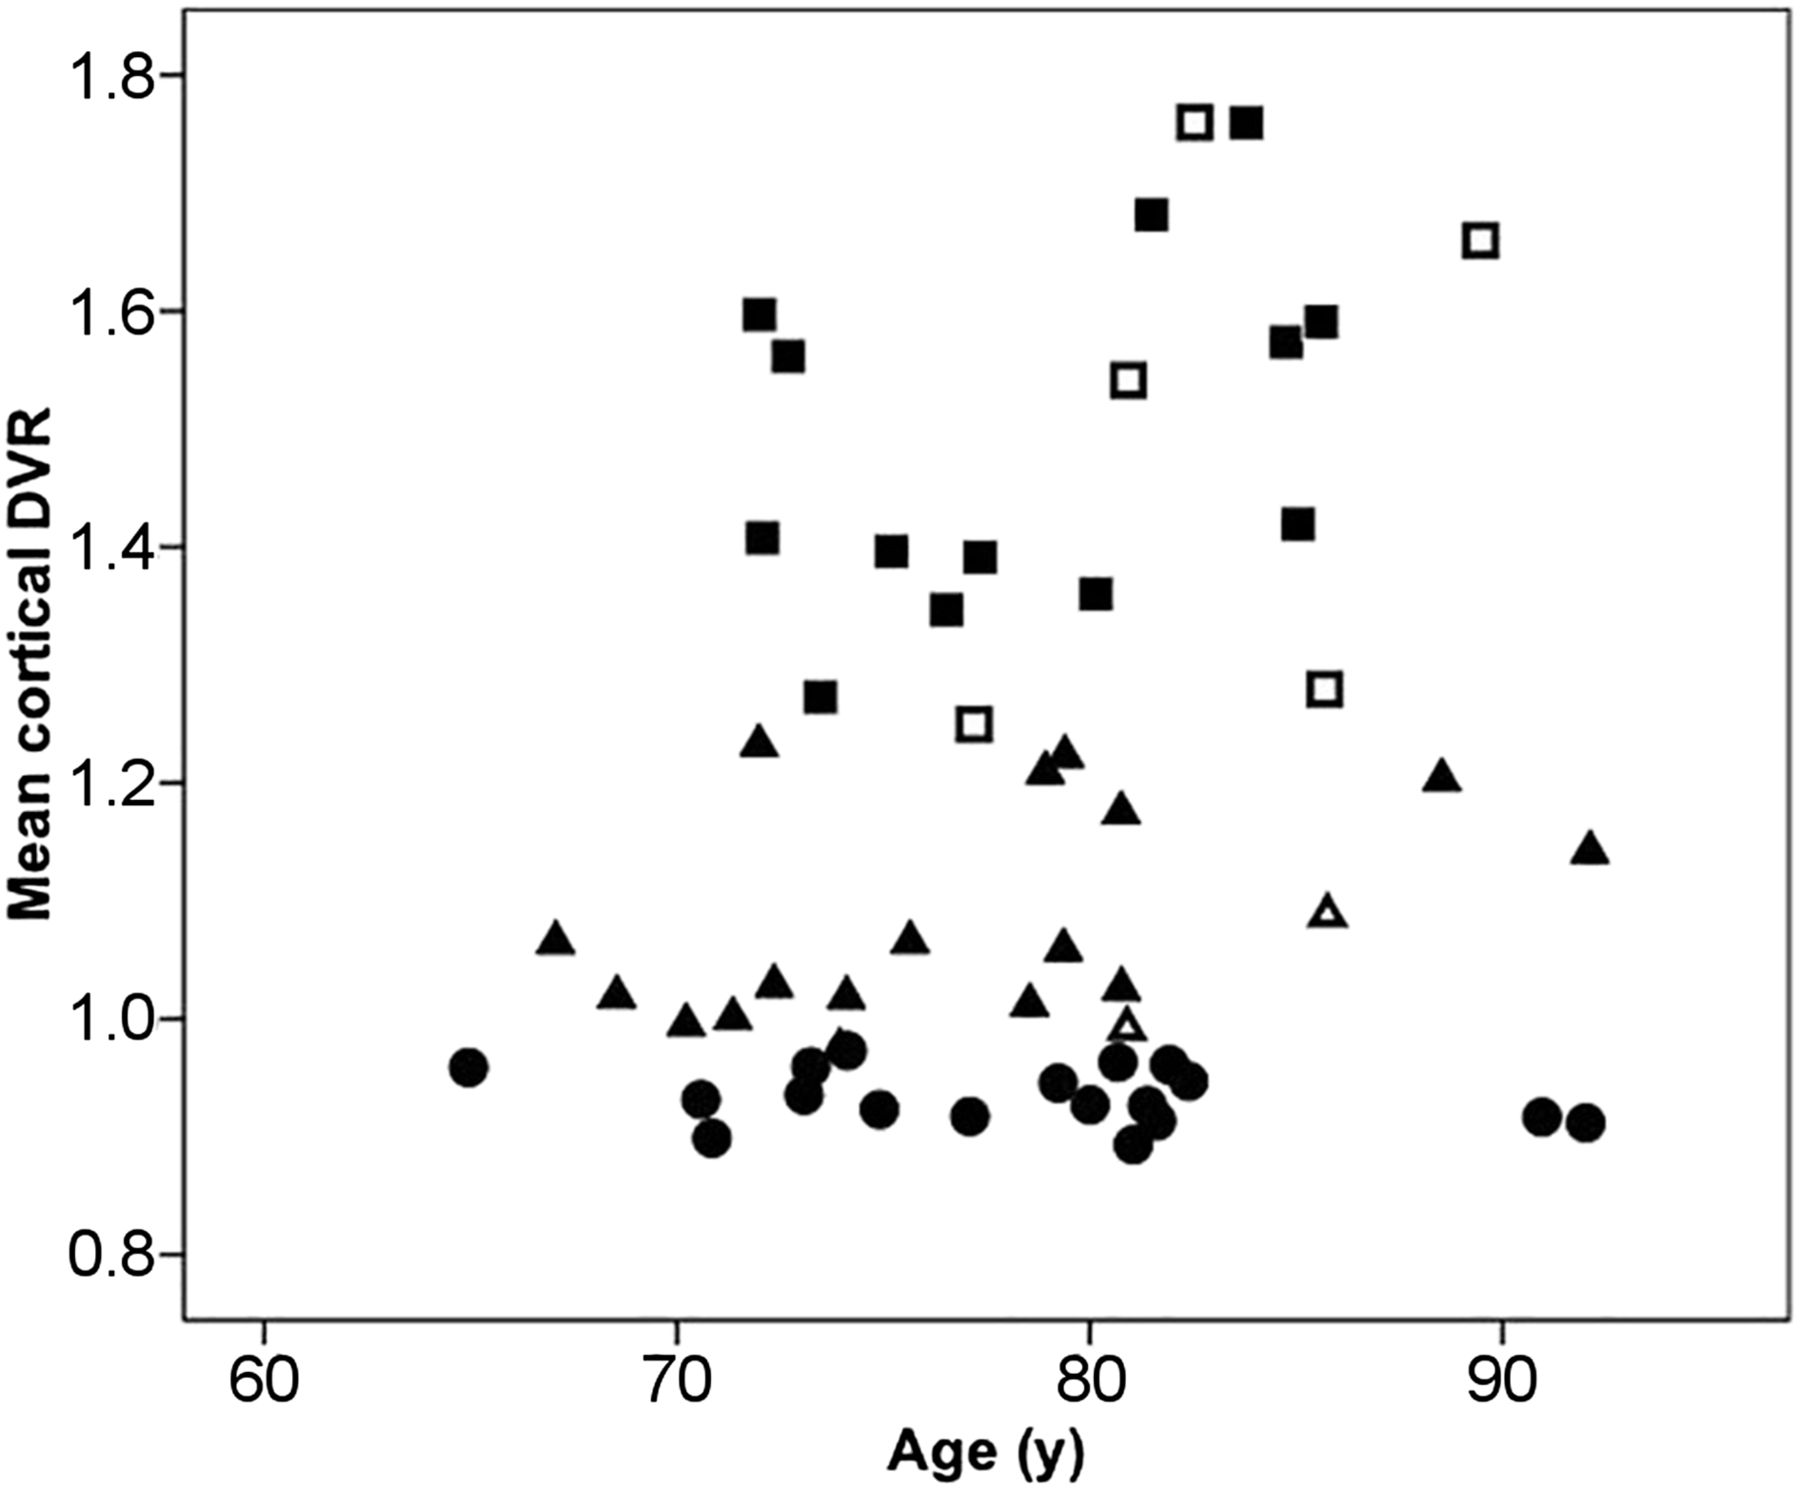
The distribution of cDVR by tertile is shown in Figure 1. The mean cDVRs were 1.17 ± 0.26 for the entire sample, 0.93 ± 0.02 (range, 0.89–0.97) in the lower tertile, and 1.49 ± 0.16 (range, 1.25–1.76) in the upper tertile. The DVRs for the 9 cortical ROIs comprising the cDVR are presented in Table 2 for the whole sample, as well as for the upper- and lower-tertile subgroups. As expected from the subgroup definition, the upper and lower tertiles showed significant differences for cDVR and regional DVRs (P < 0.005).

Distribution of cDVRs by tertile. Squares denote upper tertile; triangles, middle tertile; circles, lower tertile. Solid symbols denote individuals with Clinical Dementia Rating Scale score of 0; open symbols, individuals with score of 0.5.
Global and Regional DVRs
Association Between DVR and 15O-H2O CBF
In the entire sample, only positive correlations were observed between DVR and CBF using a conservative threshold of 0.05 for the false discovery rate and a spatial extent of 50 voxels. With a higher DVR and greater amyloid burden, a higher CBF was seen in the frontal (left superior and left middle frontal gyrus), parietal (right and left paracentral lobule and postcentral gyri, right superior parietal lobule), temporal (right and left superior temporal gyrus and uncus, right inferior temporal gyrus), and occipital (right cuneus) cortices, as well as in the right and left thalamus, right midbrain, and right and left cerebellum (Supplemental Table 1; supplemental materials are available at http://jnm.snmjournals.org). Of the cortical structures, the largest spatial extent (4,772 voxels) and T-value (11.16) were localized to the paracentral lobule. Figure 2A illustrates DVR–CBF relationships in the paracentral lobule, with extension primarily anterior to the medial frontal gyrus. Importantly, DVR was not related to CBF in the orbitofrontal gyrus, in most of the cingulate gyrus, or in the precuneus, although these regions have moderate to high amounts of Aβ (Table 2). Nevertheless, there are also regions, such as the superior frontal gyrus, that have an elevated DVR (1.2 ± 0.34) and do show an association between DVR and CBF. Interestingly, the medial temporal gyrus, which has a very low DVR (1.01 ± 0.09), showed robust voxelwise relationships between DVR and CBF.

(A) Positive associations between CBF and DVR. (B) Positive associations between R1 and DVR.
We next investigated the relationship between DVR and CBF by cDVR tertile. We found that a higher DVR was associated with a higher CBF in the upper-tertile subgroup. These findings were localized to the frontal (left superior, middle, and orbitofrontal gyri, right medial and inferior frontal gyri, right and left subcallosal gyrus), parietal (right paracentral lobule), temporal (right and left superior temporal gyrus, left middle temporal gyrus, right fusiform gyrus, left insula), and occipital (left middle occipital gyrus, left cuneus) lobes, as well as to the right cingulate gyrus, left caudate, and right cerebellum (Supplemental Table 1). The greatest spatial extent (1,237 voxels), with a T-value of 16.61, was in the right paracentral lobule. Figure 2A shows associations between DVR and CBF in the medial frontal gyrus and the paracentral lobule for the upper-tertile subgroup.
DVR–CBF analysis in the lower-tertile subgroup showed greater spatial extent than in the upper-tertile subgroup (Fig. 2A). DVR–CBF correlations were localized to the frontal (right and left superior frontal gyrus, right inferior frontal gyrus, left precentral gyrus), parietal (right inferior parietal lobule), and temporal (right superior, middle, and inferior temporal gyri, right fusiform gyrus, right uncus) cortices, as well as to the corpus callosum and cerebellum (Supplemental Table 1). Of these regions, the corpus callosum had the greatest spatial extent (19,901 voxels) and T-value (20.24).
Several DVR–CBF associations were found across analyses for the upper- and lower-tertile subgroups. These include the left superior and inferior frontal gyri, right superior and middle temporal gyri, and right cingulate gyrus.
Association Between DVR and R1
Similar to the findings for associations between DVR and 15O-H2O CBF in the entire sample, only positive correlations between DVR and R1 reached the statistical threshold. DVR–R1 correlations were in regions similar to the DVR–CBF correlations: the frontal, parietal, temporal, and occipital cortices, as well as the cerebellum (Fig. 2B; Supplemental Table 2). The DVR–R1 correlation of greatest extent was in the medial frontal gyrus, paracentral lobule, and cerebellum.
In addition, we investigated DVR and R1 by cDVR tertile. In both the upper- and the lower-tertile subgroups, only positive associations between R1 and DVR were observed (Fig. 2B). In the upper tertile, DVR–R1 associations were localized to the medial frontal gyrus, paracentral lobule, thalamus, and cerebellum, and the spatial distribution of DVR–R1 associations was similar to but of greater spatial extent than that of DVR–CBF associations. Compared with the upper-tertile subgroup, the lower-tertile subgroup had a greater spatial extent of DVR–R1 associations, and these associations involved most of the frontal, parietal, temporal, and occipital cortices, as well as the thalamus and cerebellum. In the lower-tertile subgroup, spatial extent was greater for DVR–R1 associations than for DVR–CBF associations.
DISCUSSION
Our voxelwise analysis of 15O-H2O and 11C-PiB PET in nondemented older adults revealed that positive relationships between local DVR and CBF are less pronounced in many regions that typically have high Aβ deposition. Overall, relationships between DVR and CBF are more robust in individuals with a low Aβ load than in those with a high Aβ load. Furthermore, associations between DVR and R1 show patterns similar to those between DVR and CBF. Specifically, individuals with a low DVR and low levels of Aβ demonstrate more robust DVR–R1 relationships than individuals with a high Aβ load. Together, these findings suggest that at low DVR levels, regional patterns in DVR images reflect blood flow and tracer influx to tissue rather than reflecting Aβ deposition.
We found significant positive but no inverse associations between DVR and CBF in individuals without a clinical diagnosis of dementia. The spatial distribution of this DVR–CBF relationship with respect to the distribution of Aβ load provides insight for understanding the DVR–CBF associations. A higher DVR is related to a higher CBF in the frontal, parietal, temporal, and occipital cortices, with the greatest spatial extent being in the paracentral lobule and extending anteriorly to the medial frontal gyrus. However, regions with early Aβ deposition, such as the precuneus, do not show extensive and robust associations between DVR and CBF. Thus, there may be factors other than increased Aβ load that underlie the DVR–CBF relationships in regions showing extensive associations in the sample as a whole.
To further investigate this possibility, we examined the effect of Aβ load, measured by mean cDVR, on the relationship between DVR and CBF. We found that both the magnitude and the spatial extent of DVR–CBF relationships were greater in the lower-tertile subgroup, with negligible or low Aβ load. As in the analysis of the whole sample, regions that typically have high amounts of Aβ did not show extensive relationships between DVR and CBF. These findings suggest that DVR images at low cDVR levels likely represent patterns of CBF and tracer delivery, in addition to nonspecific binding, rather than Aβ deposition. We also found that the region in the lower-tertile subgroup with the highest spatial extent for DVR–CBF association is the corpus callosum, consistent with delayed tracer clearance for 11C-PiB in white matter (30).
To directly understand the contribution of tracer influx to DVR, we also investigated the relationship between DVR and R1. We found a robust relationship involving most of the cortex between DVR and R1 at low cDVR levels—a contrast to the lesser spatial extent of DVR–R1 associations at high cDVR levels. This suggests that DVR images at low cDVR levels, in addition to reflecting blood flow, also reflect tracer influx. Nevertheless, as can be seen from Figure 2B, R1 is related to DVR even in the upper tertile. Therefore, it is essential to determine the level of Aβ load at which DVR images represent regional patterns of Aβ deposition rather than blood flow or tracer influx. It is likely that differences in regional patterns of PiB retention at different levels of Aβ can be informative in this regard, as suggested by our recent report that spatial patterns of PiB retention and progression may be better markers of cognitive decline than is cDVR alone (31). A clearer understanding of the extent to which tracer influx contributes to regional patterns of PiB retention and other amyloid radiotracers will be important for both statistical analysis and clinical interpretation of amyloid imaging scans.
Both DVR–R1 and DVR–CBF associations were positive in direction, and regression of R1 on DVR localized to the medial frontal gyrus and the paracentral lobule, regions also showing DVR–CBF relationships. However, spatial extent was greater for DVR–R1 associations than DVR–CBF associations. In part, the greater correspondence between DVR and R1 may reflect correlated noise, because R1, unlike independently assessed CBF, is used to calculate the tissue concentration of the tracer (14). Our study extends the findings of Blomquist et al., who, in a study of a rhesus monkey, found that K1 for 11C-PiB reflects CBF (32). Here, we have demonstrated similar, region-specific, patterns of DVR–CBF and DVR–R1 associations in humans.
Our study has important implications for interpretation of Aβ imaging data. Voxelwise investigations of the relationship between local values of 11C-PiB and external variables may be misleading given that DVR images at lower cDVR levels may not represent Aβ deposition but rather blood flow and tracer influx. Such analyses using genetic, cognitive, or other scalar data as covariates of interest assume that variation in regional distribution of tracer retention at both low and high levels reflects regional variation in Aβ deposition. As we have shown, the distribution of DVRs at different mean DVR levels can represent different processes. With DVRs at higher cDVR levels reflecting regional patterns of Aβ deposition while those at lower cDVR levels represent regional patterns of blood flow and tracer influx, correlation or regression analyses including images across Aβ levels may lead to results that do not reflect a single biologic process. Although these findings are pertinent for investigations across diagnostic categories with a wide range of DVRs, they are perhaps more influential in nondemented older adults, a greater proportion of whom may have negligible levels of Aβ load that might affect associations of DVR with external variables. On the other hand, this difference in the process underlying the spatial distribution of PiB retention at high and low overall levels of Aβ deposition may improve classification between cognitively stable and cognitive declining individuals (31). These findings further underscore the importance of investigating the DVR cutoff at which images reflect factors other than Aβ deposition.
In this study, we used robust BPM for DVR–CBF and DVR–R1 voxelwise correlations. An advance of robust BPM relative to standard BPM is its use of robust regression to reduce the effect of outliers that may be due to, for example, misregistration (33). In addition, we used SRTM to estimate DVR rather than using the widely applied Logan graphical analysis, because SRTM allows simultaneous estimation of DVR and R1. DVRs estimated by the Logan plot with reference tissue input are comparable to those estimated by SRTM at low noise levels of ROI kinetics but are underestimated in the presence of increased noise (23,24). We also recognize that SUVR is commonly used for semiquantitative measurement of PiB binding, because of simplified data acquisition and quantification, and note that highly linear correlations between DVR and SUVR were reported in previous studies with low noise levels of ROI kinetics (34,35). However, SUVR measurements are dependent on the time window of acquisition (24,34), and bias relative to DVR estimation is correlated with magnitude (35). Therefore, correlations of SUVR with CBF or R1 will vary with the time window of acquisition and the magnitude of amyloid deposition.
Our study had several limitations. It was limited to individuals without clinical diagnoses of dementia. Further investigation of DVR–CBF and DVR–R1 relationships in individuals with wider ranges of global DVRs such as seen in mild cognitive impairment or AD would allow for more direct evaluation of the cutoff of DVRs at which the regional patterns in the images are no longer heavily weighted by blood flow or tracer influx. In addition, although we excluded individuals with stroke or head trauma, other contributing factors that may relate to vascular disease were not considered. Nevertheless, our study also had several strengths. We studied individuals from the neuroimaging substudy of the BLSA, which represents a well-characterized sample of nondemented older adults followed for 20 y (16). We also used robust BPM, which accounts for outliers, to provide more accurate estimates of intermodality correlations.
CONCLUSION
We have demonstrated that at low levels of global 11C-PiB retention, the regional pattern of DVR likely reflects blood flow and influx of the tracer to tissue, in addition to nonspecific binding associated with tracer clearance. As such, studies investigating voxelwise regional relationships between DVR and scalar values, as well as imaging data, may be limited in interpretation unless the correlational analysis is restricted to individuals with more than minimal tracer retention and Aβ load. On the other hand, differences in regional distribution of tracer retention at low and high levels of Aβ may aid in the discrimination of cognitively normal individuals from impaired individuals.
DISCLOSURE
The costs of publication of this article were defrayed in part by the payment of page charges. Therefore, and solely to indicate this fact, this article is hereby marked “advertisement” in accordance with 18 USC section 1734. This research was supported by the Intramural Research Program of the NIH and by National Institute on Aging research and development contracts HHSN260200400012C and K24 DA000412. No other potential conflict of interest relevant to this article was reported.
Acknowledgments
We are grateful to the BLSA participants for their dedication to these studies. We also thank Wendy Elkins and Beth Nardi for managing the study, as well as the staff of the PET facility at Johns Hopkins University and the neuroimaging staff of the National Institute on Aging for their assistance. We thank Dr. Ramon Casanova for his assistance with BPM.
Footnotes
Published online May 14, 2015.
- © 2015 by the Society of Nuclear Medicine and Molecular Imaging, Inc.
REFERENCES
- Received for publication November 11, 2014.
- Accepted for publication April 15, 2015.


Jump to section
Related Articles
Cited By...
- No citing articles found.