


Abstract
The primary goal of this study was to assess the suitability of 11C-Pittsburgh compound B (11C-PiB) blood–brain barrier delivery (K1) and relative delivery (R1) parameters as surrogate indices of cerebral blood flow (CBF), with a secondary goal of directly examining the extent to which simplified uptake measures of 11C-PiB retention (amyloid-β load) may be influenced by CBF, in a cohort of controls and patients with mild cognitive impairment (MCI) and Alzheimer disease (AD). Methods: Nineteen participants (6 controls, 5 AD, 8 MCI) underwent MR imaging, 15O-water PET, and 11C-PiB PET in a single session. Fourteen regions of interest (including cerebellar reference region) were defined on MR imaging and applied to dynamic coregistered PET to generate time–activity curves. Multiple analysis approaches provided regional 15O-water and 11C-PiB measures of delivery and 11C-PiB retention that included compartmental modeling distribution volume ratio (DVR), arterial- and reference-based Logan DVR, simplified reference tissue modeling 2 (SRTM2) DVR, and standardized uptake value ratios. Spearman correlation was performed among delivery measures (i.e., 15O-water K1 and 11C-PiB K1, relative K1 normalized to cerebellum [Rel-K1-Water and Rel-K1-PiB], and 11C-PiB SRTM2-R1) and between delivery measures and 11C-PiB retention, using the Bonferroni method for multiple-comparison correction. Results: Primary analysis showed positive correlations (ρ ≈0.2–0.5) between 15O-water K1 and 11C-PiB K1 that did not survive Bonferroni adjustment. Significant positive correlations were found between Rel-K1-Water and Rel-K1-PiB and between Rel-K1-Water and 11C-PiB SRTM2-R1 (ρ ≈0.5–0.8, P < 0.0036) across primary cortical regions. Secondary analysis showed few significant correlations between 11C-PiB retention and relative 11C-PiB delivery measures (but not 15O-water delivery measures) in primary cortical areas that arose only after accounting for cerebrospinal fluid dilution. Conclusion: 11C-PiB SRTM2-R1 is highly correlated with regional relative CBF, as measured by 15O-water K1 normalized to cerebellum, and cross-sectional 11C-PiB retention did not strongly depend on CBF across primary cortical regions. These results provide further support for potential dual-imaging assessments of regional brain status (i.e., amyloid-β load and relative CBF) through dynamic 11C-PiB imaging.
The development of β-amyloid (Aβ) plaque imaging agents, such as 11C-Pittsburgh compound B (11C-PiB), for PET has enabled measurement of Aβ deposition in living humans (1–3). These studies demonstrated 2-fold-greater 11C-PiB cortical retention in Alzheimer disease (AD) patients (relative to cognitively normal controls), evidence of Aβ deposition in 50%–70% of patients with mild cognitive impairment (MCI) (4,5), and elevated 11C-PiB retention in 10%–30% of elderly controls (average age, 64–74 y) (2,4,6–10).
Despite a multitude of 11C-PiB studies, few were fully quantitative kinetic modeling studies (11–13) because this involves invasive arterial blood sampling and long scan duration that can be burdensome for subjects, and simplified PET methodologies were found to provide assessments of Aβ load that are consistent with quantitative outcomes (14,15).
Fully quantitative PET studies provide important information needed to evaluate radiotracer kinetics (e.g., blood–brain barrier radioligand delivery [K1], specific binding [k3]) and strengths and limitations of more feasible semiquantitative methods (e.g., reference Logan, simplified reference tissue model [SRTM], multilinear reference tissue model [MRTM], and standardized uptake value tissue ratios [SUVRs]) (14–18).
Meyer et al. reported on dual-biomarker imaging with 11C-PiB using the 2-step SRTM method (SRTM2) to assess both Aβ plaque load and regional relative radioligand delivery R1, showing good correlation between 11C-PiB SRTM2-R1 and 18F-FDG SUVR (40–60 min after injection) (19). Meyer et al. concluded that 11C-PiB can provide information on not only Aβ load but also neuronal activity and neurodegeneration through SRTM2-R1.
Van Berckel et al. recently examined longitudinal changes in 11C-PiB retention using voxel-based parametric approaches, ranging from SUVR to a voxel-level reference tissue analog of SRTM2 (RPM2) and found sensitivity of longitudinal changes in 11C-PiB SUVR to changes in flow (20).
The primary goal of this study was to clarify, through quantitative evaluation of 15O-water and 11C-PiB delivery parameters, the extent to which 11C-PiB SRTM2-R1 can be a robust surrogate index of relative cerebral blood flow (CBF). Secondarily, regional relationships between 15O-water and 11C-PiB delivery parameters and 11C-PiB retention were examined to further clarify independence between these measures, on a cross-sectional basis, particularly for simplified retention measures.
MATERIALS AND METHODS
Human Subjects
Nineteen subjects (6 controls, 8 MCI, 5 AD) were recruited, as previously described (13,15). Subject characteristics are shown in Table 1. This study was approved by the local Institutional Review Board, and informed consent was obtained from all subjects or their caregivers. Some 11C-PiB PET results were previously published (8,13,15,17) with exceptions noted below. The basic imaging methodology is described below, with further details in earlier publications (13,15,21).
Subject Characteristics
Imaging
MR imaging (spoiled-gradient recalled sequence) was performed on a 1.5-T Signa (GE Healthcare) scanner for region-of-interest (ROI) definition and determination of atrophy-related cerebrospinal fluid (CSF) dilution. A Siemens/CTI ECAT-HR+ PET scanner was used with a Neuro-insert (CTI PET Systems), as previously reported (13). PET corrections included scanner normalization, deadtime, attenuation, scatter, random coincidences, and radioactive decay. PET data were reconstructed by filtered backprojection (direct Fourier method; final spatial resolution, ∼6 mm).
15O-water was synthesized using a mixed gas flow system, trapped in saline solution (5–7 mL), and administered as a rapid bolus (444 MBq) using an automated injector system, with simultaneous initiation of a 3-min 20-frame dynamic acquisition (10 × 3, 3 × 10, 4 × 15, and 3 × 20 s). Ten minutes after 15O-water imaging, a transmission scan (68Ge/68Ga rods) was acquired. 11C-PiB, synthesized as previously described (13), was administered as a slow 20-s bolus (∼500 MBq, 50 GBq/μmol) with simultaneous start of a 90-min 34-frame dynamic acquisition (4 × 15, 8 × 30, 9 × 60, 2 × 180, 8 × 300, and 3 × 600 s).
Plasma input functions were determined using dynamic arterial blood sampling (radial artery) performed over 3.5 min for 15O-water using a Siemens Liquid Activity Monitoring System and over 90 min for 11C-PiB by manual collection of 35 samples (0.5 mL), with 20 collected within 2 min and 5–6 additional samples (2–3 mL) collected over the study, to measure radiolabeled metabolites.
Image Processing and ROI Definition
The 15O-water and 11C-PiB PET data were separately coregistered to MR images using automated registration methods (22,23), as described previously (15,24). The 15O-water and 11C-PiB data were integrated over the initial 3 and 15 min, respectively. Each integrated PET image was aligned to a MR image, and the MR image was resliced to match PET space (128 × 128 × 63; pixel size, 2.06 × 2.06 × 2.43 mm).
ROIs were manually defined on coregistered MR images using criteria that resulted in high rater reliability (24). ROIs included anterior cingulate gyrus (ACG), anterior ventral striatum (AVS), cerebellum (CER), frontal cortex (FRC), lateral temporal cortex (LTC), mesial temporal cortex (MTC), occipital cortex (OCC), occipital pole (OCP), parietal cortex (PAR), pons (PON), precuneus (PRC), sensory-motor cortex (SMC), subcortical white matter (SWM), and thalamus (THL). A global cortical region (CTX5) was defined as the voxel-weighted average of ACG, FRC, LTC, PAR, and PRC (primary cortical regions). ROIs were applied to sample dynamic PET data and generate regional time–activity curves. CER was used as the reference region to approximate the kinetics of nondisplaceable (ND) uptake and defined to minimize white matter uptake and spillover effects from OCC. For 15O-water, CER was also used as a reference, because it is less prone to age-related atrophy and changes in CBF (25).
Data Analysis
15O-water data were analyzed using a 1-tissue compartment model with iterative curve-fitting to estimate 15O-water K1 (mL⋅cm−3⋅min−1) and brain efflux k2 (min−1), while accounting for input function timing delays, as previously described (21). In this work, K1-Water was used as a direct index of CBF (i.e., K1-Water = F × E = F × [1 − e-PS/F], where E = extraction fraction, F = CBF, and PS = permeability surface area product), although limitations in 15O-water single-pass extraction (∼90%) are well known (26). Relative K1-Water (Rel-K1-Water) was computed regionally as the K1-Water-ROI–to–K1-Water-CER ratio.
Multiple modeling approaches were used to analyze 11C-PiB. As previously described (13,15), a 2-tissue, 4-parameter compartment model (2T-4k), Logan analysis (using arterial [ART90] or cerebellar reference [CER90] [90 is the total length of the scan, 90 min] data as input), and SRTM2 were applied (15). SRTM2 was applied by constraining k2′ (reference tissue clearance rate) to the mean of the k2′ values initially determined using SRTM across all ROIs except CER for each subject.
For the primary analysis, 11C-PiB delivery measures were obtained from compartmental modeling, including K1-PiB and relative K1-PiB (Rel-K1-PiB = K1-PiB-ROI–to–K1-PiB-CER ratio), and SRTM2-R1 (representing K1-PiB-ROI–to–K1-PiB-CER ratio). For the secondary analysis, 11C-PiB retention measures were based on 2T-4k distribution volumes (i.e., VT = K1/k2[1 + k3/k4]) used to compute distribution volume ratios (DVR), that is, DVR = VT-ROI/VT-CER = BPND + 1, where BPND (binding potential nondisplaceable) is directly related to density of available binding sites (Bavail) and radioligand affinity (27). DVR was computed using the 2T-4k model, Logan analysis, and SRTM2 (i.e., BPND + 1). 11C-PiB retention was also measured using SUVRs measured over 50–70 min after injection (SUVR70), with SUVRROI = SUVROI/SUVCER (15).
The delivery and 11C-PiB retention measures were adjusted for dilutional effects of expanded CSF spaces, using an MR imaging–guided approach routinely used at our site (28,29). Most processing and analysis software was developed and validated in-house, except for SRTM/SRTM2 analyses performed in PMOD 3.204 (PMOD Technologies Ltd.). Parametric images were generated for Rel-K1-Water using a voxel-based in-house implementation of the 1-tissue model, and SRTM-R1 and DVR images were generated using PMOD.
Statistical Methods
Descriptive statistics included mean ± SD or counts, as appropriate. Relative SD (RSD, expressed as percentages) was calculated for delivery measures to assess differences in intersubject variability. Group differences in subject characteristics were determined using the Kruskal–Wallis test, with the Mann–Whitney U test for post hoc comparisons. The Bonferroni method was used for multiple-comparison correction.
Relationships between outcome measures were examined using Spearman correlation, on a region-by-region basis across all subjects. The primary correlations were between measures of CBF and 11C-PiB delivery (K1-Water vs. K1-PiB, Rel-K1-Water vs. Rel-K1-PiB, Rel-K1-Water vs. 11C-PiB SRTM2-R1, and Rel-K1-PiB vs. 11C-PiB SRTM2-R1). Secondary correlations were between delivery parameters (K1-Water, Rel-K1-Water, Rel-K1-PiB, and 11C-PiB SRTM2-R1) and 11C-PiB retention (2T-4k-DVR, ART90-DVR, CER90-DVR, SRTM2-DVR, and SUVR70). Correlations were performed with and without CSF dilution adjustment. All analyses were 2-sided and underwent Bonferroni adjustment where appropriate. Statistical analyses were performed using SPSS 20.0.0 (IBM Corp.).
RESULTS
Subjects and CSF Correction
Neither age nor education was significantly different across subject groups (Table 1). Mini Mental State Examination (MMSE) scores were significantly different (P = 0.010). Post hoc analysis showed higher MMSE for controls than AD (P = 0.009) and higher MMSE for MCI than AD (P = 0.011), which survived Bonferroni adjustment. CSF dilution factors (Supplemental Table 1; supplemental materials are available at http://jnm.snmjournals.org) were not significantly different across subject groups, after Bonferroni adjustment, as previously reported (15).
Delivery Parameters
Table 2 shows mean regional delivery parameters. On average, K1-PiB was 40%–50% lower than K1-Water for most ROIs. In contrast, average relative 15O-water and 11C-PiB delivery parameters were more similar. Supplemental Figure 1 plots K1-Water and K1-PiB for primary cortical ROIs, CER, and PON grouped by diagnosis. Comparison of RSD for absolute and relative delivery measures generally revealed lower intersubject variability for relative delivery, including primary cortical regions in which RSD was 4.1%–6.3% lower for Rel-K1-Water than for K1-Water and 4.1%–8.6% lower for Rel-K1-PiB than for K1-PiB. The 11C-PiB SRTM2-R1 RSD was 0.4%–3.8% lower than that for the Rel-K1-PiB.
Delivery Parameters
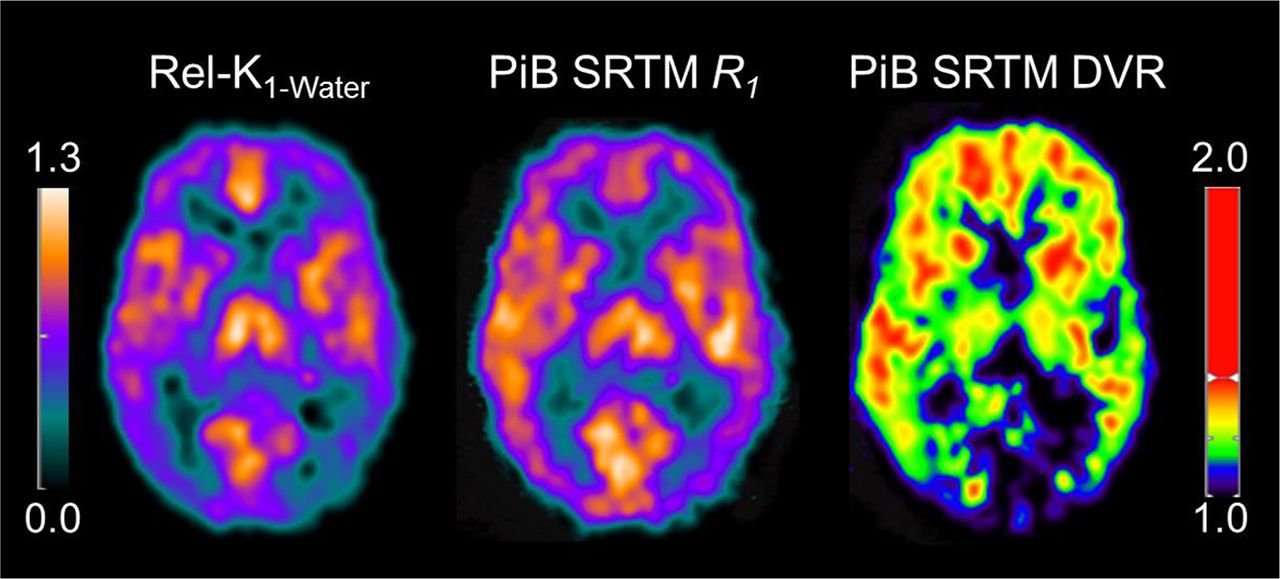
Figure 1 visually shows the relationship between CTX5 delivery parameters. Figure 2 shows example parametric images of Rel-K1-Water and 11C-PiB SRTM-R1 and DVR for an AD subject, demonstrating similar regional distribution for Rel-K1-Water and 11C-PiB SRTM-R1.
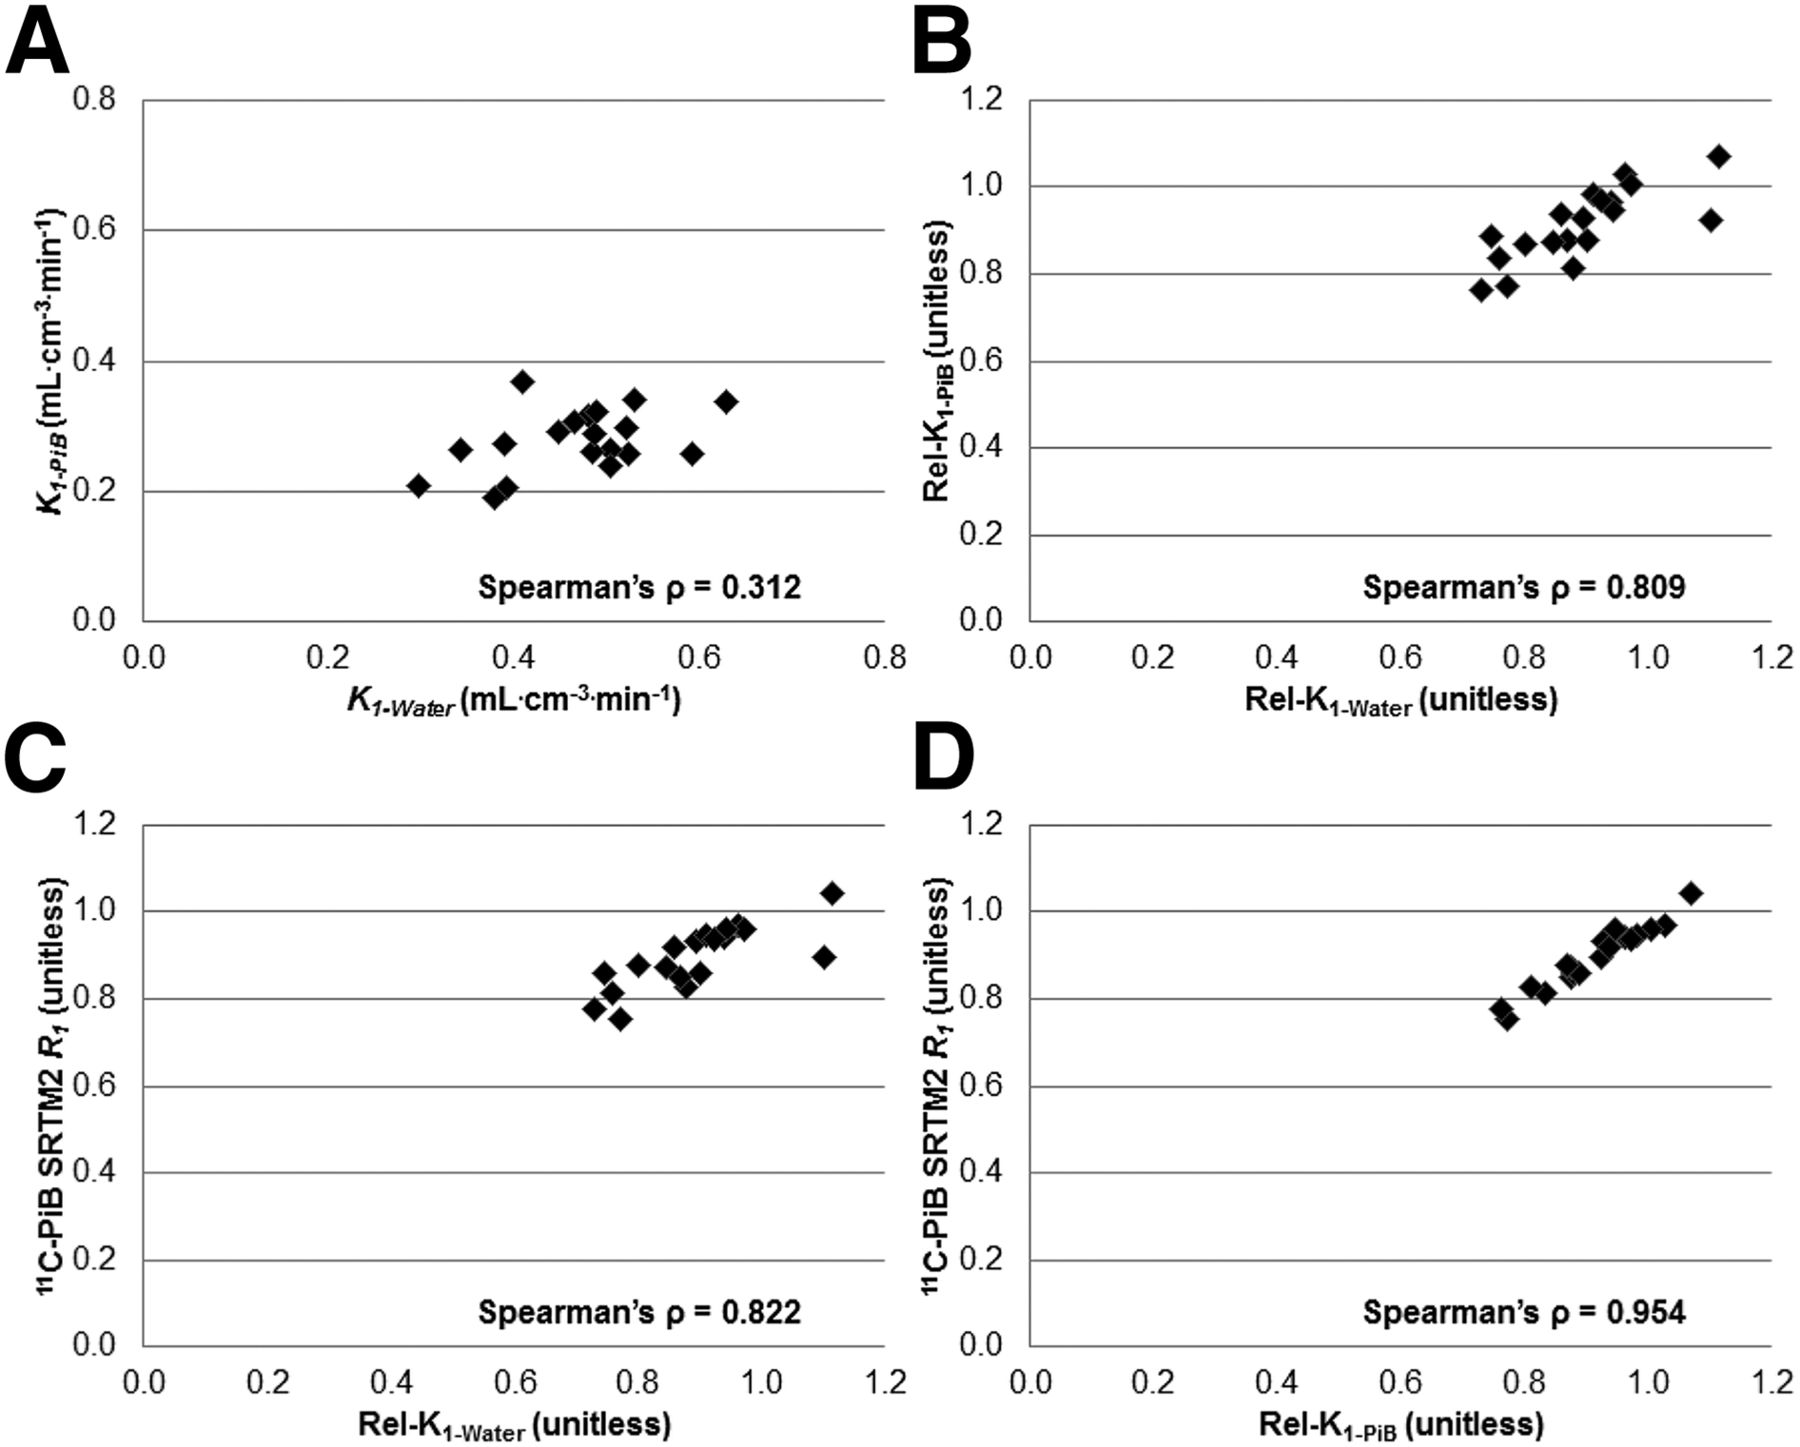
Scatterplots for global cortical region (CTX5) depicting relationship between direct delivery ([A] K1-Water and K1-PiB) and relative delivery ([B] Rel-K1-Water and Rel-K1-PiB; [C] Rel-K1-Water and 11C-PiB SRTM2-R1; [D] Rel-K1-PiB and 11C-PiB SRTM2-R1), with respective Spearman ρ values. There are different axes ranges for A and B–D.

Example parametric images of Rel-K1-Water and 11C-PiB SRTM-R1 and DVR for AD subject (age, 54 y; MMSE, 19) show that Rel-K1-Water and 11C-PiB SRTM-R1 provide similar distribution of relative flow (images not CSF-corrected).
Table 3 lists correlations between 15O-water and 11C-PiB delivery parameters (adjusted for CSF dilution). Correlations between K1-Water and K1-PiB were low to moderate (ρ ≈0.2–0.5) and mostly not significant after Bonferroni adjustment. Stronger correlations (ρ ≈0.5–0.8) were observed between Rel-K1-Water and Rel-K1-PiB (significant for most cortical ROIs after Bonferroni adjustment), with more ROIs showing significant correlation between Rel-K1-Water and 11C-PiB SRTM2-R1. Highest correlations (ρ ≈0.8–0.9, P < 0.001) were observed between relative 11C-PiB delivery parameters (Rel-K1-PiB and 11C-PiB SRTM2-R1). Correlation between 15O-water and 11C-PiB delivery measures without CSF dilution correction yielded similar results (data not shown).
Correlation Between 15O-Water and 11C-PiB Delivery Parameters*†
Delivery and Retention Measures
Table 4 shows mean 11C-PiB retention measures for CTX5 that are consistent with previously described group differences (30). Correlations between delivery parameters and 11C-PiB retention for CTX5 are shown in Table 5, noting lack of significant correlations after Bonferroni adjustment. Full correlation results between delivery parameters and 11C-PiB retention are shown in Supplemental Table 2. Correlations between K1-Water and 11C-PiB retention (CSF-adjusted) were generally negative and low and lacked statistical significance in primary cortical regions. Similar correlations were present when K1-Water and 11C-PiB retention were not CSF-adjusted (data not shown). In contrast, statistically significant correlations were evident but variable between 11C-PiB relative delivery and retention, mostly with nonarterial-based retention measures (CER90-DVR, SUVR70, SRTM2-DVR; Supplemental Table 2). ACG was the only primary cortical region that showed significant correlations (after Bonferroni adjustment) between relative 11C-PiB delivery and retention measures (ρ ≈0.8−0.9, P < 0.001). In contrast, without CSF dilution adjustment, no significant correlations were found between 11C-PiB delivery and retention (after Bonferroni adjustment, data not shown).
CTX5 11C-PiB Retention Measures
Correlation Between Delivery Parameters and 11C-PiB Retention for CTX5*†
DISCUSSION
This study focuses on single-session PET measurements of both quantitative CBF and Aβ plaque binding in controls, MCI, and AD subjects. The results show statistically significant correlations between relative delivery parameters of 15O-water and 11C-PiB PET (i.e., Rel-K1-PiB and SRTM2-R1) and lower trend level correlation between K1-Water and K1-PiB for primary cortical regions. Secondarily, minimal significant correlations were found between measures of delivery and 11C-PiB retention.
It is well established that the capacity of any radioligand to reflect specific binding is limited if ligand binding is rapid relative to ligand delivery from blood to brain (i.e., k3 > >K1 and delivery-limited). This was not the case for 11C-PiB, with early results showing a K1 of 0.22–0.23 mL⋅cm−3⋅min−1 (13), relative to k3 of 0.04–0.05 min−1 (for AD subjects). Early 11C-PiB studies also reported regional bias among semiquantitative binding measures, with an overestimation by SUVR and underestimation by reference-tissue binding measures (relative to arterial-based binding measures) (13). Limitations of SUVR are well established (31), and a 11C-PiB SUVR time-dependency study showed that 40- to 60-min and 50- to 70-min SUVR provided a reasonable compromise between physiologic validity, stability, sensitivity, and clinical feasibility (17). The current study includes data from these published 11C-PiB studies and unpublished paired 15O-water PET studies.
The primary study findings include lack of statistically significant correlations between K1-Water and K1-PiB in primary cortical areas, which may partly reflect technical differences including 11C-PiB injection over 20 s that reduces accuracy of K1-PiB estimation, as compared with K1-Water determined after rapid 15O-water bolus injection. Even lower correlations were observed between K1-Water and relative 11C-PiB delivery parameters (data not shown). However, after normalizing both K1-Water and K1-PiB to cerebellum, significant positive correlations emerged between Rel-K1-Water and Rel-K1-PiB in 4 of 5 primary cortical regions. This positive correlation is not likely driven by CER, as correlation between CER K1-Water and CER K1-PiB was not statistically significant (P = 0.064) and K1-Water RSD was similar across ROIs (∼17%–20%, including CER). These findings may reflect, in part, lower intersubject variability across relative (compared with absolute) delivery measures, as ratios may minimize some variability (e.g., scanner-related measurement variation, variation in intersubject physiologic state). Stronger correlations were observed between Rel-K1-Water and SRTM2-R1 (than for Rel-K1-PiB), presumably because of greater variance in Rel-K1-PiB as a calculated ratio of 2 independent parameter estimates, compared with R1 as a single ratio parameter directly estimated by SRTM2. As expected, correlations were strongest between Rel-K1-PiB and SRTM2-R1. Overall, these correlations were independent of CSF dilution correction, suggesting robustness against this confound.
The secondary findings showed variable significance for regional correlations between delivery (mostly 11C-PiB relative delivery parameters) and 11C-PiB retention that appear to be partly, if not mostly, related to CSF adjustment, as no significant correlations were observed without CSF correction. Correlations between 11C-PiB relative delivery and retention were most notable in ACG, a primary cortical region that exhibits early 11C-PiB deposition and cortical atrophy.
We sought to minimize bias in all kinetic methods but given that SRTM is key to this work, it is important to note potential sources of SRTM bias in its application to 11C-PiB kinetics that are described by 2-tissue compartments (rather than 1 compartment) and that range from specific AD kinetics to nonspecific controls kinetics that may be similar to cerebellum (32). SRTM2 was applied using an average subject-specific SRTM-k2′ constraint determined across ROIs (except CER). We acknowledge that this imperfect estimate of reference tissue clearance rate can bias retention measures, particularly when time–activity curves in CER and target ROIs are similar (i.e., 11C-PiB–negative), as reported for muscarinic-2 receptor-binding MRTM simulations (33). The k2′ constraints herein were not statistically different between 11C-PiB–positive and 11C-PiB–negative subjects (Mann–Whitney U test P = 0.278; cutoffs determined by Cohen, et al. (34)), yielded SRTM2-DVR values that were comparable to other binding measures, and most importantly did not strongly affect R1 that was a primary focus of this work. SRTM-R1 and SRTM2-R1 values were highly correlated (r2 range, 0.92 [MTC] to 0.99 [CTX5]). Bias in SRTM2-R1 (relative to SRTM-R1) was less than 10% for primary cortical regions (−3.6% for CTX5), low for PON (1%) and SWM (3.6%), but greater for THL (−8.4%). Yaqub et al. used SRTM as a reference tissue standard for evaluation of simplified voxel-based 11C-PiB analyses (e.g., SUVR, reference Logan, MRTM2 (35), RPM2, SRTM) and reported only a slight difference in quantitative performance across methods, strong correlations across binding outcomes (R2 > 0.95, except SUVR60–90), best performance by MRTM2 and RPM2, and simulations (6% noise) showing bias in RPM2-BPND of 0%, SUVR40–60 of 40%, and SUVR60–90 of 50% (14). We do not observe this level of high bias in SUVR using ROI-based analyses with lower noise than voxel-based, using SUVR determined within 40–70 min, and when the reference standard is arterial-based (SUVR50–70 bias 15%) rather than reference-based (SUVR50–70 bias 30%) (17).
The overall findings of this study are consistent with and relevant to findings by others that involved less direct comparisons of delivery. Blomquist et al. reported that changes in PaCO2 (e.g., from 5.0 to 7.2 kPa) led to changes of similar magnitude in both K1-PiB and CBF (≈50%–100%) in an anesthetized rhesus monkey, suggesting that K1-PiB may be a useful index of CBF (36). Meyer et al. reported on dual-biomarker imaging of regional Aβ load and neuronal activity with 11C-PiB using SRTM2 to assess both Aβ plaque load and relative delivery (19). The high correlations observed herein between Rel-K1-Water and PiB SRTM2-R1 provide direct quantitative evidence that 11C-PiB SRTM2-R1 may be a robust surrogate of regional relative CBF. In addition, 11C-PiB delivery was generally independent of retention, lending further support for determining dual-imaging measures from dynamic 11C-PiB imaging. Lastly, despite flow independence for cross-sectional 11C-PiB retention, a recent report by van Berckel et al. describes how longitudinal 11C-PiB SUVR can be sensitive to longitudinal flow changes (e.g., cortical flow change when reference flow is stable), and this is important to consider and better understand in future studies (20), including those performed with 18F-labeled Aβ PET imaging agents (37,38).
CONCLUSION
This study provides quantitative evidence supporting relative 11C-PiB delivery measures as surrogate indices of regional relative CBF. The results also offer further direct evidence that cross-sectional 11C-PiB retention is generally independent of CBF, including SUVR. This study contributes to a body of methodology work that seeks to better understand and define the capabilities of Aβ PET imaging that is needed to address long-term challenges.
DISCLOSURE
The costs of publication of this article were defrayed in part by the payment of page charges. Therefore, and solely to indicate this fact, this article is hereby marked “advertisement” in accordance with 18 USC section 1734. Financial support for this work was provided by the NIH (R01AG033042, P50AG005133, R01MH070729, R37AG025516, P01AG025204, K02AG027998), Dana Foundation, and Alzheimer’s Association. William E. Klunk and Chester A. Mathis are coinventors of 11C-PiB, and its license agreement is held between GE Healthcare and University of Pittsburgh. GE Healthcare provided no grant support for this study and had no role in preparing this manuscript. William E. Klunk has served as a consultant to GE Healthcare, Janssen, Pfizer, Lilly, AstraZeneca, Wyeth, Roche, and Elan. Chester A. Mathis has served as a consultant for GE Healthcare, Elan/Wyeth, Novartis, Janssen, Genzyme, Pfizer, Bristol Myers Squibb, IBA, and Baxter Bioscience. Oscar L. Lopez has served as a consultant for Lilly, Lundbeck, Merz, Lilly, and Baxter. Other authors have no conflicts of interest to disclose. No other potential conflict of interest relevant to this article was reported.
Acknowledgments
We thank the PET facility staff, particularly Cristy Matan and Christopher Cieply, for technical support. We thank the research volunteers and their families.
Footnotes
Published online Jun. 4, 2015.
- © 2015 by the Society of Nuclear Medicine and Molecular Imaging, Inc.
REFERENCES
- Received for publication November 28, 2014.
- Accepted for publication May 24, 2015.


Jump to section
Related Articles
Cited By...
- [18F]MK-6240 Radioligand Delivery Indices as Surrogates of Cerebral Perfusion: Bias and Correlation Against [15O]Water
- Measurement of Cerebral Perfusion Indices from the Early Phase of [18F]MK6240 Dynamic Tau PET Imaging
- Amyloid and Tau Pathology are Associated with Cerebral Blood Flow in a Mixed Sample of Nondemented Older Adults with and without Vascular Risk Factors for Alzheimers Disease
- Longitudinal Tau PET Using 18F-Flortaucipir: The Effect of Relative Cerebral Blood Flow on Quantitative and Semiquantitative Parameters
- Dynamic Amyloid PET: Relationships to 18F-Flortaucipir Tau PET Measures
- Longitudinal tau PET using [18F]flortaucipir: Comparison of (semi)quantitative parameters
- Validation of the Semiquantitative Static SUVR Method for 18F-AV45 PET by Pharmacokinetic Modeling with an Arterial Input Function
- Comparison of Early-Phase 11C-Deuterium-L-Deprenyl and 11C-Pittsburgh Compound B PET for Assessing Brain Perfusion in Alzheimer Disease