


Abstract
Increased brain uptake of 18F-AV45 visualized by PET is a key biomarker for Alzheimer disease (AD). The SUV ratio (SUVR) is widely used for quantification, but is subject to variability based on choice of reference region and changes in cerebral blood flow. Here we validate the SUVR method against the gold standard volume of distribution (VT) to assess cross-sectional differences in plaque load. Methods: Dynamic 60-min 18F-AV45 (291 ± 67 MBq) and 1-min 15O-H2O (370 MBq) scans were obtained in 35 age-matched elderly subjects, including 10 probable AD, 15 amnestic mild cognitive impairment (aMCI), and 10 cognitively healthy controls (HCs). 18F-AV45 VT was determined from 2-tissue-compartment modeling using a metabolite-corrected plasma input function. Static SUVR was calculated at 50–60 min after injection, using either cerebellar gray matter (SUVRCB) or whole subcortical white matter (SUVRWM) as the reference. Additionally, whole cerebellum, pons, centrum semiovale, and a composite region were examined as alternative references. Blood flow was quantified by 15O-H2O SUV. Data are presented as mean ± SEM. Results: There was rapid metabolization of 18F-AV45, with only 35% of unchanged parent remaining at 10 min. Compared with VT, differences in cortical Aβ load between aMCI and AD were overestimated by SUVRWM (+4% ± 2%) and underestimated by SUVRCB (−10% ± 2%). VT correlated better with SUVRWM (Pearson r: from 0.63 for posterior cingulate to 0.89 for precuneus, P < 0.0001) than with SUVRCB (Pearson r: from 0.51 for temporal lobe [P = 0.002] to 0.82 for precuneus [P < 0.0001]) in all tested regions. Correlation results for the alternative references were in between those for CB and WM. 15O-H2O data showed that blood flow was decreased in AD compared with aMCI in cortical regions (−5% ± 1%) and in the reference regions (CB, −9% ± 8%; WM, −8% ± 8%). Conclusion: Increased brain uptake of 18F-AV45 assessed by the simplified static SUVR protocol does not truly reflect Aβ load. However, SUVRWM is better correlated with VT and more closely reflects VT differences between aMCI and AD than SUVRCB.
According to the amyloid hypothesis, amyloid-β (Aβ) aggregation plays a primary role in the etiology of Alzheimer disease (AD) (1). The formation of plaques consisting of Aβ in brain parenchyma probably starts decades before the onset of clinical symptoms (2). As such, Aβ deposition appears a suitable target for both early diagnosis and novel AD treatments (3,4). To date, the best validated method to diagnose AD is via measurement of Aβ1–42, total tau and phospho-tau181 levels in the cerebrospinal fluid (5). This, however, requires a lumbar puncture, and the concentration of Aβ isoforms in the cerebrospinal fluid is not a direct measure for Aβ levels in the brain. Therefore, noninvasive methods for detection and direct quantification of Aβ in the brain have been introduced more recently through amyloid PET imaging (6,7). Among all the small-molecule PET ligands that were developed in the last decade, 11C-labeled Pittsburgh compound B is the most extensively studied (8,9). However, the short radioactive half-life of 11C (20 min) limits its use as a diagnostic tool. In 2012, 18F-AV45 (18F-florbetapir, commercial name Amyvid [Eli Lilly]) was launched as the first Food and Drug Administration–approved commercial radiotracer for Aβ PET imaging in patients, because of its fast kinetics, high selectivity for Aβ plaques, and the longer half-life of 18F (110 min) (10).
Currently, the most widely used quantification index in amyloid PET imaging is the semiquantitative SUV ratio (SUVR), which is the ratio of radioactivity concentration of the target and reference regions. The whole cerebellum and cerebellar gray matter (CB) are commonly chosen as references because they are notably free from fibrillar Aβ in sporadic AD. However, converging evidence from the Alzheimer Disease Neuroimaging Initiative patients (11) as well as other recent studies (12–15) suggested that using SUVR normalized to the subcortical white matter (WM) could more accurately track longitudinal Aβ changes in amyloid-positive subjects. Hence, the optimal reference region still remains debated. Moreover, because conditions of true equilibrium are not fulfilled in a bolus experiment at later time frames, SUVR may become sensitive to regional blood flow changes (11,16,17). This effect is of great concern because hypoperfusion is a well-known feature of AD pathology (18,19), and many elderly AD patients have concomitant cerebrovascular disease (20). Notwithstanding the success of SUVR already achieved for diagnostic and longitudinal follow-up purposes, absolute quantification by dynamic PET imaging combined with arterial blood sampling and subsequent pharmacokinetic modeling excels as the gold standard (9). This methodology provides the most accurate and robust quantification of tracer uptake, expressed as total volume of distribution (VT).
The present study was designed as a validation of the static SUVR method versus VT for 18F-AV45 PET imaging in cognitively healthy controls (HCs) and amnestic mild cognitive impairment (aMCI) and AD subjects. Both subcortical WM and CB were examined as potential reference regions for SUVR. In addition, we quantified brain perfusion by the 18F-AV45 delivery rate as well as via reference standard 15O-water PET scans.
MATERIALS AND METHODS
Subjects
Thirty-eight subjects were enrolled in the study, including 10 HCs and 18 aMCI and 10 AD subjects. Each subject underwent dynamic 60-min 18F-AV45 PET scanning, 15O-water PET scanning, MRI, and an extensive neuropsychologic examination. All patients were recruited from the Memory Clinics of Hospital Network Antwerp (ZNA) Middelheim and Hoge Beuken and University Hospital Brussels on a prospective basis. Their demographics are summarized in Table 1. A consensus clinical diagnosis was made by a panel of 3 medical doctors experienced with neurodegenerative brain diseases and dementia and was based on diagnostic criteria of the National Institute on Aging–Alzheimer's Association (21) and information gathered during the baseline clinical diagnostic workup at enrollment in the study. The cohort of cognitively healthy elderly was recruited among relatives of colleagues and patients visiting the memory clinic. The inclusion criteria were no neurologic or psychiatric antecedents; no organic disease involving the central nervous system after extensive clinical examination; and no cognitive complaint or decline. Cognitive decline was defined as performance of more than 1.5 SDs below the appropriate mean on the neuropsychologic subtests. Approval for the study was obtained from the Committee for Medical Ethics of the University of Antwerp/University Hospital Antwerp (14/12/130) and of Hospital Network Antwerp (ZNA) (4310), and all participants or their representatives provided informed consent.
Demographics, Including All Subjects
Radiosynthesis of 18F-AV45
18F-AV45 was synthesized from the precursor AV-105 by a modification of the method described by Yao et al. (22) on a Fluorsynthon I synthesis module (Comecer Netherlands) adapted for automated production of 18F-AV45.
Data Acquisition
A 3-dimensional T1-weighted magnetization-prepared rapid gradient echo scan (repetition time, 1,910 ms; echo time, 3.37 ms; inversion time, 1,100 ms) was obtained on a Siemens Trio Tim 3T MR scanner with 1-mm isotropic voxels. All PET scans were acquired using a Siemens Biograph mCT time-of-flight PET scanner. Dynamic 18F-AV45 PET data were recorded over 60 min after an intravenous bolus injection of 291 ± 67 MBq (mean ± SD). The images were reconstructed using a 3-dimensional iterative algorithm (TrueX ultraHD-PET; Siemens), with 2 iterations and 21 subsets, into 23 frames (8 × 15, 3 × 60, 5 × 120, 5 × 300, 2 × 600 s) followed by a gaussian filter of 2 mm in full width at half maximum on a 400 × 400 × 74 mm matrix with a 1 × 1 × 3 mm voxel size. All images were corrected for random and scattered coincidences and attenuation based on a delayed coincidence window and a low-dose CT, respectively. Dynamic 15O-water data were acquired over 2 min after a bolus injection of 370 MBq and reconstructed, with 3 iterations and 24 subsets, into 2 frames (2 × 60 s) followed by a gaussian filter of 4 mm in full width at half maximum on a 200 × 200 × 74 mm matrix with a 2 × 2 × 3 mm voxel size.
Simultaneously with the dynamic 18F-AV45 PET acquisition, continuous arterial blood sampling was performed by a coincidence detector system (Twilite; Swisstrace) to measure radioactivity in blood. To evaluate the in vivo metabolism of 18F-AV45, arterial blood samples (3 mL) were manually collected at 2, 5, 7, 15, 30, 45, and 60 min after injection and centrifuged for 5 min at 4°C (4,500g) to collect the plasma. Total radioactivity in the whole blood and plasma samples (300 μL) was measured in a cross-calibrated automated γ-counter (Wizard2 2480; Perkin Elmer). For plasma protein precipitation, acetonitrile (300 μL) was added to the plasma sample as well as 10 μL of 18F-AV45 reference standard (1 mg/mL) for ultraviolet cross-validation, after which the samples were vortexed for 30 s and centrifuged for 4 min at 4°C (4,500g). The radioactivity of supernatant and precipitate was measured in the γ-counter to derive the extraction yield. Separation of metabolites and intact tracer was achieved by injection of the supernatant (100 μL) into a high-performance liquid chromatography column (XBridge, C18, 5 μm, 150 × 4.6 mm [Waters]), operating at a flow rate of 1 mL/min and eluted with a mixture of NaOAC (0.05 M, pH 5.5)/acetonitrile (50/50, V/V). The eluate of the column was sampled by a fraction collector (0.5 min per fraction), and radioactivity was measured in the collected fractions using the automated γ-counter. The radioactivity due to 18F-AV45 and each radiometabolite was expressed as a percentage of the total peak areas.
Image Analysis
To define the regions of interest (ROIs), brain parcellation of the anatomic MR images was performed using automated knowledge-based segmentation in PMOD (version 3.6; PMOD Technologies Ltd.) for each subject. Interframe motion correction of the dynamic PET images was based on normalized mutual information registration with mid frames (5–15 min) as a reference. The motion-corrected 18F-AV45 and 15O-water data were separately coregistered onto the MR images to extract regional time–activity curves. Typical 18F-AV45 time–activity curves reflect those shown in a previous study (23). ROI-based partial-volume correction using a gaussian kernel with a full width at half maximum of 5.1 × 5.1 × 5.1 mm was performed to correct the time–activity curves (13). ROIs were averaged over the left and right hemispheres and included frontal, temporal, parietal, occipital, anterior cingulate, posterior cingulate, precuneus, and cerebellar cortical gray matter and whole subcortical WM reference regions. Additionally, alternative reference regions were also included: whole cerebellum, pons, part of the centrum semiovale, and a composite region (whole cerebellum + pons + semiovale).
Region-Based VT
The time course of the whole blood activity measured with the Twilite was decay- and background-corrected and cross-calibrated with the PET scanner at the day of the experiment. Therefore, a 0.9% NaCl phantom and catheter were filled with 74 MBq of 18F-FDG and measured in the PET and Twilite systems, respectively, to obtain the calibration factor. The calibrated blood activity concentration was approximated by a 3-exponential function and multiplied by both plasma-to-blood ratio and parent fraction to derive the metabolite-corrected plasma input function. All blood data processing was performed in PMOD (version 3.6). For model selection an array of pharmacokinetic models was tested on a subset of subjects (i.e., 5 subjects from each diagnostic group). Models included a 1-tissue-compartment model (1TCM), a 2-tissue-compartment (2TC) 4-parameter model with fitted blood volume fraction (2TCM-4k_Vb) and without Vb correction (2TCM-4k with Vb = 0), a 2TC 3-parameter model (2TCM-3k, that is, irreversible binding [k4 = 0]), and a simplified reference tissue model with fixed k2′ (SRTM2). The relative weights of the individual data points were set as the inverse of the variance of the PET measurement error (24). A delay was fitted between Twilite and PET measurements based on a coupled fit across the cerebral lobes. The 2TCM-4k_Vb using the metabolite-corrected plasma input function was selected on the basis of the lowest Akaike information criteria scores and applied to the dynamic PET data in PMOD. Total VT was determined from the 2TCM fit for each region based (VT = K1/k2(1 + k3/k4), with K1 (mL/min/mL) and k2 (1/min) the tracer transport rates from plasma to tissue and back, and k3 (1/min) and k4 (1/min) the tracer transport rates from the nondisplaceable to the specific binding compartment and back, respectively.
Region-Based SUVR
SUVR was calculated for each ROI from the 50- to 60-min postinjection data, using either CB, WM, or one of the alternatives as the reference region. The regional averaged 15O-water SUV was calculated as the tissue radioactivity concentration (first 1-min frame only) normalized by injected dose and body weight.
Voxel-Based Analysis
Parametric VT images were obtained using Ichise’s multilinear analysis 1 method (t* = 20 min) implemented in PMOD (version 3.3; PMOD Technologies Ltd.) (9,25). To validate the use of Ichise’s multilinear analysis 1 method for pixelwise modeling, ROIs were applied to the parametric VT images and regional means were correlated with VT from 2TCM (uncorrected). A voxel-based representation of the 18F-AV45 SUVR was created from the 50- to 60-min time frame, using either CB or WM as the reference region. Images of global blood flow were generated from the first frame of 15O-water SUV data.
Statistical Analysis
Data were analyzed in Prism (version 6; GraphPad Software), and all parameters are described as mean ± SEM. Group differences across brain regions were determined using 2-way ANOVA, and P values were corrected using Tukey’s multiple-comparisons test. The Pearson correlation coefficient r was calculated to examine the relationship between 18F-AV45 VT and SUVR as well as between 18F-AV45 K1 and 15O-water SUV for the different regions.
RESULTS
Subjects
A total of 10 HCs and 18 aMCI and 10 AD subjects enrolled in the study, of which 3 aMCI subjects were excluded. The metabolite analysis of 1 aMCI patient failed, most likely due to contamination, and another patient was fitted with a large temporal delay between Twilite and PET measurements (60 s instead of 28 ± 3 s, mean ± SD) during kinetic modeling. The VT values of a third aMCI subject were unrealistically high (more than 2 SDs from the average of all patients). There was no significant difference in age, sex, or years of education between all controls and patients (Table 1).
Clearance and Metabolism of 18F-AV45
There was rapid metabolization of 18F-AV45 (retention time, 7.5 min), with on average 35% ± 10% of intact parent remaining at 10 min (Fig. 1A). Three main metabolite peaks were detected in plasma eluting with retention times of 1.5 (M1), 4 (M2), and 9 (M3). Supplemental Figure 1 (supplemental materials are available at http://jnm.snmjournals.org) shows radiochromatograms and corresponding percentage peak areas of all compounds at the different time points. Supplemental Table 1 reports the percentage peak areas. The average (±SD) extraction yield significantly decreased (P < 0.0001, Student t test) from 94.8% ± 1.9% to 91.5% ± 1.6% (Fig. 1B). The average ratio of total radioactivity in plasma to blood significantly increased (P < 0.0001, Student t test) from 1.04 ± 0.06 at 2 min to 1.2 ± 0.09 at 60 min (Fig. 1C). The resulting metabolite-corrected plasma input function of the tracer is depicted in Figure 1D. There was no significant difference in extraction yield, plasma-to-blood ratio, and plasma input function between the 3 groups (colored, dotted lines in Fig. 1).
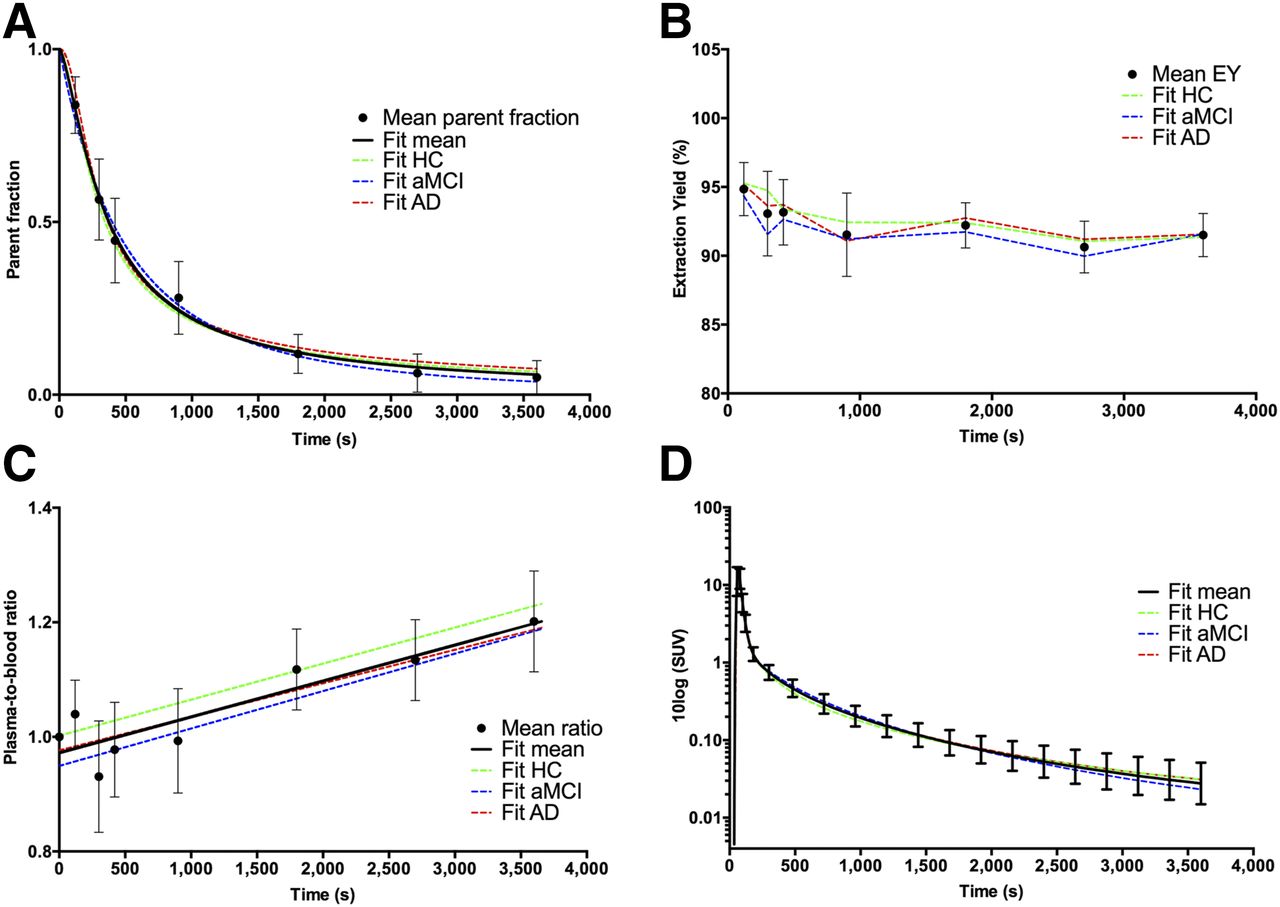
(A) Amount of unchanged 18F-AV45 (i.e., mean parent fraction ± SD, ●) at different time points after injection for all subjects investigated; black solid line represents Watabe curve fit. Colored, dotted lines represent Watabe curve fits to group-averaged parent fractions. (B) Extraction yield (EY). (C) Plasma–to–whole-blood ratios fitted with linear function. (D) Metabolite-corrected plasma input functions.
18F-AV45 Imaging Results
Regional-Based VT
All brain regions required the 2TCM-4k_Vb to adequately describe the time–activity curves as reflected by the lowest Akaike information criteria scores (125 ± 15, mean ± SD). VT based on 2TCM-4k_Vb showed strong regional correlation (r > 0.95, P < 0.0001) with VT from 2TCM-4k with Vb = 0 (Akaike information criteria, 141 ± 15). Significantly higher Akaike information criteria scores were reached for the 1TCM (227 ± 12), 2TCM-3k (165 ± 11), and SRTM2 (154 ± 25) (P < 0.0001, 2-way ANOVA for each ROI and model). The estimated kinetic parameters and VT from the 2TCM-4k_Vb in the precuneus, CB, and WM for all diagnostic groups are listed in Table 2. Mean VT (Fig. 2) was significantly increased compared with controls in the frontal, parietal, precuneus, and anterior and posterior cingulate cortical gray matter for the aMCI subjects (on average +32% ± 3%, P < 0.05). These regions and additionally the temporal lobe were significantly increased for AD subjects (on average +37% ± 3%, P < 0.05). Occipital and cerebellar VT were elevated for the aMCI and AD groups compared with the control group, although not significantly (P > 0.1).
Estimated Kinetic Parameters and VT (±SD) as Obtained by 2TCM-4k_Vb
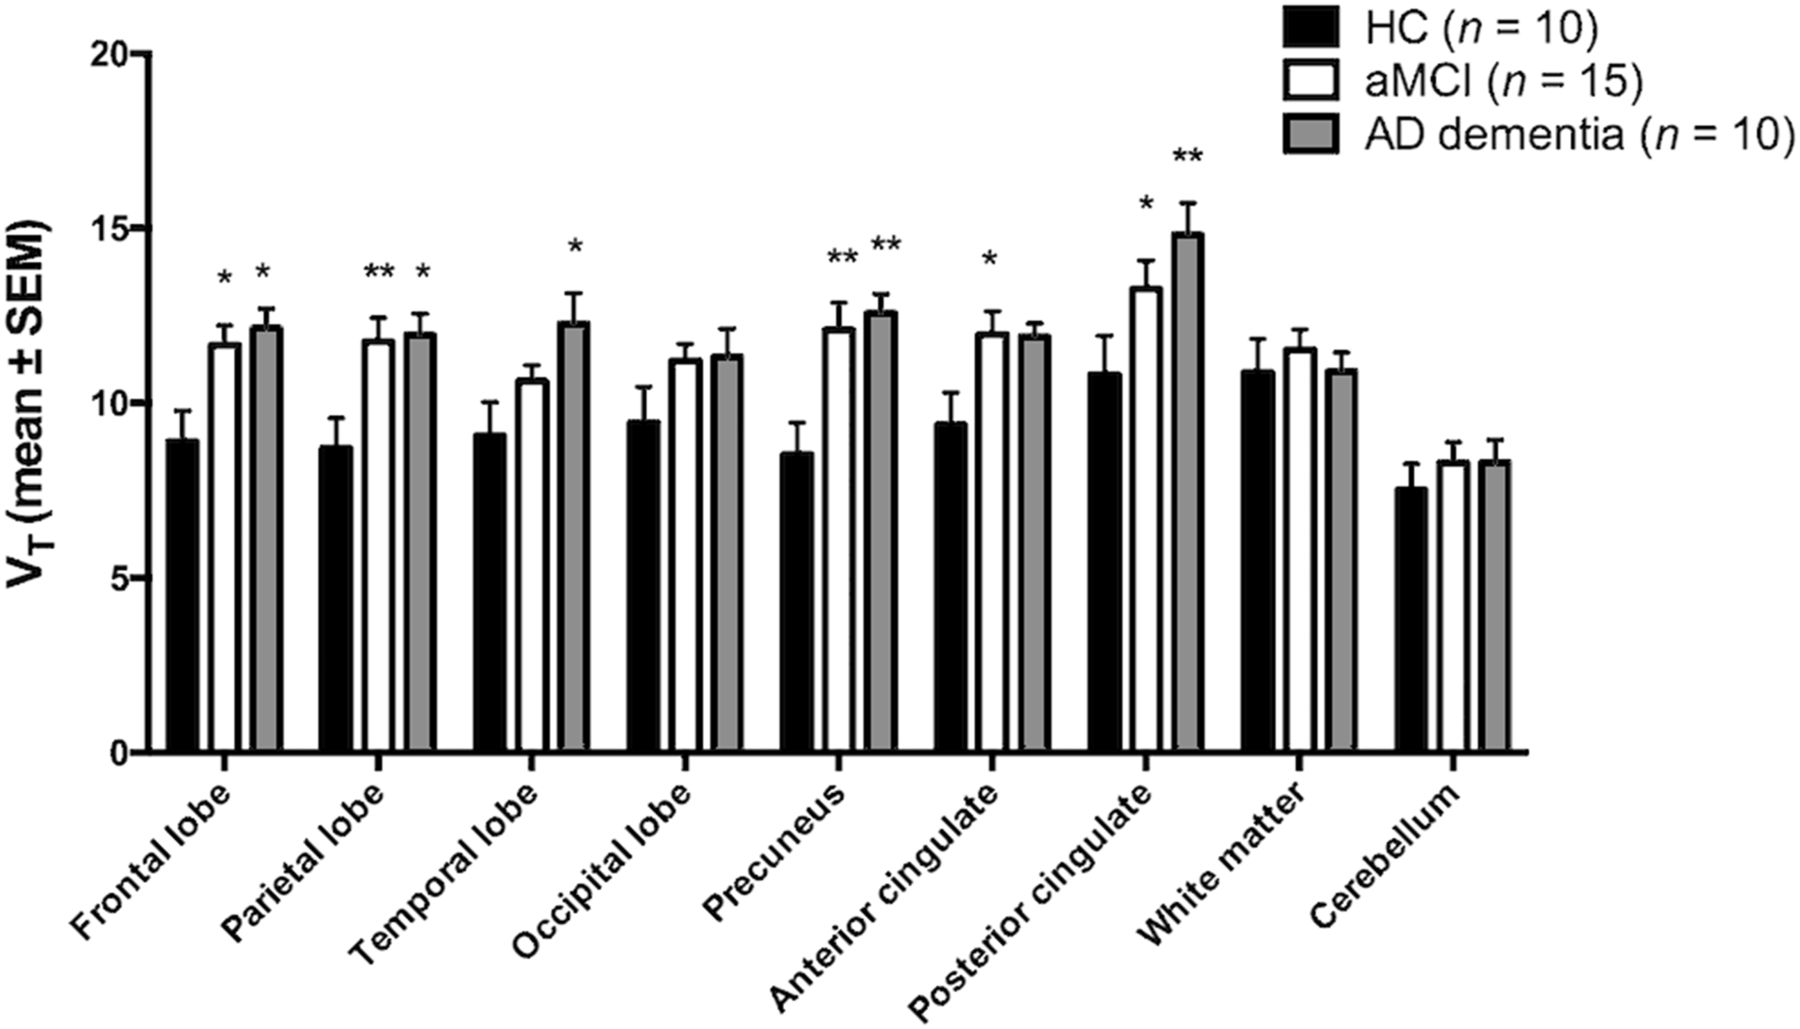
Regional 18F-AV45 VT (mean ± SEM) values for the 3 groups. Asterisks denote significant differences with HC group (*P < 0.05; **P < 0.01).
Regional-Based SUVR
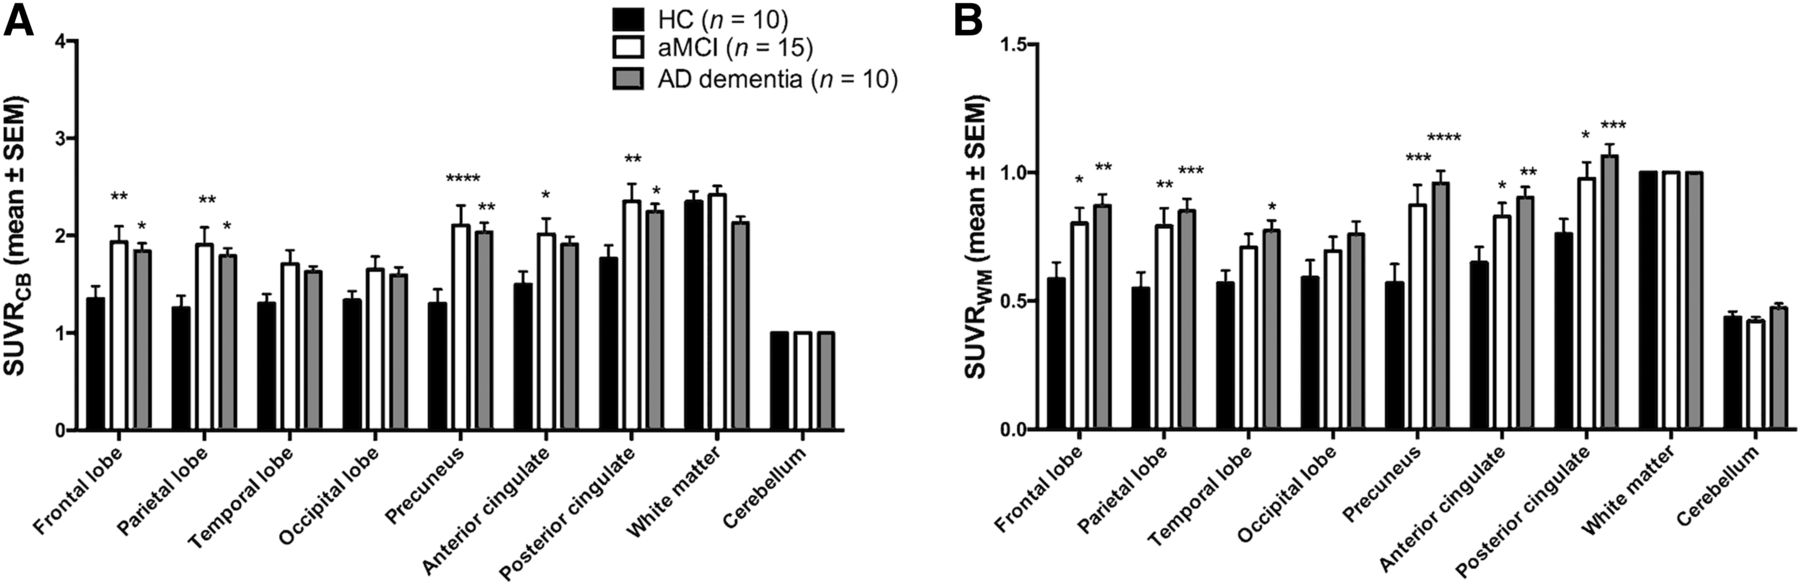
SUVRCB (Fig. 3A) was significantly increased compared with controls in the frontal, parietal, precuneus, anterior cingulate, and posterior cingulate cortical gray matter for the aMCI subjects (on average +45% ± 5%, P < 0.05). These regions, except anterior cingulate, were also significantly increased for AD subjects (on average +41% ± 6%, P < 0.05). SUVRWM (Fig. 3B) had significantly increased tracer retention in the frontal lobe, parietal lobe, precuneus, and anterior and posterior cingulate for the aMCI subjects (on average +38% ± 5%, P < 0.05). These regions and additionally the temporal lobe were significantly increased for AD subjects (on average +48% ± 5%, P < 0.05).

Regional 18F-AV45 SUVRCB (A) and SUVRWM (B) (mean ± SEM) values for the 3 groups. Asterisks denote significant differences with HC group (*P < 0.05; **P < 0.01; ***P < 0.001; ****P < 0.0001).
Comparison of SUVR Versus VT
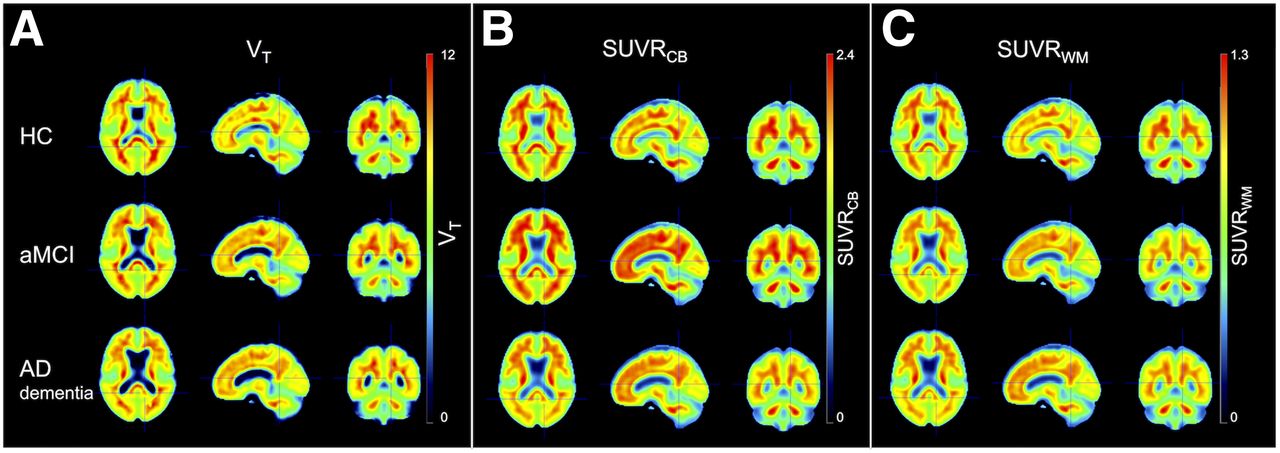
Compared with VT, differences in cortical Aβ load between the aMCI and AD group were overestimated by SUVRWM (+4% ± 2%) and underestimated by SUVRCB (−10% ± 2%). Differences in cortical Aβ load between the HC and aMCI groups were overestimated by both SUVRWM (+5% ± 2%) and SUVRCB (+12% ± 2%). Table 3 represents Pearson correlation coefficients between SUVR and VT for the different ROIs. Across diagnostic groups, VT correlated better with SUVRWM (r ranging from 0.63 for posterior cingulate to 0.89 for precuneus, P < 0.0001) than with SUVRCB (r ranging from 0.51 for temporal lobe [P = 0.002] to 0.82 for precuneus [P < 0.0001]) in all tested regions. Within diagnostic groups, SUVRWM correlated better with VT than SUVRCB for all tested regions, except for the anterior cingulate in AD and aMCI and the posterior cingulate in AD (Supplemental Table 2). Correlation coefficients between VT and SUVR to alternative reference regions were in between those obtained for SUVRCB and SUVRWM (Supplemental Table 3). VT and SUVR values that were not corrected for partial-volume effects are shown in Supplemental Figure 2. Correlation results of uncorrected data were in line with those of corrected data also revealing that there was a stronger correlation between VT and SUVRWM than between VT and SUVRCB (Supplemental Table 4). Group-averaged parametric maps of SUVR (50–60 min after injection) and VT are presented in Figure 4. There was significant correlation between VT of the 2TCM and Ichise’s multilinear analysis 1 graphical analysis (r = 0.65 for cerebellar gray, r > 0.84 for other ROIs, P < 0.0001). Figure 4B depicts the apparent decrease in tracer uptake from the aMCI toward the AD stage for SUVRCB, thereby confirming our regional-based results.
Pearson Correlation Coefficient of SUVRCB and SUVRWM with VT Across All Diagnostic Groups

Average spatially normalized 18F-AV45 VT (A), SUVRCB (B), and SUVRWM (C) images for the 3 groups.
Regional Blood Flow Results
15O-water SUV (Figs. 5A and 5B) showed that blood flow was decreased in AD compared with HC and aMCI in cortical regions (−11% ± 3% and −5% ± 1%, respectively) and in the reference regions (CB, −8% ± 12% and −9% ± 8%, respectively; WM, −10% ± 12% and −8% ± 8%, respectively), albeit nonsignificantly (P > 0.1). Similar results were seen for 18F-AV45 K1 derived from the pharmacokinetic modeling procedure (cortex, −13% ± 3% and −6% ± 1%, respectively; CB, −11% ± 7% and −10% ± 6%, respectively; WM, −11% ± 8% and −4% ± 7%, respectively) (Fig. 5C). Correlations between 15O-water SUV and 18F-AV45 K1 were moderate (r ranging from 0.50 for WM and frontal and temporal cortex [P < 0.01] to 0.68 for posterior cingulate [P < 0.0001]), whereas stronger correlations were observed between the relative flow measures 15O-water SUVRCB and 18F-AV45 K1/K1,CB (r ranging from 0.76 for occipital cortex to 0.93 for temporal cortex, P < 0.0001).
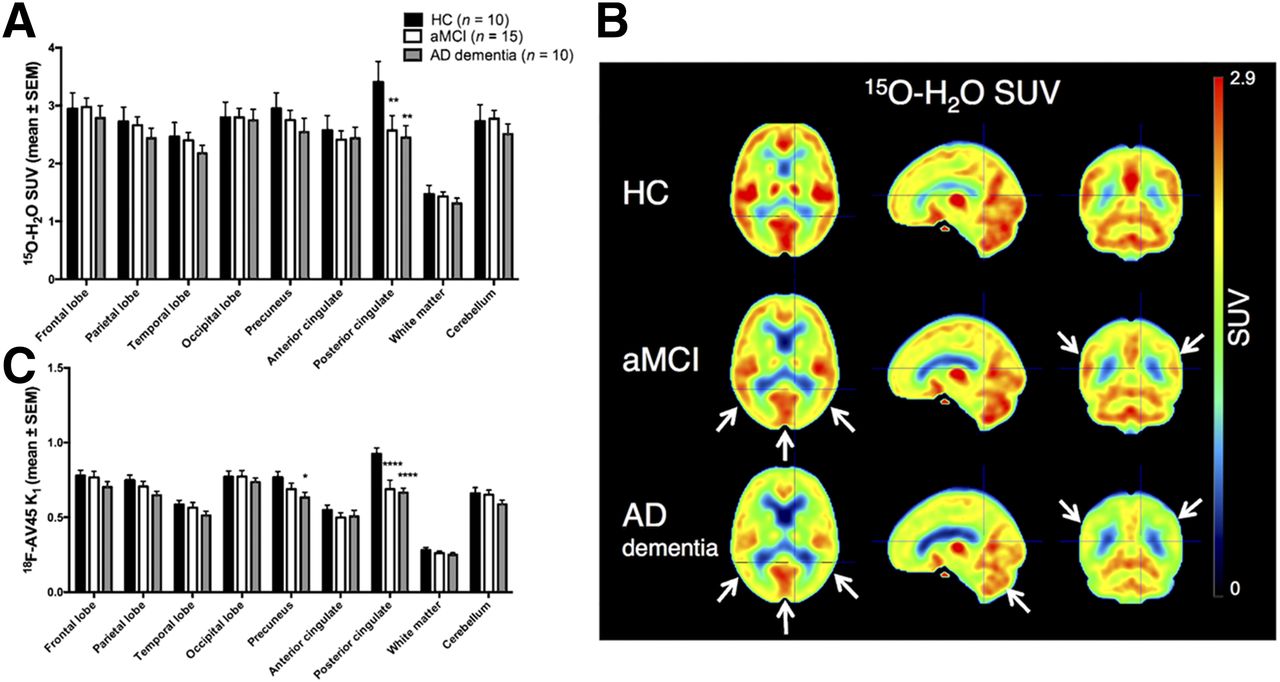
(A) Regional 15O-water SUV (mean ± SEM) values for the 3 groups. (B) Average spatially normalized 15O-water SUV images. White arrows indicate regions with reduced flow compared with controls (parietotemporal cortex, posterior cingulate cortex, cerebellum). (C) 18F-AV45 delivery rate K1 (mean ± SEM). Asterisks denote significant differences with HC group (*P < 0.05; **P < 0.01; ****P < 0.0001).
DISCUSSION
Because of practical considerations, the SUVR method is preferred over absolute quantification for measuring plaque load in the brain, because it avoids the long dynamic scanning protocols with simultaneous arterial blood sampling and subsequent pharmacokinetic modeling. However, to determine whether SUVR truly reflects Aβ load, it has to be validated against the quantitative gold standard VT.
Our metabolite analysis revealed that unchanged 18F-AV45 rapidly decreased over time with formation of 2 more polar and 1 less polar radiometabolite. The lowering of the extraction yield over time and the increasing plasma-to-blood ratio might be related to the formation of apolar metabolites that bind to plasma proteins. Prior studies described formation of 2 apolar metabolites identified as 18F-AV160 and 18F-AV267, but their contribution to the total PET signal was assumed to be minimal (10,23).
The regional 18F-AV45 time–activity curves could be described by the 2TC model with a blood volume fraction component and were used to derive VT. We found that tracer accumulation in cortical regions was highest for the AD group, intermediate for the aMCI group, and lowest for the HC group. HCs showed tracer accumulation predominantly in the WM.
Recent studies suggested using a WM reference region to quantify longitudinal SUVR changes (12–15). We confirmed for the first time by pharmacokinetic modeling on dynamic cross-sectional data that SUVRWM more closely reflects VT differences between aMCI and AD and that, across and within all diagnostic groups, it is better correlated with VT than SUVRCB. However, within the HC and AD groups correlations were weaker, which might be primarily due to the wider range of VT and SUVRs within the aMCI group. Other frequently used reference regions (whole cerebellum, pons, centrum semiovale, and a composite region) resulted in correlation coefficients in between those obtained for SUVRCB and SUVRWM.
In line with the literature (16,26,27), flow was reduced in aMCIs compared with controls, notably in more posterior-situated brain regions, including the precuneus and posterior cingulate. The AD group showed an additional flow reduction in the frontal and parietotemporal cortex. As such, higher cortical Aβ load (i.e., increased SUVR) was related to lower cerebral blood flow. Van Berckel et al. (16) suggested from experimental 11C-Pittsburgh compound B data and simulations that both global and regional flow changes affected the SUVRs. This effect was such that there was an increase in SUVR when cerebral blood flow was decreased in the target region while stable in the reference region (16,17). From our results, however, it appears that blood flow was also reduced in the reference regions of our AD subjects, whereas there was no significant tracer retention. Because WM regions have a slower tracer uptake and clearance rate than gray matter regions as well as other binding characteristics, differential flow effects on the SUV of CB and WM might partly explain differences found when using either CB or WM as a reference region for 18F-AV45 SUVR. Quantification of flow-induced 18F-AV45 SUV changes is important to ensure reliable longitudinal follow-up of Aβ-modifying treatment effects and is topic of further study.
In this study, we have used VT for validation of SUVR. Alternatively, the distribution volume ratio, defined as VT in the target region normalized by VT in the reference region (serving as an estimate of the nonspecific VT), could have been considered instead of VT. However, the distribution volume ratio also critically depends on the choice of a reference region. Another possible limitation is that WM SUV can be decreased by WM lesions (28), thereby increasing the false-positive rate for SUVRWM. In our dataset, however, we did not find any difference between the average WM SUV across the 3 diagnostic groups.
CONCLUSION
This study validated the simplified static SUVR method against the gold standard VT to assess cross-sectional differences in plaque load. 18F-AV45 assessed by SUVR does not truly reflect Aβ load. However, SUVRWM is better correlated with VT and more closely reflects the VT differences between the aMCI and AD group than SUVRCB.
DISCLOSURE
This study was funded in part by IWT TGO BIOADAPTAD under grant agreement no. 120835 A14/0161, University Hospital Antwerp, the University of Antwerp Research Fund, the Institute Born-Bunge (IBB, www.bornbunge.be), the Belgian Science Policy Office Interuniversity Attraction Poles (IAP) program (BELSPO, www.belspo.be), the Flemish Government initiated Methusalem excellence grant (EWI, www.ewi-vlaanderen.be), and the Flanders Impulse Program on Networks for Dementia Research (VIND). No other potential conflict of interest relevant to this article was reported.
Acknowledgments
We are thankful to Caroline Berghmans and Philippe Joye (Molecular Imaging Center Antwerp) for support with processing of the blood samples.
Footnotes
Published online Mar. 23, 2017.
- © 2017 by the Society of Nuclear Medicine and Molecular Imaging.
REFERENCES
- Received for publication September 21, 2016.
- Accepted for publication March 6, 2017.


Jump to section
Related Articles
Cited By...
- Amyloid-PET of the white matter: relationship to free water, fiber integrity, and cognition in patients with dementia and small vessel disease
- White Matter Reference Region in PET Studies of 11C-Pittsburgh Compound B Uptake: Effects of Age and Amyloid-{beta} Deposition
- Validation of Noninvasive Tracer Kinetic Analysis of 18F-Florbetaben PET Using a Dual-Time-Window Acquisition Protocol