


Abstract
Amyloid-β (Aβ) deposition as seen on PET using an Aβ-binding agent is a critical diagnostic biomarker for Alzheimer disease (AD). Some reports suggest using white matter (WM) as a reference region for quantification of serial Aβ PET studies; however, nonspecific WM retention in Aβ PET in people with dementia or cognitively unimpaired (CU) has been widely reported and is poorly understood. Methods: To investigate the suitability of WM as a reference region and the factors affecting WM 11C-Pittsburgh compound B (11C-PiB) uptake variability, we conducted a retrospective study on 2 large datasets: a longitudinal study of participants (n = 577) who were CU, had mild cognitive impairment, or had dementia likely due to AD; and a cross-sectional study of single-scan PET imaging in CU subjects (n = 1,349). In the longitudinal study, annual changes in WM 11C-PiB uptake were assessed, and in the cross-sectional study, WM 11C-PiB uptake was assessed relative to subject age. Results: Overall, we found that WM 11C-PiB uptake showed age-related increases, which varied with the WM regions selected. Further, variable annual WM 11C-PiB uptake changes were seen with different gray matter (GM) 11C-PiB baseline uptake levels. Conclusion: WM binding increases with age and varies with GM 11C-PiB. These correlations should be considered when using WM for normalization in 11C-PiB PET studies. The cerebellar crus1+crus2 showed no increase with age and cerebellar GM+WM showed minimal increase, supporting their use as reference regions for cross-sectional studies comparing wide age spans. In longitudinal studies, the increase in WM uptake may be minimal in the short-term and thus using WM as a reference region in these studies seems reasonable. However, as participants age, the findings may be affected by changes in WM uptake. Changes in WM 11C-PiB uptake may relate to disease progression, warranting examination of the causes of WM 11C-PiB uptake.
See an invited perspective on this article on page 1581.
Amyloid-β (Aβ) plaque accumulation in the brain as measured by PET has become a critical diagnostic biomarker for Alzheimer disease (AD) (1). Given its implications for prognosis and potential early intervention (2), reliable quantitative measurement of Aβ deposition using PET has been an important topic of discussion (3–5).
For inter- and intrasubject semiquantitative Aβ PET imaging, obtaining the standardized uptake value ratio (SUVR) of cortical areas relative to a reference region was initially shown to closely mimic the Logan graphical distribution volume ratio shown in a 11C-Pittsburgh compound B (11C-PiB) Aβ PET study (6). For this reason, most large studies of Aβ deposition have used delayed imaging and have used the cerebellum as a reference region for normalization (7).
Recently, several longitudinal Aβ PET studies have suggested including white matter (WM) regions as reference areas for SUVR (5,8–10). Longitudinal 18F-florbetapir Aβ PET studies report that as a reference region, WM has stronger correlations with cerebrospinal fluid Aβ1–42 level and has less variability than the cerebellum (8,10). In addition, a cross-sectional 18F-AV45 Aβ PET study showed that SUVR using the entire subcortical WM as a reference region had a higher correlation with distribution volume ratio than did SUVR of the cerebellum (11). In a 11C-PiB PET study of AD patients at 3 different points in time, we showed that supratentorial WM with the cerebellum included was the most reliable reference region in representing disease progression over time (5).
The benefit of WM over the cerebellum as a reference region is that there is a larger region over which to average the signal, potentially leading to less noise. WM measurements may also be more resistant to small degrees of misregistration during image quantification (12). In addition, the cerebellar signal is collected at the edge of the scanner field of view where sensitivity is lower (8,9).
A pervasive finding in Aβ PET studies is the substantial retention of the tracer in the WM of both subjects with dementia and healthy controls (13). WM uptake has been observed with every Aβ PET imaging agent to a greater or lesser degree, independent of the presence of Aβ deposition (14–17). The mechanism of this binding is poorly understood, and its nonspecificity is attributed mainly to its nondisplaceable and nonsaturable characteristics seen in several 11C-PiB PET studies (7,18,19).
Generally, WM uptake has not been a point of contention in disease categorization (13). However, because WM is being considered as a reference region, it is important to understand factors that affect WM uptake so as to assess its suitability for longitudinal studies for disease progression assessment and therapy evaluation studies in which changes in individual amyloid levels may be small and more easily affected by small changes in normalization region effects.
To investigate potential variables affecting WM 11C-PiB uptake, we conducted a retrospective study evaluating the WM 11C-PiB binding in 2 large population datasets: a longitudinal study of serial 11C-PiB PET uptake in cognitively unimpaired (CU), mild cognitive impairment (MCI), and dementia likely due to AD (ADD) groups; and a cross-sectional study of single-scan 11C-PiB imaging versus age in a CU group. Further, we evaluated annual WM 11C-PiB uptake increases as they related to changes in gray matter (GM) uptake to assess its relationship to disease progression. These findings are discussed relative to the implications and potential confounds in using WM SUVR normalization and categorizing levels of amyloid deposition.
MATERIALS AND METHODS
Participants
Participants were drawn from the Mayo Clinic Study of Aging epidemiological study (20). The study was approved by Mayo Clinic and Olmstead Medical Center Institutional Review Boards, and all subjects signed an informed consent (Clinical trial #NCT00950430). Two large population datasets were extracted from this study: longitudinal data (n = 577); and cross-sectional data (n = 1,349) in which 11C-PiB imaging was collected from 2006 to 2015, as described in Table 1. All subjects were categorized by neurologists, neuropsychologists, and study nurses through our consensus diagnosis using quantitative data from a brief mental status examination, 9 neuropsychological tests, and the Clinical Dementia Rating Scale (20). The longitudinal data consisted of subjects who were categorized as CU, MCI, or ADD. ADD is defined as being clinical diagnosis of Alzheimer disease without biomarker verification. Each clinical classification was further divided into Aβ-negative (A−) and Aβ-positive (A+) based on the global GM 11C-PiB SUVR cutoff value of 1.4 SUVR (21). For the present analysis, we relabeled the study groups into A− (CU−, MCI−, and ADD−) and A+ (CU+, MCI+, and ADD+).
Participants Demographics
Imaging Method
11C-PiB PET imaging was performed under Food and Drug Administration Investigational New Drug approval (#77924) and synthesized on-site at the Mayo Clinic Cyclotron Facility. 11C-PiB PET/CT studies were performed as previously described in Lowe et al. (22), using GE scanners (Discovery 690XT and Discovery RX; GE Healthcare). Standard iterative reconstructions (256 matrix, 300 mm field of view, 1.17 × 1.17 × 3.27 mm voxel size) with corrections for attenuation, scatter, random coincidences, and radioactive decay were applied as well as a 5 mm Gaussian postfilter as previously described (5). T1-weighted MRI scans were acquired on 3-T scanners (Discovery MR750, Signa HDx, Signa HDxt, and Signa Excite; GE Healthcare) for region localization and masking, and for partial-volume correction (PVC).
Image and Statistical Analysis
MRI T1 and 11C-PiB scans were coregistered using SPM12 with 6° of freedom. Resampling between MRI and PET resolutions was performed using ANTs software tools with third-order B-spline interpolation. Two-compartment PVC was applied for cerebrospinal fluid correction. Atlas regions of interest (ROIs) were resampled to subject spaces also using ANTs with nearest-neighbor interpolation (5).
ROI voxels that were deemed primarily nontissue according to the T1 MRI segmentations were omitted. Median values were computed for each of these regions and averaged, weighted by region size, to produce the composite median value. Two representative ROIs within WM were used for analysis as shown in Figure 1: periventricular and subcortical (23). These ROIs were subdivided to frontal, occipital, parietal, and temporal areas on the basis of the anatomic lobe discrimination of the STAND400 brain template (24). Additional ROIs were used for comparison as well, including the corpus callosum (anterior and posterior), brain stem, cerebellum WM, and cerebellum WM+GM, as well as eroded subcortical WM and composite (voxel-weighted median average of cerebellum WM+GM, brain stem/pons, and eroded subcortical WM), which was designed to emulate regions from the paper by Landau et al. (8). The global GM 11C-PiB ROI included GM of parietal, cingulate precuneus, prefrontal, orbitofrontal, temporal, and anterior cingulate regions (25). If not stated otherwise, the cerebellar crus1+crus2 voxel signal were used as the normalization region (denominator) for all SUVRs. In addition to and separate from the SUVR, we also assessed the SUV calculated from dose and weight normalization to describe the age associations of the ROIs. All analyses were conducted using R statistical software version 3.3.1 (26). Mixed-effects linear regression models using age at baseline as the time scale were used to estimate change in WM SUVR over time in the longitudinal dataset. Random subject-specific intercepts and slopes were included. We fit separate models for each region. To evaluate the effect of Aβ, a second linear mixed-effects model was fit including abnormal PiB and an abnormal PiB by time interaction. Together these fixed effects allowed WM SUVR to change with possibly different rates of decline by A− or A+ PiB status. All outcome measures were log-transformed to reduce skewness and to allow for interpretation of slope estimates as approximate annual percentage change (27). This procedure also enables the comparison of several different regions across a similar scale. We modeled the log of SUVR to estimate rate of accumulation expressed as percentage per year.
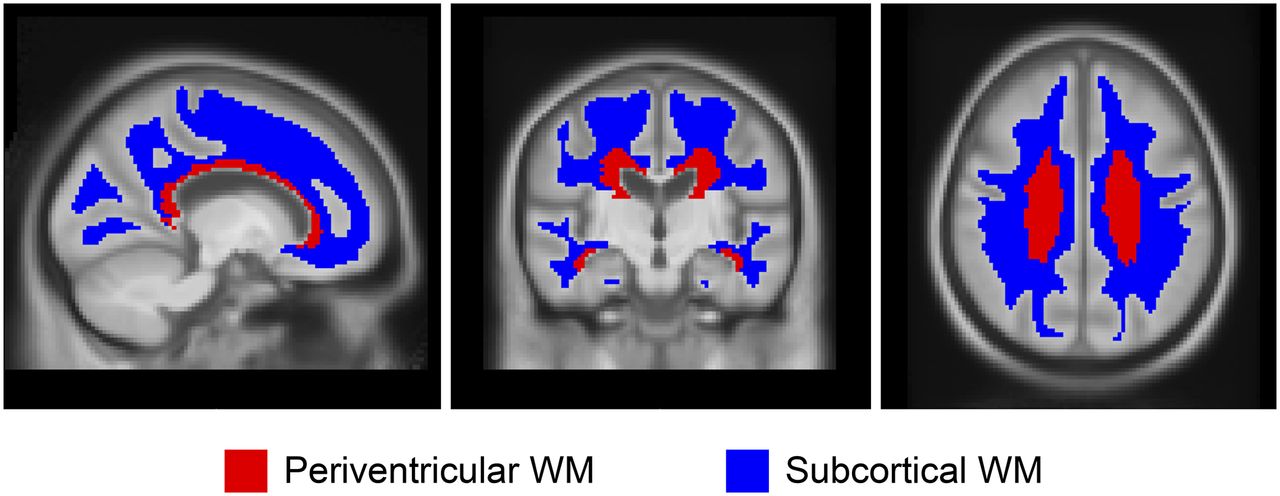
ROIs in WM. Two ROIs, periventricular and subcortical, within WM reference regions are shown.
The age relationship to WM uptake was analyzed in a cross-sectional sample of CU subjects by fitting a linear regression model between age and SUV (or SUVR). To test for evidence of age-related differences between groups, we summarized the P values from an age by abnormal PiB interaction.
We compared annual change in global GM PiB SUVR and annual change in WM PiB SUVR using a 2-stage approach. First, we applied linear regression to examine the relationship between age and SUVR for each subject. The slope of the linear regression represents an estimate of the annual SUVR change for a given subject. Given the varying number of scans per subject, this technique has the advantage of allowing all scan data for a given subject to be used in the estimation of change. Change was estimated separately for global GM PiB SUVR and WM PiB SUVR, and the 2 measures were compared. To allow for differing rates of accumulation, we conducted linear regression between the 2 change measures by Aβ status, and the strength of association was determined by Pearson’s correlation coefficient. Additionally, to compare annual WM PiB SUVR change and GM PiB SUVR at baseline, we calculated Spearman’s correlations and fit local polynomial regression (loess) models to allow for nonlinear trends.
RESULTS
Annual WM 11C-PiB SUVR Percentage Change in Longitudinal Data
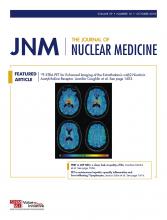
The estimated annual WM 11C-PiB SUVR percentage change using a linear mixed-effects model in the longitudinal data is shown in Figure 2 and Supplemental Table 1 (supplemental materials are available at http://jnm.snmjournals.org). Figure 2A shows annual WM 11C-PiB SUVR percentage increase in CU, MCI, and ADD. The annual global GM 11C-PiB SUVR showed a 1.9% increase. The subcortical WM area showed the highest annual percentage increase among the WM ROIs, ranging from 1.2% to 1.5%. The periventricular WM area showed annual increase ranging from 0.4% to 1.1%. The eroded subcortical WM and composite had a similar range as periventricular, having 0.9% and 0.6% annual increase, respectively. The corpus callosum (anterior and posterior), brain stem, and cerebellum WM annual increase ranged from 0.3% to 0.9%, with the cerebellum GM+WM showing the lowest annual increase of 0.2%. The slope is significantly different from 0 at the 0.05 level, if the 95% confidence interval excludes zero; therefore, all WM ROIs showed significant annual increases in SUVR percentage change.

Annual WM 11C-PiB SUVR percentage change in longitudinal data. (A) Regional increase in WM 11C-PiB uptake. (B) Difference in WM accumulation (A− vs A+).
Although both A− and A+ groups showed annual WM 11C-PiB SUVR percentage increase, the increase rate varied between A− and A+ for each of the ROIs (Fig. 2B). The A+ group showed faster annual increase for the global GM (as would be expected from the cortical amyloid accumulation signal bleed-in) and subcortical WM (likely a bleed-in effect), whereas the A− group showed faster annual increase for the periventricular WM, corpus callosum, brain stem, cerebellum WM, and eroded subcortical WM. Cerebellum GM+WM showed no rate difference between A− and A+.
Age-Dependent WM Uptake Change in Cross-Sectional CU Data
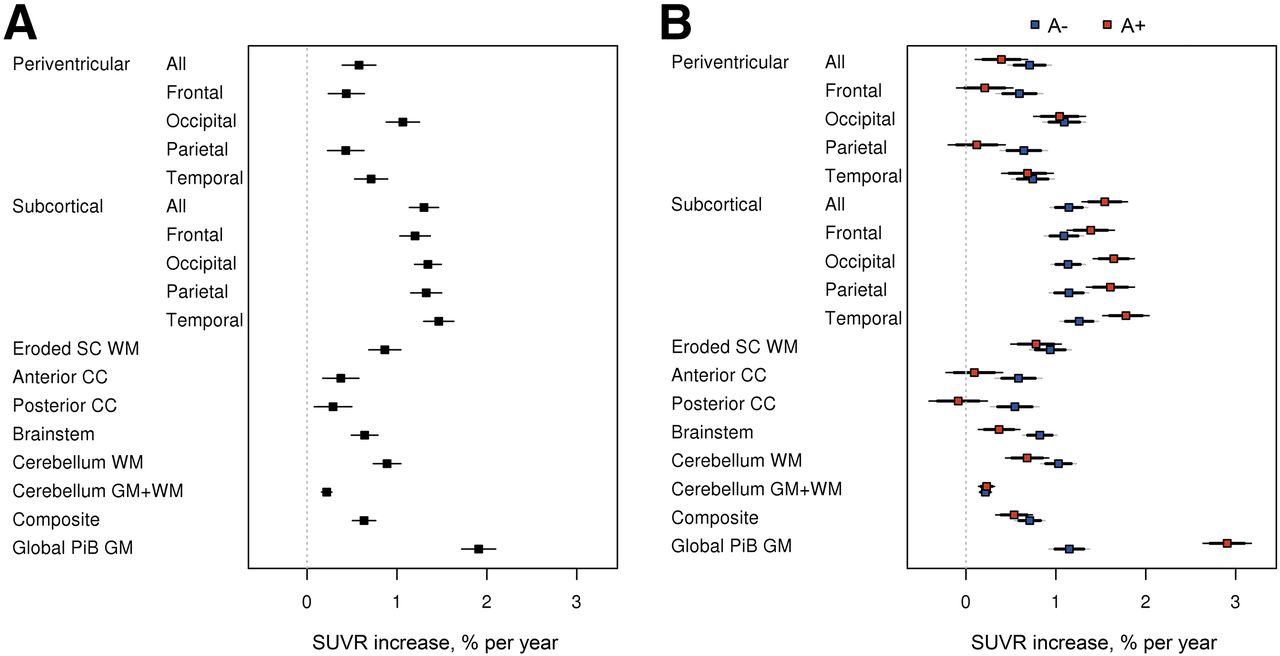
To confirm whether the annual WM uptake increase is also observable in cross-sectional data, we selected a CU group and compared the WM 11C-PiB uptake related to age using different reference regions (Fig. 3; Supplemental Table 2). We confirmed an age-related increase in the periventricular WM SUVR (slope = 0.03, ρ = 0.19), subcortical WM SUVR (slope = 0.07, ρ = 0.37), and cerebellum GM+WM (slope = 0.01, ρ = 0.34) when normalized to cerebellar crus (Fig. 3A). Changing the reference region to cerebellum GM+WM showed a similar trend (Fig. 3B), with a trend toward a smaller slope in supratentorial WM, periventricular WM SUVR (slope = 0.02, ρ = 0.12), and subcortical WM SUVR (slope = 0.05, ρ = 0.33). The cerebellum crus1+crus2 GM slope (slope = −0.01, ρ = −0.31) became slightly negative with the inclusion of the cerebellar WM in the denominator. In addition to and separate from the SUVR, we assessed SUV with age as an alternate normalization method. The SUV of periventricular (slope = 0.04, ρ = 0.17), subcortical (slope = 0.07, ρ = 0.28), and cerebellum crus1+crus2 (slope = 0.01, ρ = 0.06) regions showed slopes similar to those of SUVR normalization (Fig. 3C; Supplemental Table 2). Finally, we evaluated the cerebellar reference region atrophy effect by applying 3-compartment PVC to the cerebellar GM reference region (atrophy corrected) and confirmed the WM age trend was still present and that the slope was similar to that of the 2-compartment PVC results (atrophy uncorrected) (Supplemental Fig. 1).

Age-dependent WM uptake change in cross-sectional CU data (SUVR and SUV). (A) Age and SUVR scatterplot with linear regression using cerebellum crus1+crus2 GM as reference region. (B) Age and SUVR scatterplot with linear regression using cerebellum GM+WM as reference region. (C) Age and SUV scatterplot with linear regression.
Comparing Annual WM 11C-PiB SUVR Change with Annual GM 11C-PiB SUVR Change
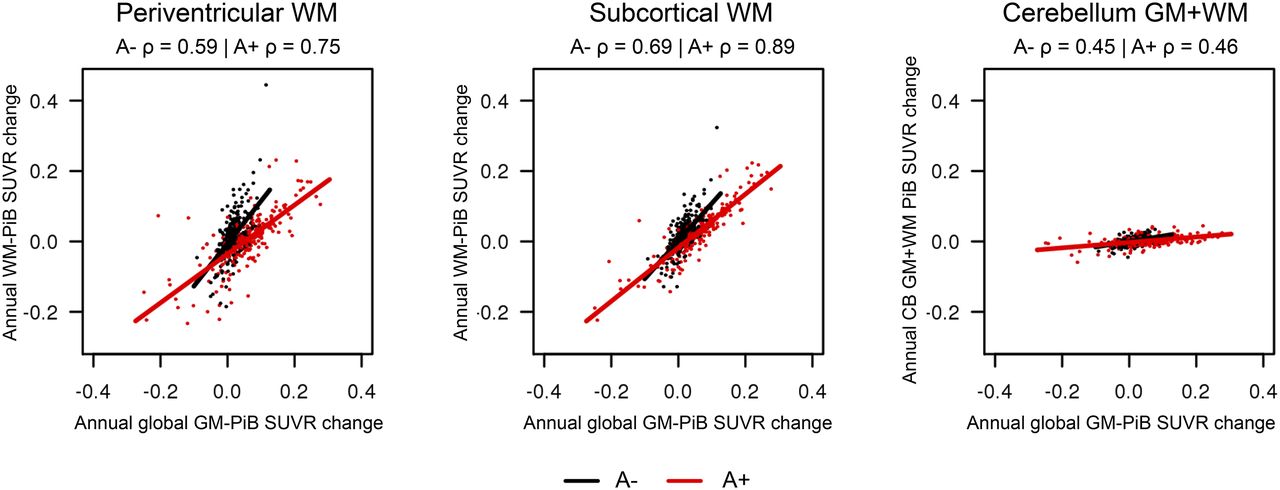
We saw a correlation between annual WM 11C-PiB SUVR change and annual global GM 11C-PiB SUVR change in the longitudinal data shown in Figure 4. Periventricular WM showed a correlation between annual WM and global GM 11C-PiB SUVR change (A−: slope = 1.21, P < 0.001 and A+: slope = 0.69, P < 0.001). Subcortical WM showed correlation between annual WM and global GM 11C-PiB SUVR change (A−: slope = 1.07, P < 0.001 and A+: slope = 0.76, P < 0.001). Cerebellum GM+WM showed low correlation with the global GM 11C-PiB SUVR change (A−: slope = 0.16, P < 0.001 and A+: slope = 0.08, P < 0.001).

Comparison of annual WM 11C-PiB SUVR change with annual GM 11C-PiB SUVR change. Scatterplot between annual change in global GM 11C-PiB SUVR and annual change in regional WM 11C-PiB SUVR by Aβ status with linear regression line among A− (black) and A+ (red).
Comparing Annual WM 11C-PiB SUVR Change with GM 11C-PiB SUVR Baseline Values
Figure 5 shows the relationship between the annual WM uptake change and baseline GM 11C-PiB in the longitudinal data. Depending on the global GM 11C-PiB SUVR baseline, there are different rates in the annual WM 11C-PiB SUVR change. In A+ participants, both ROIs (periventricular WM and subcortical WM) showed a trend of greatest change in the WM 11C-PiB annual increase at 1.9–2.1 GM 11C-PiB SUVR baseline values, and the rate showed decrease at the higher GM 11C-PiB SUVR baseline levels (>∼2.7). At the lowest global GM 11C-PiB SUVR baseline values (representing the A− group [blue circles]), increases of WM 11C-PiB annual change for both periventricular and subcortical WM ROIs were the highest. The relationship between within-subject annual SUVR change and baseline age had no distanced effect, implying the annual increase rate itself shows minimum age related effect (Supplemental Fig. 2).

Comparison of annual WM uptake change and baseline global GM 11C-PiB in longitudinal data. Spearman correlations of Loess curve are shown at top of each panel over all subjects, among A− (blue) and A+ (red).
DISCUSSION
The causes of WM 11C-PiB uptake in Aβ PET imaging remain largely unknown, but its effects are important to understand when WM is used as a normalization region for quantification of cortical Aβ tracer binding. Changes over time in WM uptake could affect cortical GM SUVR results. In this study, we found that WM 11C-PiB uptake increases with age and varies with GM Aβ deposition and with the area of WM sampled.
The simplest explanation for some variations in signal in subcortical WM 11C-PiB would be spillover of the GM Aβ signal into subcortical WM because this region includes the area of WM closest to GM. The fact that the subcortical WM had the highest annual increase and a steeper age-dependent increase compared with periventricular WM would support this, as would the fact that the A+ group had a greater annual uptake increase in subcortical WM than the A− group. For this reason, investigators using WM as a reference region tend to avoid selecting WM regions close to GM (5,8,9). Our results support this approach in that we observed a lower level of annual 11C-PiB uptake increase in periventricular or eroded subcortical WM ROIs in both longitudinal and cross-sectional samples.
Nevertheless, annual WM 11C-PiB increases are seen in periventricular WM and other WM regions such as corpus callosum, cerebellum WM, and also in eroded subcortical WM. These values are moderate (0.4%–1.1%) compared with the annual GM increase (1.9%), but are statistically significant. These increases are found in both A− and A+ populations and appear in WM areas at a great enough distance from GM that cannot be explained by a GM spillover effect.
The relatively slower kinetics of WM than GM, which results in a slower clearance rate (13,18), may explain WM 11C-PiB uptake. This could also explain the age-related increase in WM 11C-PiB binding, because cerebral perfusion on average declines with age (28), thus slowing WM clearance of the tracer in old versus young. Blood flow has been reported to be slower in WM than GM (29,30). Delays in delivery (31) and slower clearance of the tracers (32) in WM have been previously described in molecular imaging studies. For example, 11C-PiB clearance was reported to be slower in WM than GM in AD and CU subjects (18).
Studies using MRI to measure white matter hyperintensity have proposed that cerebral small-vessel disease can lead to reduced Aβ clearance and to increased cerebral GM 11C-PiB in AD (33,34). However, white matter hyperintensity measurements in studies of WM 11C-PiB uptake have found reduction in binding (35) and that WM lesions can reduce WM 11C-PiB binding in cognitively impaired (36) as well as in multiple sclerosis patients (37).
Another possible explanation of WM uptake may be the lipophilic nature of Aβ PET tracers that may enhance binding of the high lipid content of WM (7). This possibility is further supported by histopathologic studies (38). However, given the generally agreed on concept of age-related myelin loss, our age-related WM 11C-PiB uptake increase is not explained by this theory. These data are inconsistent with our findings, and our work suggests that alternate mechanisms must be at play to explain the increased uptake of WM 11C-PiB with age.
One of the findings in our study was that the annual increase in WM 11C-PiB uptake correlated with annual increases in GM 11C-PiB uptake in WM regions even when spillover is an unlikely component (periventricular WM). The trends in GM change with age were previously reported in a comparison of annual increase in GM 11C-PiB uptake with GM baseline SUVR (21) but have not been described previously for WM annual change.
Previously, 11C-PiB was also shown to bind a wide range of fibrillar Aβ pathology, including diffuse plaques and cerebrovascular amyloid angiopathy, which affects both GM and WM (39). Diffuse plaques are common in the brains of elderly individuals and can be seen in relatively large numbers in the absence of any associated evidence of cognitive impairment and could be a WM component to 11C-PiB binding in some (40–42).
We used 2-compartmental PVC correction in this study, correcting only for cerebrospinal fluid (43). It would be possible to use more sophisticated PVC methods, such as geometric transfer matrix (44), in an attempt to measure the WM signal, but geometric transfer matrix PVC assumes that individual regions each have homogeneous uptake, which is a questionable assumption for PiB in WM. Instead, in our analysis, we opted to include eroded subcortical WM ROI and other variants, which consist of voxels that were sufficiently far from the cortex so as to ensure that bleed-in of the cortical signal was not a factor in the measured signal.
The implications of the present findings are that the use of WM normalization could affect the characterization of A+ or A− subjects and the quantification of Aβ accumulation over time. The cerebellar crus1+crus2 showed no increase with age, and cerebellar GM+WM showed minimal increase, supporting their use as reference regions for cross-sectional studies comparing wide age spans. Relative to longitudinal studies, the increase in WM uptake over the short-term may be minimal, but as the longitudinal observation continues for a longer time frame, the results may be affected by changes in WM uptake. For example, the WM annual increase maximized within A+ individuals at a GM baseline SUVR range of 1.9–2.1. The highest WM increase in the entire population was seen when global GM 11C-PiB SUVRs were the lowest in A− individuals. In contrast, individuals with higher GM 11C-PiB SUVR baseline levels (∼2.7 > ) showed a trend of annual WM decrease. These data demonstrate that the annual WM change rate varies based on population selection with different amyloid status and different age ranges.
These observations may also help to reconcile findings related to seeing better stabilities in longitudinal Aβ PET studies when using WM normalization (5,8,9), where the reports describe 5 y or less of serial PET images. In a short-term longitudinal study (<5 y), the improved noise characteristics of a large WM normalization region would add stability and hence reliability, therefore may be beneficial (i.e., a small WM rate change in those with a GM SUVR range of 2.1–2.7 would add to stability). It could also be the case that small GM Aβ accumulation could be masked by WM increase, leading to the impression of improved reliability, especially when reliability is compared against cognitive change (i.e., participants with no or minimal cognitive change could still have Aβ accumulation).
For longer term longitudinal study, age-related increases in WM will ultimately result in underestimation of longitudinal GM increases in most populations (i.e., overly conservative estimation). Possible approaches suggested by these data for longitudinal data include using deep WM for short-term datasets or age correction in the WM region. More longitudinal data and additional analyses would be needed to test the utility of age correction for reference regions.
CONCLUSION
We found that WM 11C-PiB uptake has notable variability among those who are cognitively unimpaired (with and without evidence of Aβ deposition) and those diagnosed with either MCI or ADD. WM 11C-PiB uptake increases with age and is seen in both cross-sectional and serial evaluations. These findings are important relative to the quantitative and visual interpretation of 11C-PiB PET scans. The variability of WM 11C-PiB uptake may hamper accurate characterization. Increases in WM 11C-PiB uptake over time appear to occur in association with increasing global GM 11C-PiB SUVR, even in WM ROIs far from GM. Eroded subcortical WM and composite regions (cerebellum WM+GM, brain stem/pons, and eroded subcortical WM) are an important consideration to reduce but not eliminate WM 11C-PiB uptake effects. This study was specific to Aβ PET imaging using 11C-PiB, and thus future investigations should address the characteristics of other Aβ tracers.
DISCLOSURE
This work was supported by NIH grants P50 AG16574, U01 AG06786, R01 AG11378, and R01 AG041851; the Elsie and Marvin Dekelboum Family Foundation; GHR Foundation; and the Robert H. and Clarice Smith and Abigail Van Buren Alzheimer’s Disease Research Program of the Mayo Foundation. Dr. Lowe is a consultant for Bayer Schering Pharma and Piramal Imaging Inc. and receives research support from GE Healthcare, Siemens Molecular Imaging, and AVID Radiopharmaceuticals. Dr. Knopman serves on a Data Safety Monitoring Board for the DIAN study and is an investigator in clinical trials sponsored by Biogen, Lilly Pharmaceuticals, and the Alzheimer’s Disease Cooperative Study. Dr. Petersen serves on scientific advisory boards for Pfizer, Inc., Janssen Alzheimer Immunotherapy, Elan Pharmaceuticals, and GE Healthcare. No other potential conflict of interest relevant to this article was reported.
Acknowledgments
We thank David Jones, MD, and Bradley Boeve, MD, for their valuable comments and suggestions. We thank Penelope Duffy, PhD, for her editorial contributions. We thank Ping Fang, PhD, for synthesizing 11C-PiB.
Footnotes
Published online Apr. 19, 2018.
- © 2018 by the Society of Nuclear Medicine and Molecular Imaging.
REFERENCES
- Received for publication October 24, 2017.
- Accepted for publication April 4, 2018.


Jump to section
Related Articles
Cited By...
- No citing articles found.