


Abstract
Accurate amyloid PET quantification is necessary for monitoring amyloid-β accumulation and response to therapy. Currently, most of the studies are analyzed using the static SUV ratio (SUVR) approach because of its simplicity. However, this approach may be influenced by changes in cerebral blood flow (CBF) or radiotracer clearance. Full tracer kinetic models require arterial blood sampling and dynamic image acquisition. The objectives of this work were, first, to validate a noninvasive kinetic modeling approach for 18F-florbetaben PET using an acquisition protocol with the best compromise between quantification accuracy and simplicity and, second, to assess the impact of CBF changes and radiotracer clearance on SUVRs and noninvasive kinetic modeling data in 18F-florbetaben PET. Methods: Using data from 20 subjects (10 patients with probable Alzheimer dementia and 10 healthy volunteers), the nondisplaceable binding potential (BPND) obtained from the full kinetic analysis was compared with the SUVR and with noninvasive tracer kinetic methods (simplified reference tissue model and multilinear reference tissue model 2). Various approaches using shortened or interrupted acquisitions were compared with the results of the full acquisition (0–140 min). Simulations were performed to assess the effect of CBF and radiotracer clearance changes on SUVRs and noninvasive kinetic modeling outputs. Results: An acquisition protocol using time windows of 0–30 and 120–140 min with appropriate interpolation of the missing time points provided the best compromise between patient comfort and quantification accuracy. Excellent agreement was found between BPND obtained using the full protocol and BPND obtained using the dual-window protocol (for multilinear reference tissue model 2, BPND [dual-window] = 0.01 + 1.00·BPND [full], R2 = 0.97; for simplified reference tissue model, BPND [dual-window] = 0.05 + 0.92·BPND [full], R2 = 0.93). Simulations showed a limited impact of CBF and radiotracer clearance changes on multilinear reference tissue model parameters and SUVR. Conclusion: This study demonstrated accurate noninvasive kinetic modeling of 18F-florbetaben PET data using a dual-window acquisition, thus providing a good compromise between quantification accuracy, scan duration, and patient burden. The influence of CBF and radiotracer clearance changes on amyloid-β load estimates was small. For most clinical research applications, the SUVR approach is appropriate. However, for longitudinal studies in which maximum quantification accuracy is desired, this noninvasive dual-window acquisition with kinetic analysis is recommended.
Visual assessment is the approved and established method to classify 18F-florbetaben PET scans as negative or positive for the presence of amyloid-β in clinical practice (1). However, accurate quantitation is essential for monitoring amyloid-β accumulation in longitudinal studies and response to therapy in interventional trials of amyloid-β–modifying treatments for Alzheimer disease (AD).
The amount of brain amyloid-β load is widely assessed in PET imaging by means of the SUV ratio (SUVR) because of its simplicity. Measurement of the SUVR requires only a single scan at pseudoequilibrium and normalization of activity in the target region to that in a reference region to account for nondisplaceable radiotracer binding (2). Previous work has demonstrated that 18F-florbetaben SUVR correlates strongly with the presence of amyloid-β as confirmed by histopathology (3) and with the outcomes from tracer kinetic modeling using arterial blood sampling (4). Additionally, 18F-florbetaben SUVR has been shown to be sensitive in detecting subtle amyloid-β accumulation over time in a sample of subjects with mild cognitive impairment (5,6).
In many clinical research settings, an SUVR-based approach was found to be suitable to estimate amyloid deposition. SUVR, however, may be biased as a surrogate marker of amyloid-β load by changes in cerebral blood flow (CBF) or radiotracer clearance (7). A CBF influence on SUVR has been reported for 11C-Pittsburgh compound B and 18F-florbetapir (8,9). However, little is known about the impact of changes in CBF and radiotracer clearance on 18F-florbetaben PET scans. These effects may be relevant in interventional trials in which an amyloid-β–modifying drug is administered and drug effects on CBF and radiotracer clearance are unknown.
Full tracer kinetic modeling using arterial blood sampling relies on fewer assumptions than SUVR and is not affected by the bias caused by changes in CBF and radiotracer clearance. Full tracer kinetics, however, are complex and invasive (i.e., arterial blood sampling and metabolite analysis are needed), and dynamic PET acquisitions are required to measure the time course of the tracer in the brain. Reference tissue tracer kinetic models avoid arterial blood sampling and are therefore a noninvasive alternative to full tracer kinetics (10,11). 18F-florbetaben distribution volume ratios measured using a multilinear reference tissue model (MRTM) correlate well with those obtained from full tracer kinetic modeling (4). Reference tissue tracer kinetic models, however, still require dynamic scans and may not be applicable in clinical trials.
Recent work has shown that 18F-florbetaben PET in the early phase (0–10 min) after injection correlates visually and quantitatively with 18F-FDG PET scans, irrespective of the amyloid plaque density assessed in late-phase 18F-florbetaben imaging (12,13). Thus, early-phase 18F-florbetaben uptake provides information similar to that from conventional metabolism studies, suggesting potential use as a biomarker of neuronal injury in place of an additional 18F-FDG PET investigation (12,13). In this context, a dual–time-window acquisition protocol in which 2 short dynamic acquisitions are performed at early and late phases has been proposed as a possible alternative to long dynamic acquisitions (14). Such an approach may be more patient-friendly and may allow the clinical site to use the tomograph time-slot for other patients. Additionally, in a single session, information can be obtained on amyloid-β load using the late frames and on synaptic dysfunction using the early frames. However, to our knowledge, no one has studied the application of noninvasive kinetic models to dual-window 18F-florbetaben time–activity curves to correct for changes in CBF and radiotracer clearance. In dual-window protocols, the central portion of the time–activity curve is not acquired, and it is unknown what the impact of this missing information may be on kinetic model accuracy and capacity to correct for changes in CBF and radiotracer clearance.
Thus, the objectives of this work were, first, to validate a noninvasive kinetic modeling approach using an acquisition protocol with the best compromise between quantification accuracy and simplicity and, second, to use simulations to assess the impact of changes in CBF and radiotracer clearance on SUVR and noninvasive kinetic models in 18F-florbetaben PET.
MATERIALS AND METHODS
Subjects
The population consisted of 10 patients with mild to moderate probable AD dementia based on clinical diagnosis (mean age ± SD, 69 ± 7 y) and 10 age-matched healthy controls (67 ± 8 y), previously described in detail (4). The local Institutional Review Board, the National Radiation Safety Committee, and the German Federal Institute for Drugs and Medical Devices approved the protocol, and written informed consent was obtained from all subjects.
Image Acquisition, Reconstruction, and Analysis
Details on the PET image acquisition, reconstruction, and analysis were described elsewhere (4). In short, 4 dynamic scans (29 frames) were acquired over the 260 min after injection of 300 ± 60 MBq of 18F-florbetaben (scan 1, lasting 90 min [four 0.25-min frames, four 1-min frames, five 2-min frames, five 5-min frames, and five 10-min frames] and scans 2, 3, and 4, starting at 2, 3, and 4 h, respectively [two 10-min frames per scan]). For this study, only the data acquired at 0–90 min and 120–140 min were analyzed. Volumes of interest were defined on individual coregistered structural MR images in 7 brain regions (cerebellar gray matter, frontal cortex, occipital cortex, parietal cortex, lateral temporal cortex, posterior cingulate cortex, and anterior cingulate cortex).
Full Tracer Kinetic Modeling
Arterial samples were collected from each subject over the 240 min after tracer injection and corrected for metabolites (4). Time–activity curves acquired at 0–90 min and 120–140 min after injection were analyzed using a 2-tissue-compartment model with arterial plasma input fitted to the cerebral cortical areas and the reference region as previously described (4).
Reference Tissue Models
Two noninvasive reference tissue models were fitted to the time–activity curves: a simplified reference tissue model (SRTM) and MRTM2 (10,11). Cerebellar gray matter was used as the reference region (15). MRTM2 used a t* of 70 min and an average k2′ from all regions of each subject derived from MRTM.
Multiple–Time-Window Analyses
Different acquisition protocols were simulated by fitting the noninvasive tracer kinetic models to 18F-florbetaben time–activity curves from which some time points were removed. Three types of protocols were tested: a shortened acquisition (0–90 min and 0–60 min), a triple–time-window acquisition (0–30/60–90/120–140 min), and a dual–time-window acquisition (0–30/120–140 min and 0–20/120–140 min). When a dual-window acquisition was used, the missing points of the time–activity curve between the early and late windows were interpolated using 2 methods: linear interpolation and interpolation based on the average time–activity curve. In the second method, the average time–activity curve was scaled to fit the acquired points of the time–activity curve as follows:
where TACinterp(t) is the interpolated time–activity curve, TACaver(t) is the average time–activity curve based on data of all subjects except the subject being interpolated, and f(t) is the escalation function. Two escalation functions were tested in each subject:


where a, b, and c were determined by minimizing the least-squares between the interpolated and acquired time–activity curves. The escalation function that provided the lower least-squares was chosen (Fig. 1).
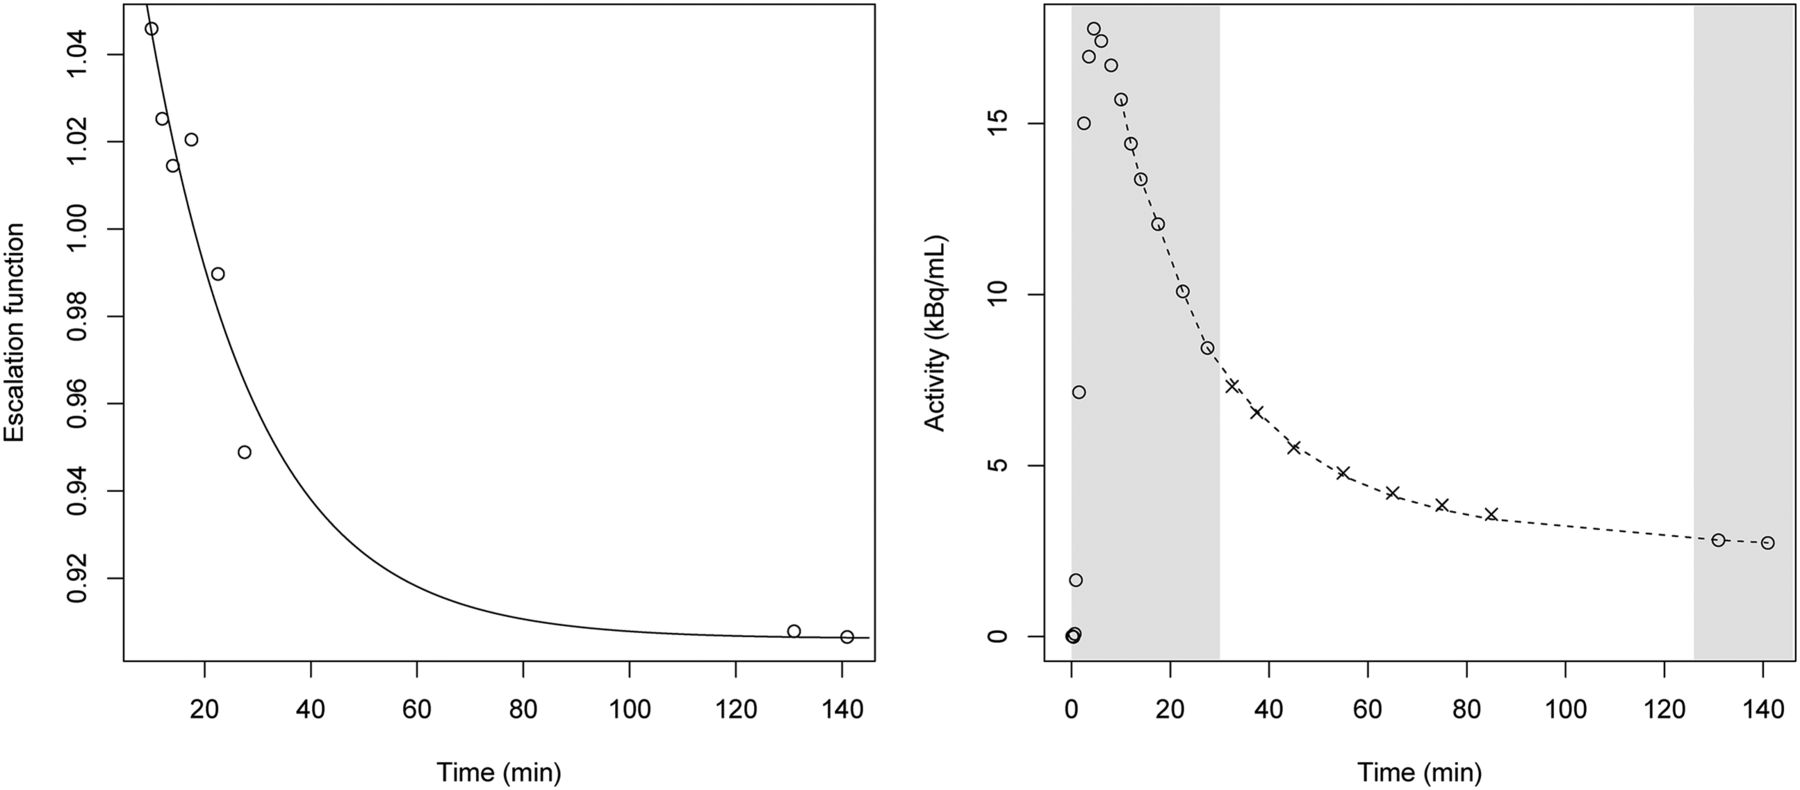
Example of dual-window acquisition interpolation using average time–activity curve. Left plot shows ratio between acquired time–activity curve being interpolated to average time–activity curve (circles) and fitted escalation function (f(t) =⋅e-b⋅t + c; = 0.23, b = 0.05, c = 0.91) (continuous line). Right plot shows interpolated time–activity curve. Circles and gray area show acquired time–activity points, and crosses are points omitted from interpolation because they would not be acquired in dual-window acquisition. Dashed line shows interpolated time–activity curve obtained by multiplying average time–activity curve and escalation function determined previously.
SUVR
Mean radioactivity concentration was obtained from each volume of interest. SUVR was calculated as the ratio of the activity in the cerebral cortical regions to the activity in the cerebellar gray matter. SUVR was determined at 70–90 and 120–140 min. A composite SUVR was calculated per subject by averaging the SUVRs of 6 cortical regions (frontal, occipital, parietal, lateral temporal, posterior cingulate, and anterior cingulate cortices) (16).
Simulations
Average arterial input function and time–activity curves from the 8 AD patients whose PET scans had positive 18F-florbetaben results on visual evaluation were used to derive rate constants (K1, k2, k3, and k4) for the simulation study. Parameters for a typical AD patient in the reference region were as follows: blood volume (proportion of tissue volume occupied by intravascular blood) = 0.04, K1′ = 0.25 mL⋅cm−3⋅min−1, k2′ = 0.09 min−1, k3′ = 0.02 min−1, k4′ = 0.01 min−1, and distribution volume = 6.57 mL⋅cm−3. Parameters for a typical AD patient in the cortical region (composite) were as follows: blood volume = 0.04, K1 = 0.20 mL⋅cm−3⋅min−1, k2 = 0.08 min−1, k3 = 0.04 min−1, k4 = 0.01 min−1, and distribution volume = 11.17 mL⋅cm−3. The nondisplaceable binding potential (BPND) in all simulations was 0.70. The parameters specified above were used to generate simulated time–activity curves by means of a 2-tissue-compartment model from 0 to 140 min after injection.
Three simulations were conducted. The first was a regional CBF change affecting only cortical regions: average K1 from the AD patients (K1 = 0.2) was varied between 0.15 and 0.25 (±25%) while keeping K1/k2 constant, and the ratio of the delivery in the tissue region of interest compared with that in the reference region (R1 = K1/K1′) was varied between 0.6 and 1.0. The second simulation was a global CBF change affecting cortical and reference regions: average K1 was varied between 0.15 and 0.25 while keeping R1 = K1/K1′ constant. The third simulation was a radiotracer clearance change: a biexponential function was fitted to the arterial input function 10 min after injection ( , where A1 = 2.03 kBq/mL, T1 = 5.73 min, A2 = 0.42 kBq/mL, and T2 = 78.50 min). A radiotracer clearance change was simulated by varying the washout rate (T2) between 50 and 110 min. Simulations were performed with and without adding noise to the time–activity curve. One hundred noisy simulations were generated using the noise model described by Gunn et al. (10). Average results from noisy simulations showed almost identical results to those obtained without noise. Therefore, only the results of simulations without noise are reported.
Amyloid-β load was quantified using SRTM (10) and MRTM2 (t* = 70 min) (11). Three different acquisition protocols were compared: a full acquisition (0–140 min) and 2 dual-window acquisitions (0–30/120–140 min and 0–30/90–110 min). SUVR was determined at 70–90, 90–110, and 120–140 min. The maximum bias associated in the amyloid-β load estimates (BPND) for the simulations with CBF and radiotracer clearance changes was quantified as the maximum percentage change with respect to the amyloid-β load estimates from the average time–activity curves (BPND,average) (bias [%] = max[100(BPND − BPND,average)/BPND,average]).
Statistical Analysis
Linear regression fitting and the determination coefficient (R2) were used to compare BPND obtained from noninvasive tracer kinetic analysis and SUVR with BPND obtained from full tracer kinetic modeling using a 2-tissue-compartment model. The linear regression model was also used to compare BPND obtained from the full acquisition (0–140 min) with BPND obtained from the shortened or multiple-window acquisition. Statistical analysis was performed using R, version 3.3.2 (http://www.r-project.org/).
RESULTS
Subject Imaging Data
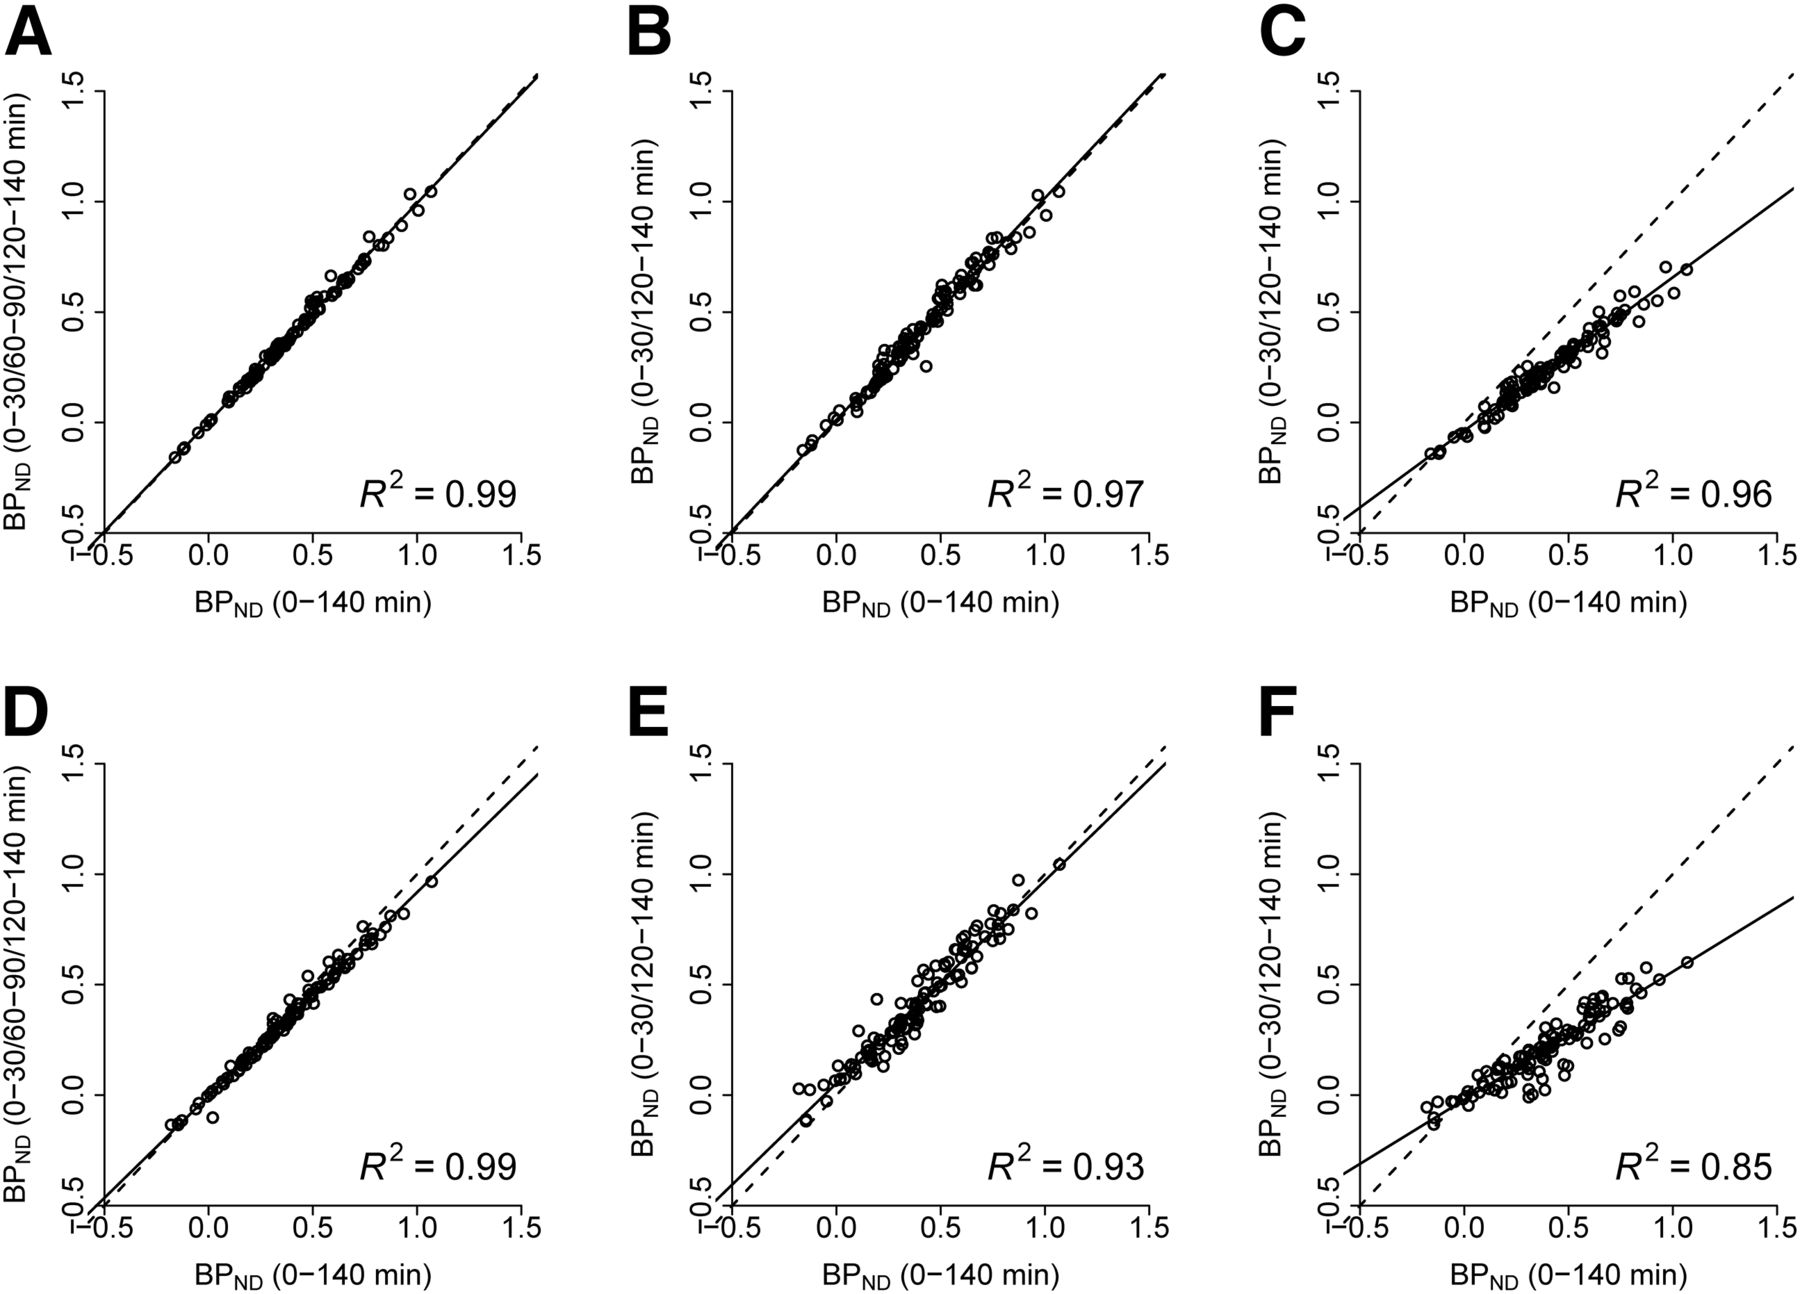
The triple-window acquisition (0–30/60–90/120–140 min) provided an excellent correlation with the full acquisition (0–140 min) (R2 = 0.99 for MRTM2 and 0.99 for SRTM) (Table 1; Figs. 2A and 2D). The dual-window acquisition (0–30/120–140 min) was analyzed using linear interpolation and interpolation based on the average time–activity curves. Using averaged time–activity curves for interpolation provided an excellent correlation with the full acquisition (0–140 min), with a slightly lower correlation coefficient than for the triple-window acquisition (R2 = 0.97 for MRTM2 and 0.93 for SRTM) (Table 1; Figs. 2B and 2E). Individual time–activity curves for AD patients and healthy controls can be found in Supplemental Figures 1 and 2, respectively (supplemental materials are available at http://jnm.snmjournals.org). However, the BPND estimated from the dual-window acquisition analyzed using linear interpolation was biased, with larger variability than for the full acquisition (R2 = 0.96 for MRTM2 and 0.85 for SRTM) (Table 1; Figs. 2C and 2F). Reduction of the early-window 18F-florbetaben scan in the dual-window acquisition to 0–20 min using the average time–activity curve interpolation provided comparable results for MRTM2 but slightly increased variability for SRTM (R2 = 0.98 for MRTM2 and 0.87 for SRTM) (Table 1). Variability further increased for both models when using reduced early-window data (0–20 min) and applying a linear interpolation to the dual-window acquisition (R2 = 0.86 for MRTM2 and 0.56 for SRTM) (Table 1).
Linear Regression Fitting and Correlation Between BPND Obtained Using Multiple-Window Acquisition and BPND Obtained Using Full Acquisition

Comparison between BPND obtained using full acquisition (0–140 min) and BPND obtained using triple-window acquisition with MRTM2 (A), dual-window acquisition with MRTM2 and interpolation based on average time–activity curve (B), dual-window acquisition with MRTM2 and linear interpolation (C), triple-window acquisition with SRTM (D), dual-window acquisition with SRTM and interpolation based on average time–activity curve (E), and dual-window acquisition with SRTM and linear interpolation (F).
The BPND obtained from the acquisition shortened to 0–90 min provided results similar to the full acquisition (0–140 min) (R2 = 0.90 for MRTM2 and 0.81 for SRTM) (Table 2). Further reduction of the acquisition time to 0–60 min, however, progressively increased the variability with respect to the full acquisition, and some outlier values appeared (R2 = 0.74 for MRTM2 and 0.57 for SRTM) (Table 2).
Linear Regression Fitting and Correlation Between BPND Obtained Using Shortened Acquisition and BPND Obtained Using Full Acquisition (BPND,0–140 min)
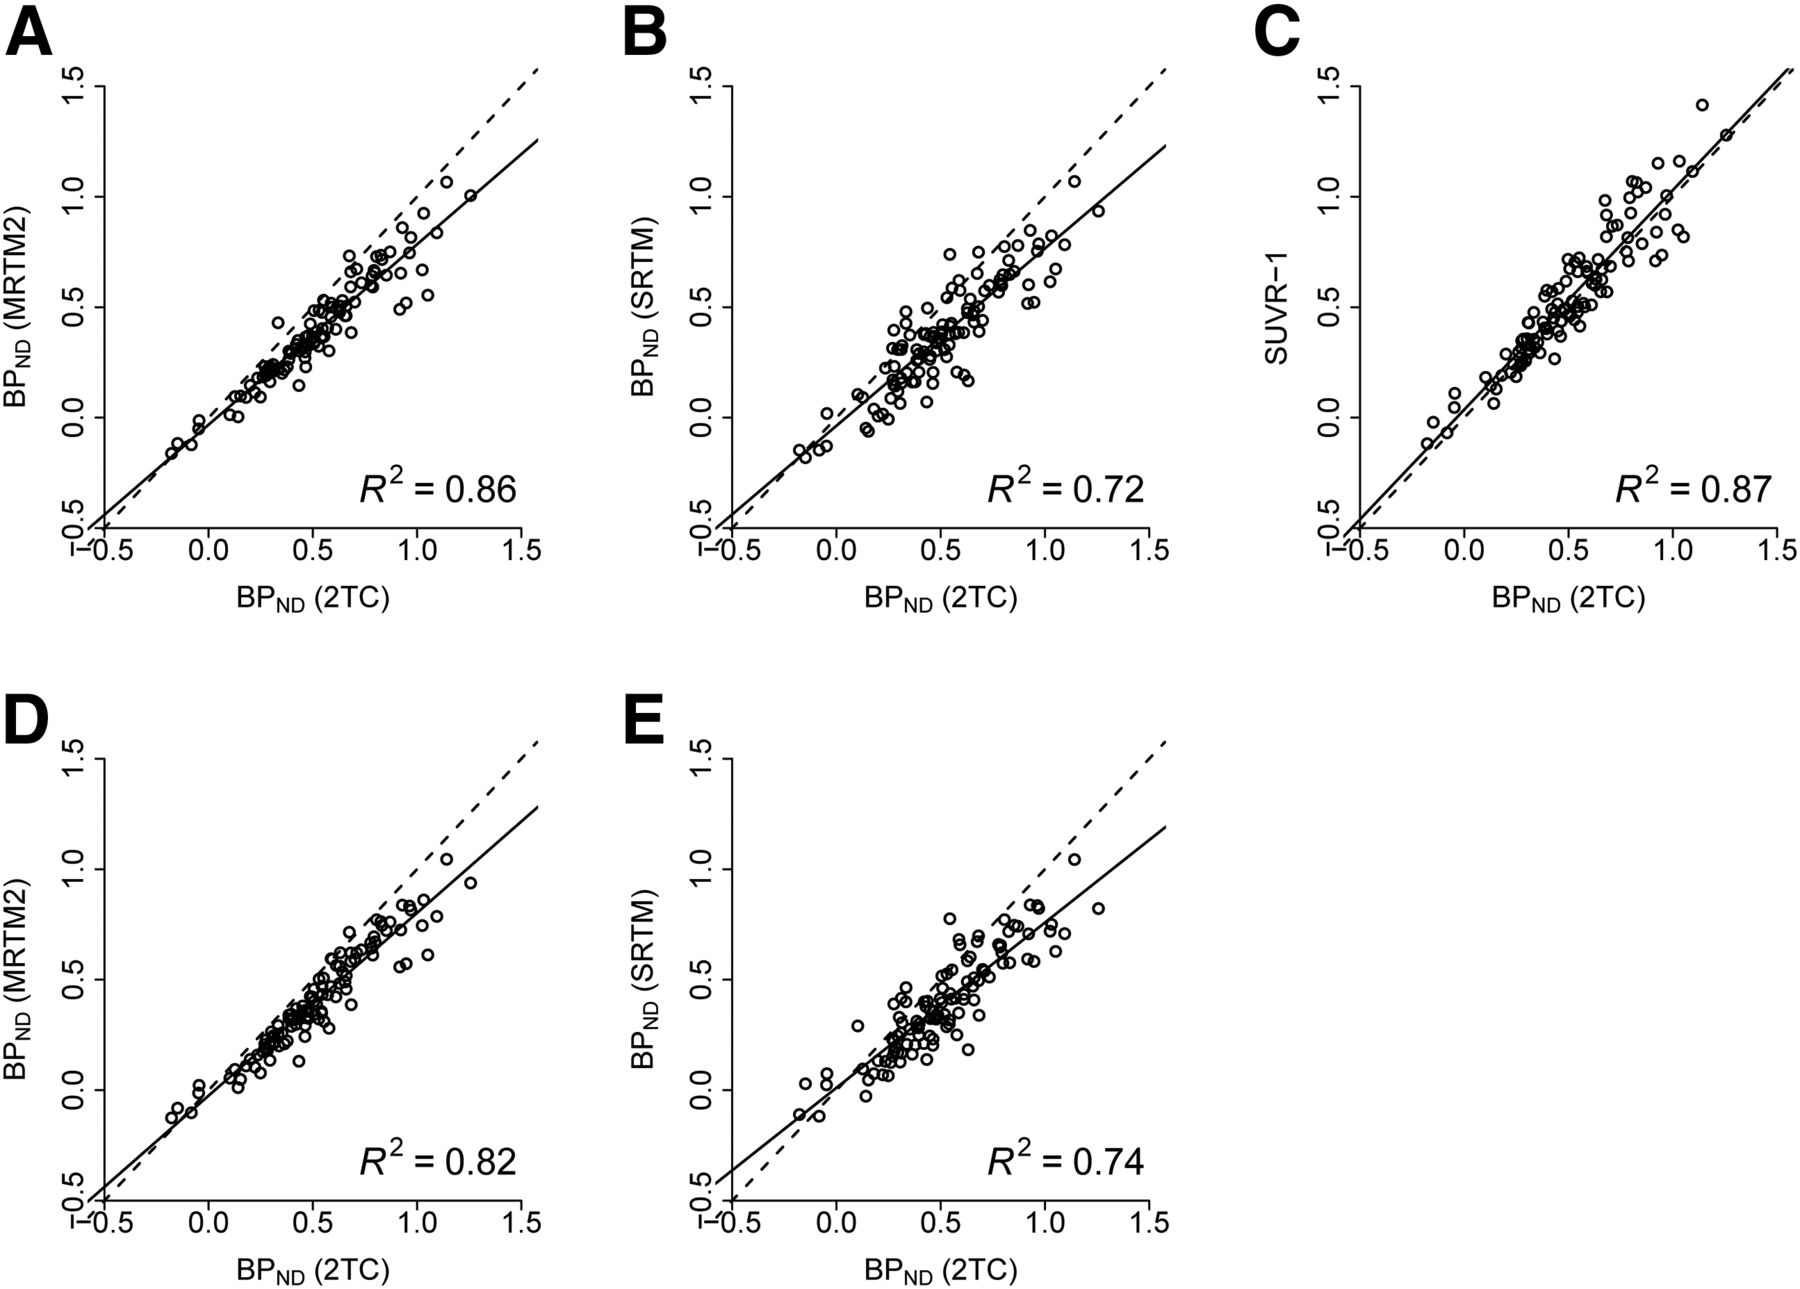
The SUVR − 1 (R2 = 0.87), as well as the data of noninvasive kinetic models either for a full acquisition (R2 = 0.86 for MRTM2 and 0.72 for SRTM) or for a dual-window acquisition (R2 = 0.82 for MRTM2 and 0.74 for SRTM), correlated well with the full tracer kinetic analysis with arterial blood sampling as the gold standard (Table 3; Fig. 3). The average BPND obtained from healthy controls and AD patients using full tracer kinetic analysis with arterial blood sampling (control and AD: 0.37 ± 0.10 and 0.78 ± 0.18, respectively) was slightly larger than that using either a full acquisition (control and AD, respectively, 0.27 ± 0.10 and 0.61 ± 0.10 for MRTM2 and 0.25 ± 0.15 and 0.58 ± 0.08 for SRTM) or a dual-window acquisition (0.28 ± 0.12 and 0.63 ± 0.09 for MRTM2 and 0.28 ± 0.14 and 0.59 ± 0.09 for SRTM).
Linear Regression Fitting and Correlation Between BPND Obtained Using Full Tracer Kinetics (BPND,2TC) and BPND Obtained Using Noninvasive Models or SUVR − 1

Comparison between BPND obtained using 2-tissue-compartment model (2TC) (0–140 min) and BPND obtained using MRTM2 and full acquisition (0–140 min) (A), SRTM and full acquisition (0–140 min) (B), SUVR − 1 at 120–140 min (C), MRTM2 and dual-window acquisition (0–30/120–140 min) (D), and SRTM and dual-window acquisition (0–30/120–140 min) (E).
Simulation Results
When simulating regional CBF changes, MRTM provided accurate amyloid-β load estimates independent of CBF (bias of 1.4% for MRTM2). SUVR − 1 also provided estimates of the amyloid-β load with a limited CBF effect, which was reduced at late time points (bias of 5% at 70–90 min, 2.9% at 90–110 min, and 0.1% at 120–140 min). BPND estimates obtained from SRTM showed a CBF-dependent bias (14.1%) (Fig. 4). For global CBF change affecting both reference and target regions, none of the noninvasive methods substantially biased the amyloid-β load estimates (bias of 1.6% for MRTM2, 1.4% for SRTM, 1.3% for SUVR − 1 at 70–90 min, 1.5% for SUVR − 1 at 90–110 min, and 1.8% for SUVR − 1 at 120–140 min) (Fig. 4). For the radiotracer clearance change simulations, both MRTM2 and SRTM showed stable BPND estimates across different washout rates (bias of 0.3% for MRTM2 and 0.2% for SRTM). SUVR estimates showed a larger bias, especially at late time points and fast washout rates (SUVR − 1: 3.8% at 70–90 min, 4.4% at 90–110 min, and 7.3% at 120–140 min) (Fig. 4). SUVR estimates showed larger variability at late time points for global CBF and radiotracer clearance changes and larger variability at early time points for regional CBF changes (Fig. 5).

BPND and SUVR − 1 estimates obtained with simulation of regional CBF change (A), global CBF change (B), and radiotracer clearance change (C). Dashed line corresponds to simulated BPND.

SUVR obtained over time with simulation of regional CBF change (A), global CBF change (B), and radiotracer clearance change (C). Dashed line corresponds to simulated BPND + 1.
Excellent agreement in the BPND estimated by MRTM2 was found between the dual-window and full acquisitions, showing average percentage differences that were lower than 1% (regional, global, and clearance changes of −0.13% ± 4.02%, 0.28% ± 0.04%, and 0.28% ± 0.97%, respectively, at 0–30/120–140 min and 0.65% ± 6.86%, −0.45% ± 0.06%, and −0.20% ± 1.22%, respectively, at 0–30/90–120 min).
DISCUSSION
Amyloid-β load is widely assessed in PET imaging using SUVR at pseudoequilibrium and has been shown sufficient for many research applications. The current analyses demonstrate the feasibility of using dual–time-window dynamic acquisitions to perform noninvasive tracer kinetic modeling. The results were comparable to those obtained using a full dynamic acquisition. This study also demonstrated that MRTM2 using a dual-window protocol can provide BPND estimates that are nonbiased by changes in CBF and radiotracer clearance. This simple protocol allows accurate estimation of BPND using noninvasive tracer kinetics while reducing patient burden.
Although a triple-window acquisition (0–30/60–90/120–140 min) provided the most accurate determination of BPND in comparison with the full acquisition, such a protocol may increase the dose to the patient because 3 low-dose brain CT scans or attenuation scans are required. Additionally, a longer period on the tomograph is required, making it more difficult to use the camera for other patients during breaks within the scan period. For this reason, a dual-window (0–30/120–140 min) acquisition with an overall scanning time of 50 min provided a good compromise between patient comfort and quantification accuracy, compared with a 140-min acquisition. Both acquisition protocols showed an excellent correlation with full tracer kinetic modeling and allowed correction for changes in CBF and radiotracer clearance when MRTM2 was used. A potential limitation of this work was that the widely used scanning time of 90–110 min was not available and therefore a protocol of 0–30/90–110 min could not be tested. However, the simulations suggested that 0–30/90–110 min or 0–20/90–110 min may provide results comparable to or better than 0–30/120–140 min because of the smaller gap between the early and late windows.
In comparison to SUVR and SRTM, MRTM2 is the noninvasive kinetic model that provided more stable estimates of amyloid-β load independent of changes in CBF and radiotracer clearance. A disadvantage, however, is that variability in the respective parameters slightly increased when the dual-window acquisition was used. This small increase could be partially corrected by fixing a k2′ per subject in the MRTM2. Noticeably, late–time-point SUVR also provided accurate results, with a limited impact of CBF and excellent correlation with full tracer kinetics. In practice, MRTM2 was similar to the SUVR approach when the simulated changes were similar to those reported in the literature. Rate constants (K1, K1′) for the simulations were varied by 25% around the average to cover a broader range than previously published results. R1 values in patients with AD scanned with 11C-Pittsburgh compound B have been found to vary by up to 5% between baseline (R1 = 0.87 ± 0.05) and follow-up at 30 ± 5 mo (R1 = 0.83 ± 0.06) (8), whereas K1 values decreased in AD patients by up to 20% compared with healthy controls and by up to 11% compared with amnesic mild-cognitive-impairment subjects scanned using 18F-florbetapir (9). A dual-window acquisition has some drawbacks to consider. It takes longer than a single window used for SUVR determination and can be challenging for some patients. Furthermore, in comparison to a single-window acquisition, the subject’s dosimetry is increased (i.e., 2 CT scans or attenuation scans are required) and image processing is more demanding (i.e., coregistration between early and late time frames, time–activity curve determination, and modeling). All these considerations should be taken into account when trying to conduct a dual-window protocol, and it should be limited to those studies in which maximum quantification accuracy is desired (e.g., longitudinal studies or therapy-monitoring studies in which treatment can affect CBF).
Noticeably, BPND estimates obtained using the SRTM were found to be dependent on regional CBF change affecting only cortical regions. This bias is probably caused by the violations of model assumptions. SRTM is based on 4 key assumptions: that the reference region is devoid of specific/displaceable binding, that the blood volume contribution to both the reference and the target tissues is negligible, that reference and target tissue have the same nondisplaceable volume of distribution, and that the kinetic behavior of the tracer in both the reference and the target tissue can be represented by a 1-tissue-compartment model (17). The first 3 requirements are fulfilled by cerebellar gray matter in the intended clinical population (15) but can be violated in patients with advanced-stage AD (18) and in some types of familial AD (19) in which amyloid-β may be present in the cerebellar gray matter. However, requirement 4 is violated for 18F-florbetaben since all brain regions, including the reference region, require a 2-tissue-compartment model to describe the time–activity curves adequately and poor fitting is obtained with a 1-tissue-compartment model (4). This finding is consistent with previous results showing that SRTM is associated with a bias in the determination of BPND in 11C-WAY-100635 PET (20). Thus, appropriate selection of the noninvasive tracer kinetic model is crucial to obtain amyloid-β load estimates independent of the CBF changes.
CONCLUSION
This study demonstrated accurate noninvasive kinetic modeling of 18F-florbetaben PET data using a dual-window acquisition, thus providing a good compromise between quantification accuracy, scan duration, and patient burden. The influence of changes in CBF and radiotracer clearance on estimates of amyloid-β load was small. Thus, for most clinical research applications, the SUVR approach is sufficient. However, for longitudinal studies in which maximum quantification accuracy is desired, this dual-window acquisition with kinetic analysis is recommended.
DISCLOSURE
The trial was funded by Bayer Pharma AG, Berlin (Germany), and Piramal Imaging GmbH, Berlin (Germany). Santiago Bullich, Norman Koglin, Aleksandar Jovalekic, and Andrew W. Stephens are Piramal Imaging GmbH employees. Susan De Santi is an employee of Piramal Pharma Inc. Henryk Barthel and Osama Sabri received research support, consultant honoraria, and travel expenses from Piramal Imaging GmbH. No other potential conflict of interest relevant to this article was reported.
Acknowledgments
We thank all patients, their caregivers, and the healthy volunteers who participated in this trial. We are also grateful to the cyclotron, radiochemistry, and PET imaging staff of the Department of Nuclear Medicine, University of Leipzig (Germany), for their excellent technical assistance in data acquisition.
Footnotes
Published online Nov. 24, 2017.
- © 2018 by the Society of Nuclear Medicine and Molecular Imaging.
REFERENCES
- Received for publication August 25, 2017.
- Accepted for publication November 10, 2017.


Jump to section
Related Articles
Cited By...
- Early-Frame [18F]Florbetaben PET/MRI for Cerebral Blood Flow Quantification in Patients with Cognitive Impairment: Comparison to an [15O]Water Gold Standard
- The RSNA QIBA Profile for Amyloid PET as an Imaging Biomarker for Cerebral Amyloid Quantification
- Determining Amyloid-{beta} Positivity Using 18F-AZD4694 PET Imaging
- Exploiting the Full Potential of {beta}-Amyloid and Tau PET Imaging for Drug Efficacy Testing