


Abstract
Because of its computational simplicity, the graphic method introduced by Logan et al. is frequently used to analyze time–activity curves of reversible radiotracers measured in brain regions with PET. The graphic method uses a nonlinear transformation of data to variables that have an asymptotically linear relationship. Compared with compartmental analysis of untransformed data, the graphic method enables derivation of regional distribution volumes that are free from assumptions about the underlying compartmental configuration. In this article, we describe statistical bias associated with this nonlinear transformation method. Methods: Theoretic analysis, Monte Carlo simulation, and statistical analysis of PET data were used to test the graphic method for bias. Results: Mean zero noise is associated with underestimation of distribution volumes when data are analyzed with graphic analysis, whereas this effect does not occur when the same data are analyzed by nonlinear regression and compartmental analysis. Moreover, this effect depends on the magnitude of the distribution volume, so that the bias is more pronounced in regions with high receptor density than regions with low receptor density or no receptors (region of reference). Conclusion: These results indicate that conventional kinetic analysis of untransformed data is less sensitive to mean zero noise than is graphic analysis of nonlinearly transformed data.
Graphic analysis of PET data acquired with reversible (1) or irreversible (2) radiotracers is commonly used for quantification. The method of Logan et al. (1) for analysis of reversible radiotracers comprises a nonlinear change of variables applied to region-of-interest (ROI) activities and to the arterial plasma input function (Ca), in which the transformed variables have an asymptotically linear relationship. The linear part of the graph can be written in the form of an equation for a line:
 The slope m is equal to the tracer total volume of distribution (VT). VT is equal to (K1/k2) + VP in the 1-tissue-compartment model and (K1/k2) × [1 + (k3/k4)] + VP in the 2-tissue-compartment model, where VP is the vascular contribution and the k values are (nonnegative) time parameters associated with the models. The intercept b is given by the expressions:
 in the 1- and 2-tissue-compartment models, respectively. The slope is the desired outcome measure, but note that the intercepts are negative in both cases; this fact will be pertinent to the subsequent discussion.
The graphic method has several attractive aspects. It is less computer intensive than classic compartmental analysis and not subject to the convergence problems that may arise with iterative methods. Furthermore, it allows derivation of VT without making assumptions about the compartmental configuration of the underlying data. For these reasons, the graphic method is widely used for analysis of neuroreceptor imaging studies performed with reversible radiotracers.
PET data always include a significant noise component, whose multiple sources have been discussed (3). In this article, we consider the effect of only noise with a zero mean value, that is, noise that increases and decreases measured PET values to the same extent. We show that this type of noise causes this graphic technique to systematically underestimate the outcome measure VT and that the amount of underestimation increases as the SD of the noise increases. We also show that the effect depends on VT itself, so that the effect is more pronounced in regions with high VT than regions with low VT. The implication is that if the distribution volume ratio (ratio of regional VT to the VT of a reference region) is used as an outcome measure, the distribution volume ratio will be underestimated as well.
The phenomenon of statistical bias caused by mean zero noise introduced by a change of variables may not be intuitively expected. Given that individual points are randomly increased or decreased by the same amount, why does the slope (i.e., VT) systematically decrease? In the case of the method of Logan et al. (1), the bias has been documented by Monte Carlo simulation in a study comparing the noise-related bias levels in several methods of PET analysis (4). Here, we replicate the Monte Carlo analysis as applied to 2 new and promising radiotracers, offer a theoretic explanation for the simulation results, describe the relationship between the bias in estimated VT and true VT, and show the presence of the effect in real PET datasets. In the graphic method, noise in the ROI curve appears in both the x and the y transformed variables, and the x noise and y noise are highly correlated. Draper and Smith (5) discuss the case in which the x and y variables have statistically independent noise. Here, we present reasoning that predicts the bias on the basis of the correlation structure.
MATERIALS AND METHODS
Theoretic Analysis
Analysis of a Simple Case.
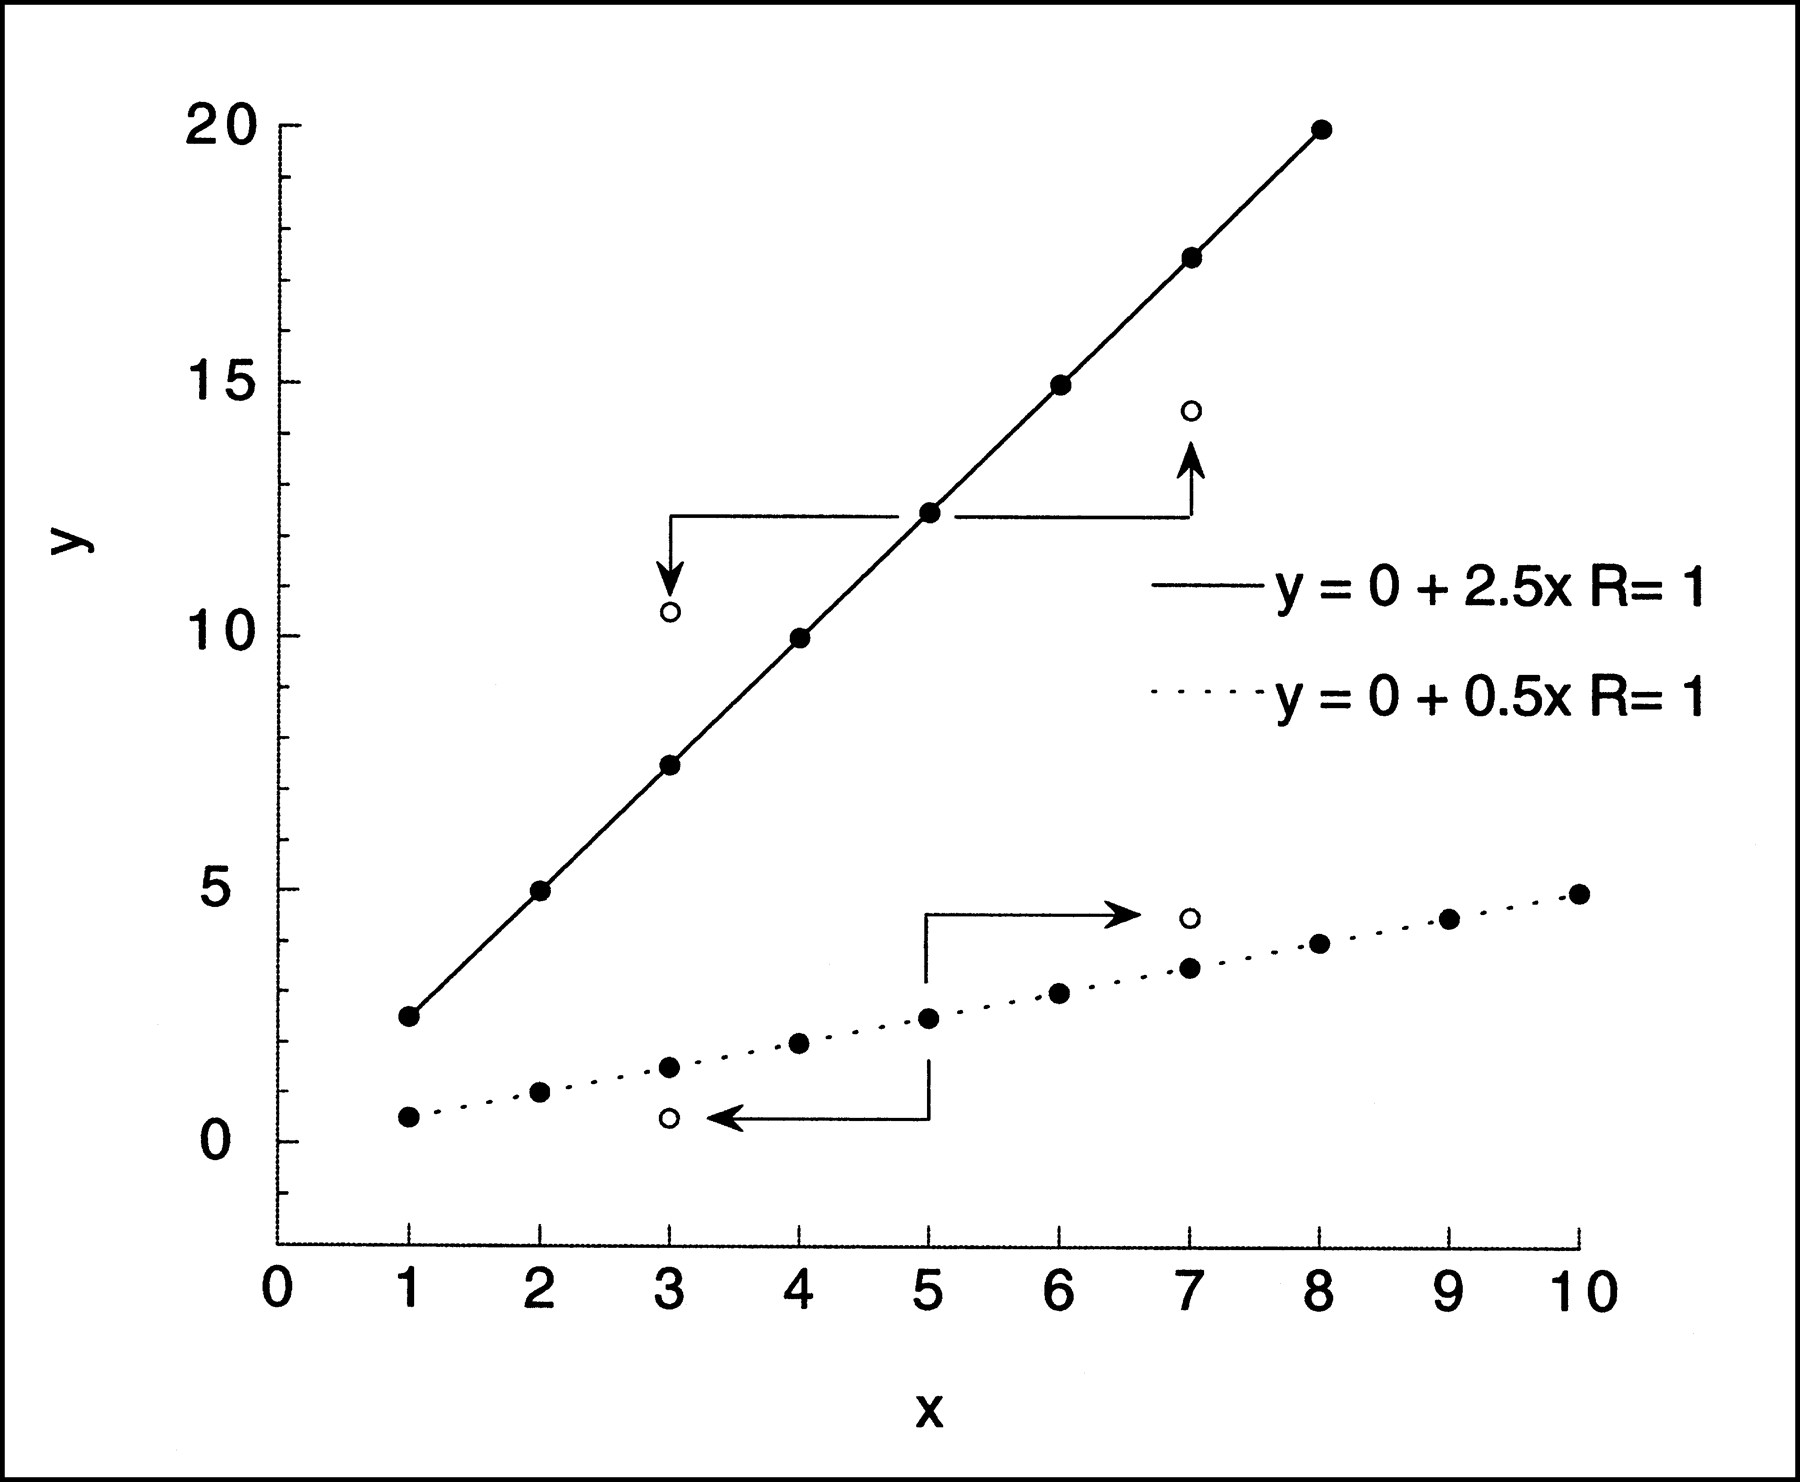
As a simple example of data with correlation between the x and the y noise, consider the line y = mx, m > 1, and perturb both x and y by the same small amount ε (Fig. 1). That is, (x,y) becomes (x + ε,y + ε). Consider the line segment from (x,y) to (x + ε,y + ε). The rise over the run of this segment will always be ε/ε = 1, and the perturbed point will be moved either down and to the left but above the original line or up and to the right but below the original line, according to the sign of ε. Now map each data point yj = mxj, j = 1,. . .N, to (xj + εj,yj + εj), where the ej values are independent identically distributed random variables with mean zero and variance σ2. Geometric intuition suggests that if the ordinary linear least squares regression slope is then computed, it will be less than m. This can be made mathematically rigorous by computing the expectation of the difference m − M. The proof can be made to cover a much broader class of models without much extra effort. Now assume the true data are still y = mx but that the data points (x,y) are perturbed to (xj + εxj,yj + εyj), where the εxj values are independently distributed with mean zero and variance σ2xj (not necessarily the same for all j) and the εyj values are independently distributed with mean zero and variance σ2yj. Further, assume that for each j, εxj and εyj have covariance σxyj but that εxj and εyk are not correlated for j ≠ k. Then setting D = NΣ(xj + εxj)2 − (Σxj + εxj)2, m − M is equal to:
 Eq. 1
Eq. 1

Simple linear regression. Effect on noise perturbation, ±ε, added to both x and y values of given point of simple regression y = mx with m greater than 1 (=2.5) and m less than 1 (=0.5). New location of point (x ± ε,y ± ε) relative to original line depends on value of m. If m is greater than 1 and value of ε is positive, perturbed point will fall to right and above its original position but below original line. Negative ε will result in point below and to left of original position but above line. If m is less than 1, positive ε will move point to right and above original line, whereas negative ε will move point to left and below original line. Geometric intuition suggests that linear least squares fit of perturbed data will have slope less than m if m is greater than 1 and greater than m if m is less than 1.
The denominator D is the determinant of a positive definite matrix and therefore always positive, so the sign of m − M will be equal to the sign of the numerator. The expectation of the numerator reduces to:
 Eq. 2
Eq. 2
This expression will be positive when m > (Σσxyj)/(Σσxj2). In the simple case above, εxj = εyj and (Σσxyj)/(Σσxj2) = 1, which, by design, is less than m.
Graphic Method.
Analysis of the graphic method is not as simple as in the previous case, partly because multiple noise sources exist, including counting statistics both in the brain image and in Ca, measurement errors, and motion artifacts. Also, the noise has a more complicated effect on the data than in the model of the previous section, because of the transformation of variables. Typically, a fitting procedure such as a sum of exponentials is used to presmooth the plasma data, so that the effect of noise in the plasma data is minimized. Even if the plasma data have not been preprocessed, Ca, and therefore noise in Ca, appears only in an integral. Integration is a smoothing process that tends to reduce the effects of mean zero noise. Finally, noise in Ca can reasonably be assumed to be statistically independent of noise in the PET data, so that effects from plasma noise and ROI noise can be treated separately. Here, we ignore error in Ca, focusing instead on noise in the ROI curve. This noise will be assumed to have mean zero and variance σ2j at time tj. Because the mean is zero, this noise will tend to be cancelled in  ROI(τ)dτ, provided σ2j changes slowly over time. Let:
 Eq. 3
Eq. 3 Then the graphic transformation can be written in vector form as:
 Eq. 4
Eq. 4
 Eq. 5
Eq. 5
If we assume the magnitude of the noise is relatively small, the perturbed transformation can be approximated by a first-order Taylor expansion as:
 Eq. 6
Eq. 6

Let this final expression be our new model process. For small σ2j, this process and the graphic transformation will behave similarly. For this process, the ratio (Σσxyj)/(Σσxj2) is equal to:
 Eq. 7
Eq. 7
At each point, the ratio SROI/SCa, which equals the ratio [Ty(ROI)]/Tx(ROI)] of the unperturbed variables is, by Equation 5, equal to:
 Eq. 8
Eq. 8
The intercept b is negative, so (SROI/SCa) < m. Therefore,
 Eq. 9
Eq. 9

By Equation 2, the expected value of m − m is positive.
At each time tj, the ratio SROI/SCa is the slope of the line segment from the original point to the perturbed point. Note from Equation 8 that the amount by which SROI/SCa deviates from the original slope m is equal to:
 Eq. 10
The denominator on the right side of Equation 10 will be the same across brain regions, but the numerator will tend to have a larger magnitude in regions with high uptake, both because ROI(t) will stay elevated and because a large m will drive b in the negative direction. This suggests that the bias effect will be more pronounced in regions with large VT, and our simulations support this suggestion.
Simulations
We examined data derived from 2 different experiments. The first set of analyses was based on the brain uptake of the 5HT1A antagonist [carbonyl-11C]WAY 100635 (6) in a baboon (R.V. Parsey, unpublished data, 1999). After a single bolus injection (injected dose, 60 MBq; specific activity, 27,417 GBq/mmol), emission data were acquired for 120 min, as previously described (7). The arterial input function was measured, corrected for the metabolites, and fitted to a sum of 3 exponentials (Fig. 2A). Regional uptake was analyzed using a 3-compartment kinetic analysis as previously described (7). Results from 3 regions were selected, representing regions with high uptake (cingulate cortex), regions with low uptake (dorsal raphe nuclei, DRN), and a reference region devoid of 5-HT1A receptors (cerebellum). Kinetic parameters were as follows: cingulate cortex, [K1, k2, k3, k4] = [0.4407, 0.3367, 0.1899, 0.027]; DRN, [K1, k2, k3, k4] = [0.2595, 0.1982, 0.0358, 0.0268]; and cerebellum, [K1, k2, k5, k6] = [0.6038, 0.8364, 0.0421, 0.0518], where K1 (mL/g/min) and k2 (per minute) describe the rate of transfer between the plasma to the free and nonspecific (nondisplaceable) compartments, k3 (per minute) and k4 (per minute) describe the rate of transfer between the nondisplaceable and specific compartments, and k5 (per minute) and k6 (per minute) describe the rate of transfer between the fast and the slow nondisplaceable compartments in the cerebellum.

(A) Plasma unmetabolized [11C]WAY100635 after injection of 60 MBq in baboon. Points are measured values; line represents values fitted to linear combination of 3 exponential functions (logarithmic scale). (B) Regional activities in cerebellum (△), DRN (•), and cingulate cortex (○). Curves and data points were generated by convolution of fitted plasma with impulse response functions. Kinetic parameters for impulse response functions are listed in Simulations section.
These parameters were used to create 3-compartment impulse response functions that were then convolved with the smoothed arterial input function to create “perfect” noise-free regional time–activity curves (Fig. 2B). Data were simulated for 120 min, with values calculated every minute. Normally distributed mean zero noise of various magnitudes was added to the data, assuming a constant level of noise over time. The magnitude of the noise was characterized by its SD, expressed relative to the mean value of the noise-free ROI activity over time. Noisy datasets were created in increments of 0.01, from SD = 0.01 to SD = 0.2 (20 noise levels). At each noise level, 1000 noisy curves were created. Noisy curves were then analyzed with the graphic method. The average of the 1000 VT values was compared with the true VT value (i.e., the VT value used to create the data) for each noise level to measure the bias introduced by the noise. In the absence of bias, the average VT of 1000 simulations would be identical to the true value of VT.
The second set of data was based on the brain uptake of the dopamine D1 receptor antagonist [11C]NNC 112 (8) in a human (injected dose, 648 MBq; specific activity, 48,655 GBq/mmol; Fig. 3). Details of the experimental and analysis procedures have been published (9). Three regions were selected, with high D1 receptor density (striatum), moderate D1 receptor density (subgenual prefrontal cortex, SGPC), or no detectable D1 receptors (cerebellum). Kinetic parameters derived from this experiment were as follows: striatum, [K1, k2, k3, k4] = [0.1533, 0.0674, 0.1241, 0.0358]; SGPC, [K1, k2, k3, k4] = [0.1674, 0.0736, 0.0727, 0.0453]; and cerebellum, [K1, k2] = [0.12, 0.0526] (i.e., 1 tissue compartment). As in the [11C]WAY 100635 experiment, noise-free curves were generated with these parameters, various levels of mean zero noise were added, noisy curves were analyzed with graphic analysis, and the results were plotted against the noise level.
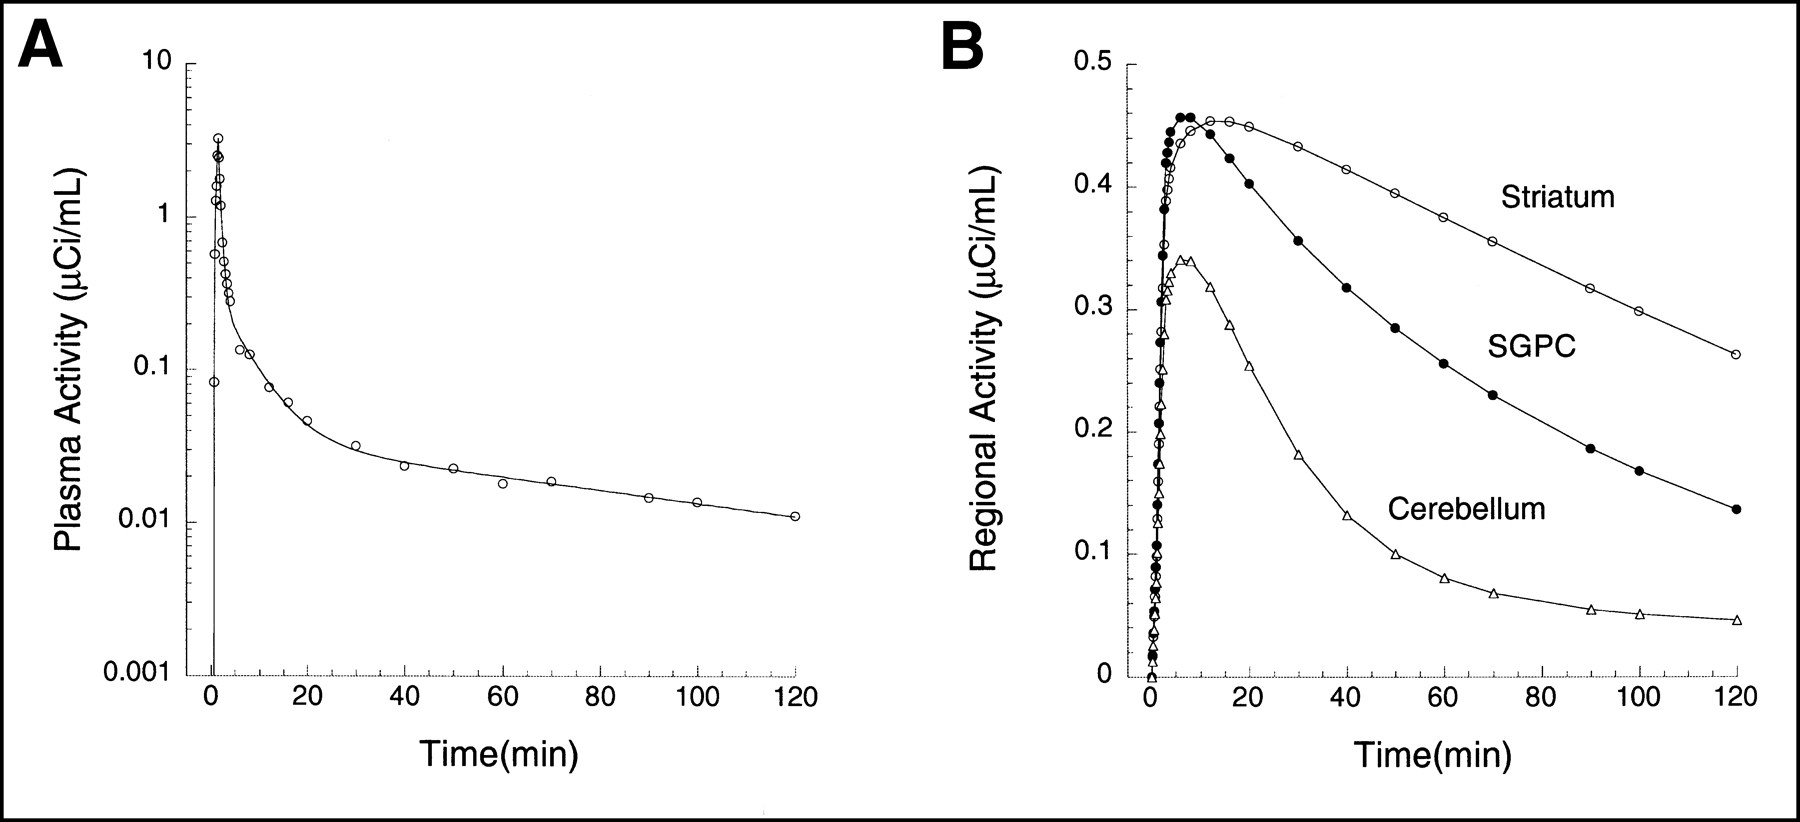
(A) Plasma unmetabolized [11C]NNC 112 after injection of 648 MBq in human. Points are measured values; line represents values fitted to linear combination of 3 exponential functions (logarithmic scale). (B) Regional activities in cerebellum (△), SGPC (•), and striatum (○). Curves and data points were generated by convolution of fitted plasma with impulse response functions. Kinetic parameters for impulse response functions are listed in Simulations section.
Confirmation in Real Data
Results from derivation of [11C]WAY 100635 binding potential (BP) to 5-HT1A receptors derived in 15 region of the human brain with the kinetic method were compared with results from the graphic method. Each regional BP value was the mean value of 10 experiments (10). Kinetic analysis (3 compartments) and graphic analysis were performed to derive regional VT. The 5-HT1A receptor BP was then calculated as the difference between VT in the ROI and VT in a region of reference devoid of receptors (cerebellum). The size of these regions varied considerably, from large neocortical regions such as the dorsolateral–prefrontal cortex (32,575 ± 2579 mm3) to small limbic regions such as the hippocampus proper (5824 ± 441 mm3) to very small and noisy regions such as the DRN (880 ± 742 mm3). Given the large between-region variability in size, we anticipated large variability in the noise level associated with the regional measurements. We tested the hypothesis that [11C]WAY 100635 BP derived by graphic analysis would be lower than [11C]WAY 100635 BP derived by kinetic analysis and that this underestimation would depend on the level of the noise, as measured by the residual sum of squares of the kinetic fit.
RESULTS
Simulations
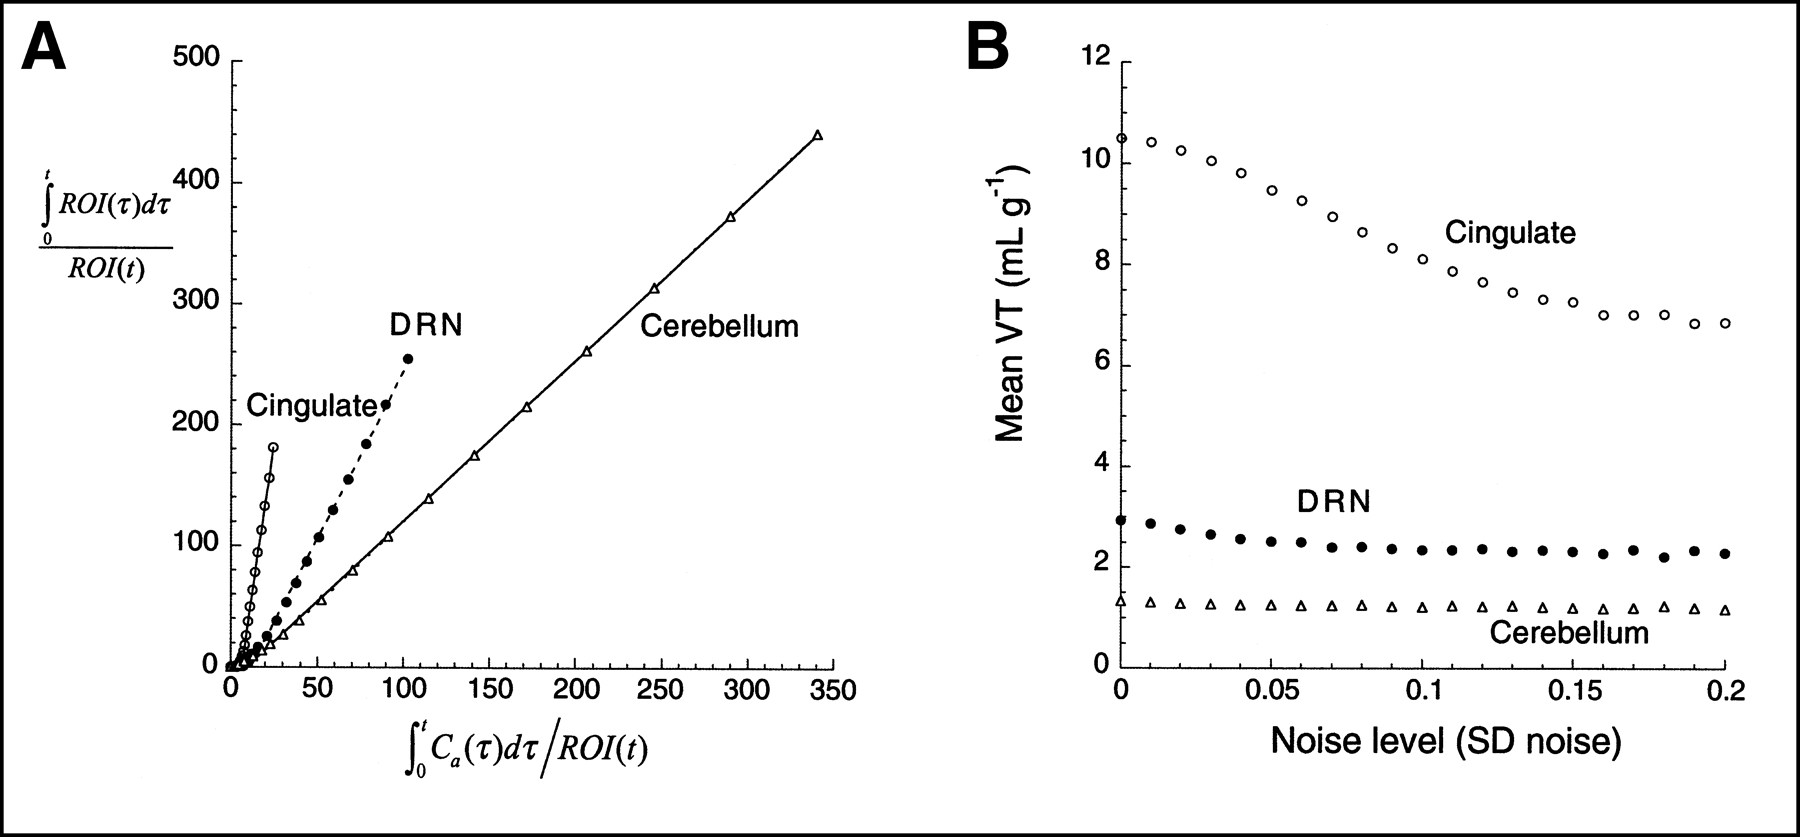
Figures 4 and 5 present the graphic analysis of the noise-free dataset and the result of Monte Carlo simulations for the [11C]WAY 100635 and [11C]NNC 112 experiments, respectively. The simulation results show that the bias effect of zero mean noise was detected. As the level of the noise increased, the mean estimate of VT decreased. This bias has the 3 properties predicted by the theoretic analysis: first, that given the negative intercept, the bias always leads to an underestimation of VT; second, that this effect increases as the noise increases; and third, that this effect is more pronounced in regions with high VT than in regions with low VT, because regions with high VT are associated with more negative y-axis intercepts and greater ROI values for large t. Similar simulations using classic, iterative, nonlinear least squares curve fitting to a compartmental model have led to bias estimates that, as a fraction of true VT, are an order of magnitude smaller than those observed with the graphic method (9).

(A) Graphic analysis of noise-free data presented in Figure 2. (B) Results of simulations show mean VT as function of SD of noise (SD normalized by mean regional activity of noise-free dataset, so as to have comparable level of noise between regions). One thousand trials were performed at each noise level. Effect of bias is more pronounced in cingulate cortex than in regions with lower VT (DRN, cerebellum).
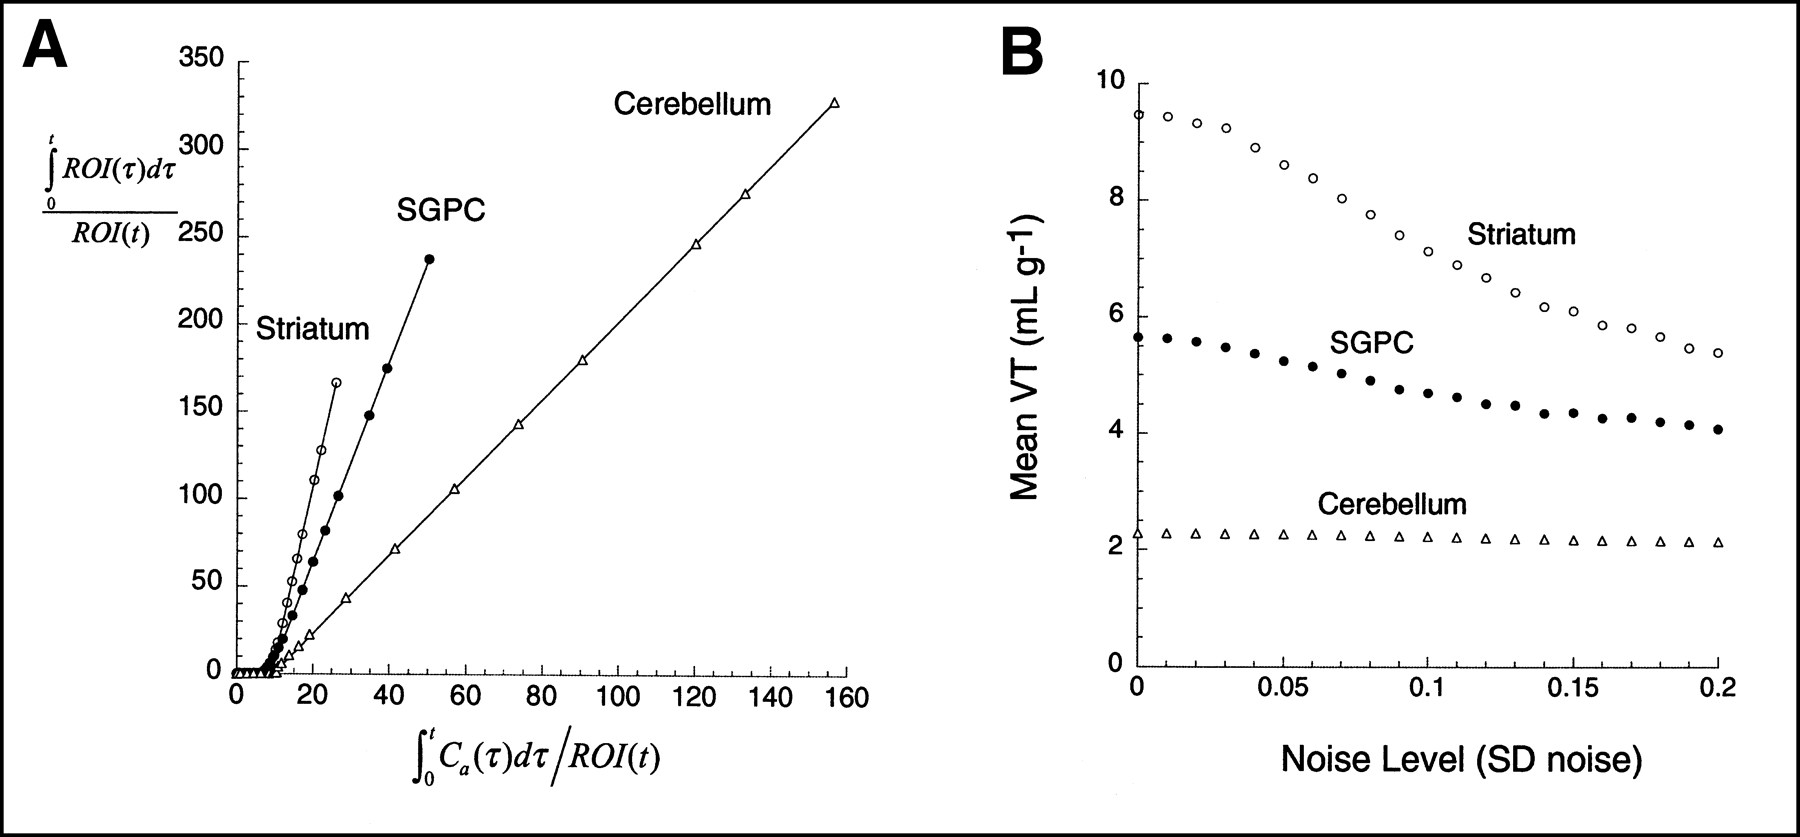
(A) Graphic analysis of noise-free data presented in Figure 4. (B) Results of simulations show mean VT as function of SD of noise (SD normalized by mean regional activity of noise-free dataset, so as to have comparable level of noise between regions). One thousand trials were performed at each noise level. Effect of bias is more pronounced in striatum than in regions with lower VT (SGPC, cerebellum).
Confirmation in Real Data
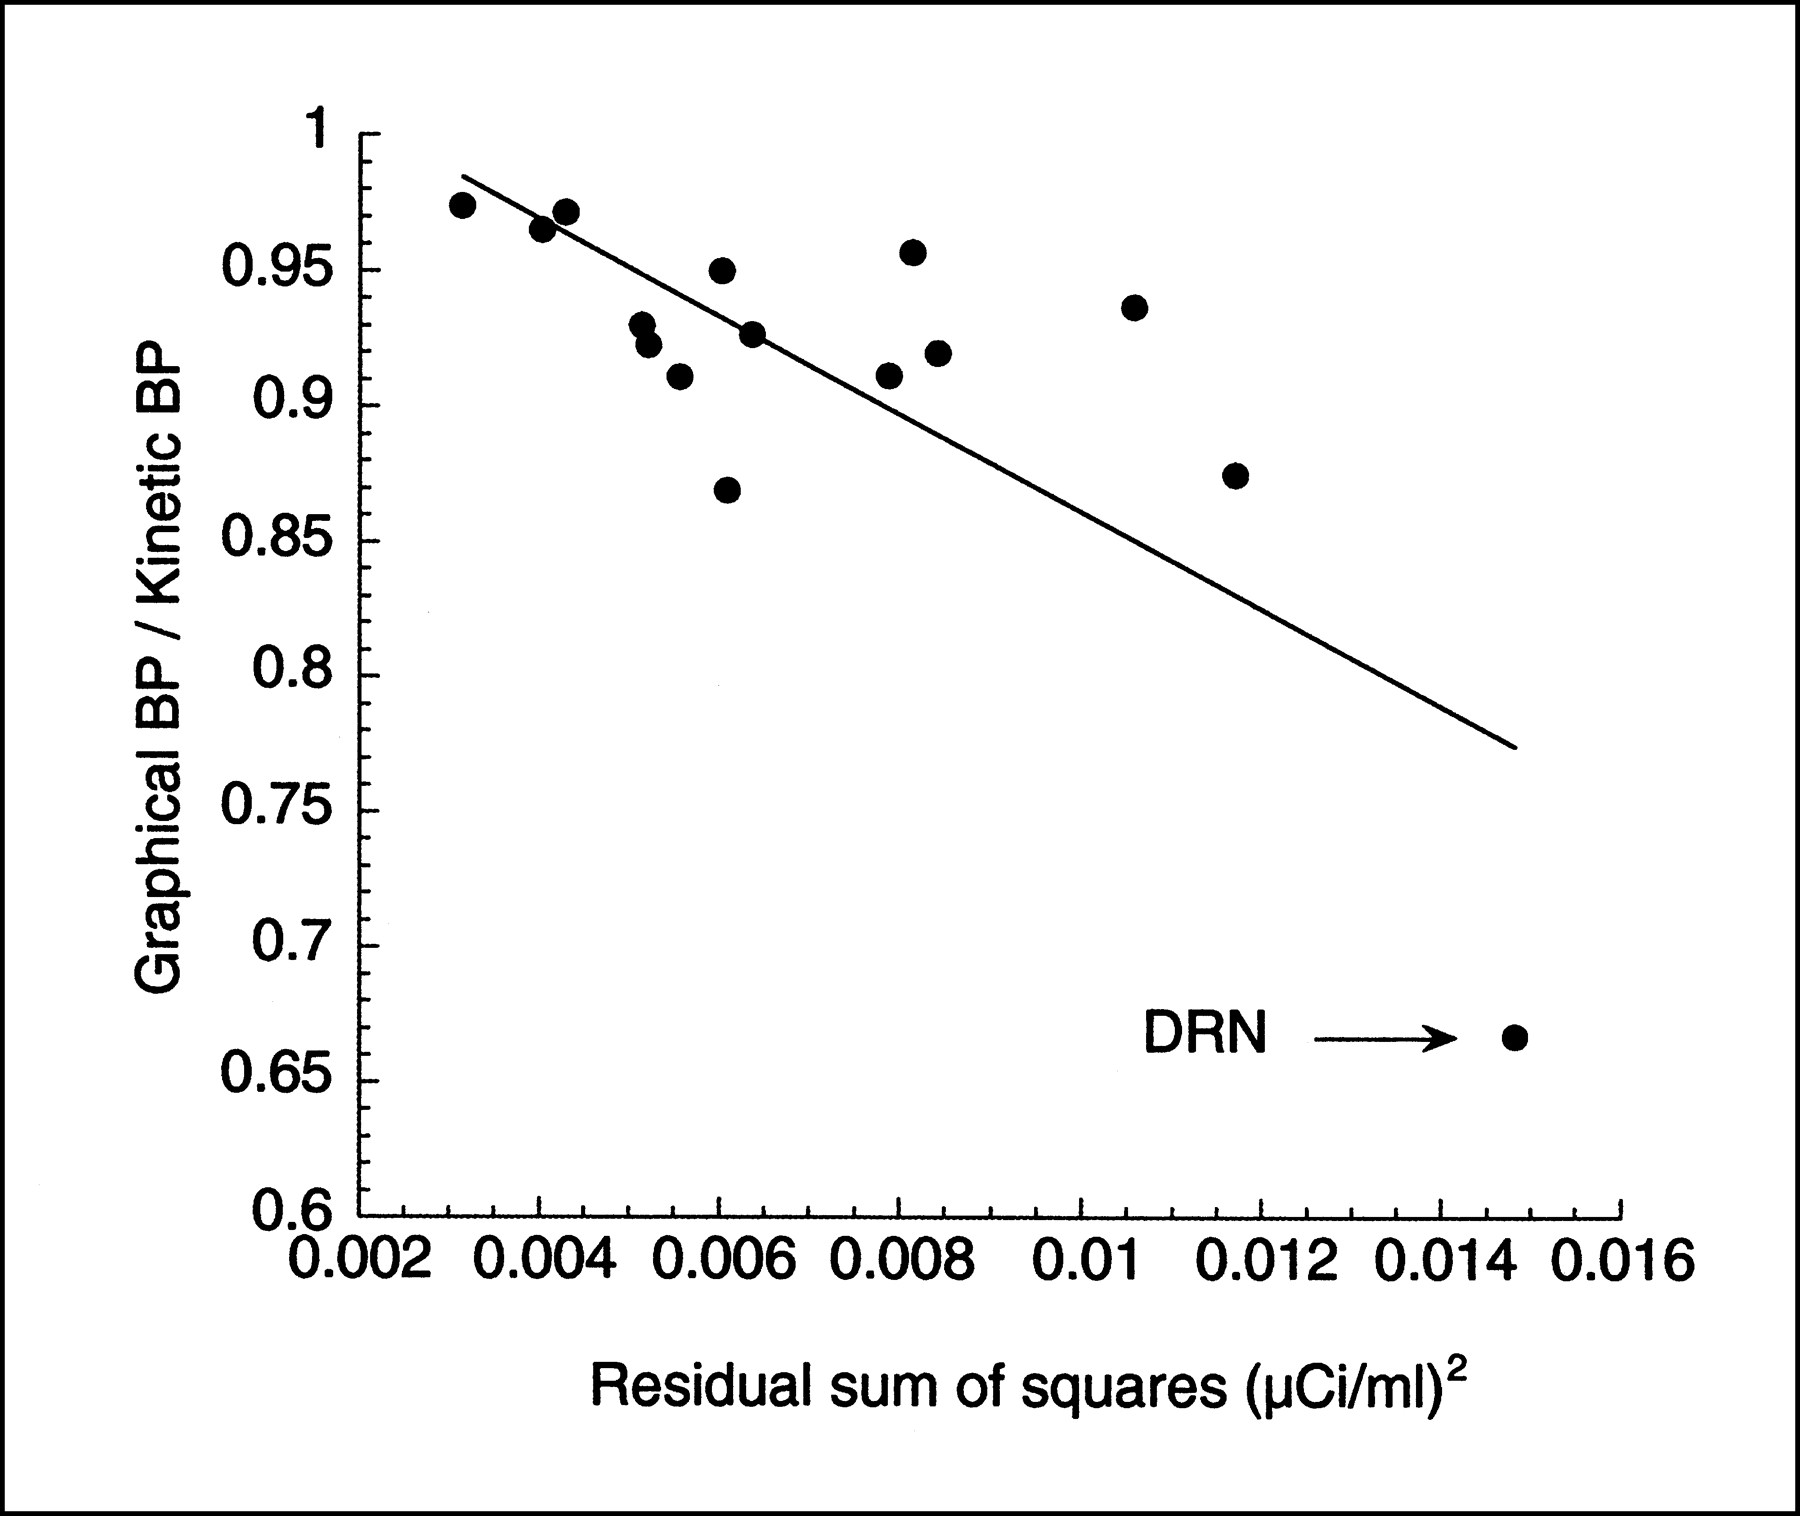
Graphic BP values were slightly but significantly lower than kinetic BP values, by an average of 5% ± 9% (repeated measures ANOVA, P < 0.001). This BP underestimation was detected mostly in small and noisy regions. For example, BP obtained by the graphic method was 3% ± 3%, 13% ± 6%, and 33% ± 8% less than BP obtained by kinetic modeling in the dorsolateral–prefrontal cortex (region size, 32,575 ± 2579 mm3), hippocampus (5824 ± 441 mm3), and DRN (880 ± 742 mm3), respectively. The noise in the measurement, as estimated by the residual sum of the square of the kinetic fit, was significantly associated with the magnitude of the underestimation of BP by the graphic method compared with the kinetic method (r2 = 0.59, P < 0.004; Fig. 6). This analysis shows the presence of the effect in real data.

Relationship between experimental noise in ROIs (n = 15), as estimated by residual sum of squares of kinetic fit (x-axis), and underestimation of BP by graphic analysis compared with kinetic analysis. Each point is average of BP of 10 [11C]WAY 100635 experiments conducted on humans. Dorsal raphe nucleus (DRN, arrow) is region associated with highest noise, and DRN BP is considerably underestimated by graphic analysis compared with kinetic analysis.
DISCUSSION
Our results indicate that mean zero noise is associated with underestimation of distribution volumes when PET data are analyzed with the graphic method. The underestimation was theoretically predicted, confirmed in Monte Carlo simulations, and observed in real data. The pertinent features of our noise model are that it has zero mean and is not temporally correlated. The transformation brings about a particular correlation structure between the error terms in the predictor and dependent variables, leading to biased estimates of VT. This phenomenon is reminiscent of noise-dependent bias encountered in the analysis of saturation binding data. The transformation of saturation data commonly called the Scatchard plot (11) has been shown to introduce a noise-related bias to the estimates of Bmax and KD (12).
In this article, we considered the effect of only random mean zero noise, such as the noise associated with measurement of radioactive decay. Because the noise is expected to increase with the duration of the experiment (because of isotope decay), we also performed a simulation in which mean zero noise increased with time, and the results were similar (8).
Despite this problem, the graphic method is still preferable to kinetic compartmental analysis when nonlinear analysis is ill-conditioned. One advantage of the graphic method is that the derivation of VT does not depend on an underlying choice of compartment model. This property makes the method particularly useful when the possible error from noise bias is outweighed by the error from an inappropriate choice of model. For example, the cerebellum uptake of [11C]NNC 112 does not perfectly fit a 1-tissue-compartment model. However, the small size and slow kinetics of the third compartment result in poor identifiability of the cerebellum VT when the 2-tissue-compartment model is used (9). In this situation, graphic analysis is preferable, at least in the cerebellum.
Nevertheless, our results suggest that, when the data are appropriately described by a given compartmental configuration, kinetic analysis of untransformed data may be more robust than graphic analysis. In this situation, the proposition that graphic analysis is less sensitive to experimental noise is not correct (13), and nonlinear analysis of untransformed data may be the method of choice to analyze data from reversible neuroreceptor radiotracer PET studies. We propose that, at the minimum, the potential effect of this bias be carefully evaluated before graphic analysis is used for new radiotracers.
CONCLUSION
We have shown that additive mean zero statistical noise in PET data causes a negative bias in the estimate of VT when the graphic method is used. We have also shown that the extent of the bias depends on both the magnitude of the noise and the magnitude of the true VT. Theoretic analysis, computer simulation, and correlation with clinical data all support these conclusions. But the method also has several advantages. It is subject to neither the convergence problems nor the compartment-choice problems sometimes associated with iterative methods. All these factors should be considered when choosing a method for analysis of data from reversible neuroreceptor radiotracer PET studies. In particular, if the investigator is confident that the data are well described by a particular compartmental configuration, then nonlinear analysis of untransformed data appears to be the method of choice.
Acknowledgments
The authors thank Anissa Abi-Dargham, MD; Ramin Parsey, MD; J. John Mann, MD; and the investigators of the Brain Imaging Division, Department of Neuroscience, New York State Psychiatric Institute, for providing primary data used in simulations. The authors also thank Richard E. Carson, PhD, for fruitful discussions. This study was supported by the U.S. Public Health Service (grants NIMH K02 MH01603-0, 2 P30 MH46745-10, and 1 ROI MH59144-01).
Footnotes
Received Dec. 13, 1999; revision accepted May 5, 2000.
For correspondence or reprints contact: Mark Slifstein, PhD, New York State Psychiatric Institute, 1051 Riverside Dr., Unit 31, New York, NY 10032.
In this issue


Jump to section
Related Articles
Cited By...
- In Vivo Evaluation of 6 Analogs of 11C-ER176 as Candidate 18F-Labeled Radioligands for 18-kDa Translocator Protein
- Radiochemical Synthesis and Evaluation of 3-[11C]Methyl-4-aminopyridine in Rodents and Non-Human Primates for Imaging Potassium Channels in the CNS
- In vitro and in vivo NIR Fluorescence Lifetime Imaging with a time-gated SPAD camera
- In vivo characterization and quantification of neurofibrillary tau PET radioligand [18F]MK-6240 in humans from Alzheimers disease dementia to young controls
- Simplified Quantification and Acquisition Protocol for 123I-MIBG Dynamic SPECT
- Test-Retest Reliability of the SERT Imaging Agent 11C-HOMADAM in Healthy Humans
- Parametric Method Performance for Dynamic 3'-Deoxy-3'-18F-Fluorothymidine PET/CT in Epidermal Growth Factor Receptor-Mutated Non-Small Cell Lung Carcinoma Patients Before and During Therapy
- Preclinical Evaluation and Quantification of 18F-Fluoroethyl and 18F-Fluoropropyl Analogs of SCH442416 as Radioligands for PET Imaging of the Adenosine A2A Receptor in Rat Brain
- Parametric Methods for Dynamic 11C-Phenytoin PET Studies
- Flutriciclamide (18F-GE180) PET: First-in-Human PET Study of Novel Third-Generation In Vivo Marker of Human Translocator Protein
- Parametric Binding Images of the TSPO Ligand 18F-DPA-714
- Parametric Methods for Quantification of 18F-FAZA Kinetics in Non-Small Cell Lung Cancer Patients
- Longitudinal Amyloid Imaging Using 11C-PiB: Methodologic Considerations
- Relative Equilibrium Plot Improves Graphical Analysis and Allows Bias Correction of Standardized Uptake Value Ratio in Quantitative 11C-PiB PET Studies
- In Vivo Quantification of Human Serotonin 1A Receptor Using 11C-CUMI-101, an Agonist PET Radiotracer
- Dynamic PET Denoising with HYPR Processing
- HRRT Versus HR+ Human Brain PET Studies: An Interscanner Test-Retest Study
- Compartmental Modeling of 11C-HOMADAM Binding to the Serotonin Transporter in the Healthy Human Brain
- Modeling Considerations for 11C-CUMI-101, an Agonist Radiotracer for Imaging Serotonin 1A Receptor In Vivo with PET
- Evaluation of the Serotonin Transporter Ligand 123I-ADAM for SPECT Studies on Humans
- Estimation of Serotonin Transporter Parameters with 11C-DASB in Healthy Humans: Reproducibility and Comparison of Methods
- 18F-CPFPX PET: On the Generation of Parametric Images and the Effect of Scan Duration
- Optimal Duration of PET Studies with 18F-Fluoroethyl-Diprenorphine
- Quantification of 123I-PE2I Binding to Dopamine Transporter with SPECT After Bolus and Bolus/Infusion
- Motion Artifact Reduction on Parametric PET Images of Neuroreceptor Binding
- In Vivo Imaging of Human Cerebral Nicotinic Acetylcholine Receptors with 2-18F-Fluoro-A-85380 and PET
- Change in Binding Potential as a Quantitative Index of Neurotransmitter Release Is Highly Sensitive to Relative Timing and Kinetics of the Tracer and the Endogenous Ligand
- Quantitative Analysis of (-)-N-11C-Propyl-Norapomorphine In Vivo Binding in Nonhuman Primates