


Abstract
In this study, the performance of various methods for generating quantitative parametric images of dynamic 11C-phenytoin PET studies was evaluated. Methods: Double-baseline 60-min dynamic 11C-phenytoin PET studies, including online arterial sampling, were acquired for 6 healthy subjects. Parametric images were generated using Logan plot analysis, a basis function method, and spectral analysis. Parametric distribution volume (VT) and influx rate (K1) were compared with those obtained from nonlinear regression analysis of time–activity curves. In addition, global and regional test–retest (TRT) variability was determined for parametric K1 and VT values. Results: Biases in VT observed with all parametric methods were less than 5%. For K1, spectral analysis showed a negative bias of 16%. The mean TRT variabilities of VT and K1 were less than 10% for all methods. Shortening the scan duration to 45 min provided similar VT and K1 with comparable TRT performance compared with 60-min data. Conclusion: Among the various parametric methods tested, the basis function method provided parametric VT and K1 values with the least bias compared with nonlinear regression data and showed TRT variabilities lower than 5%, also for smaller volume-of-interest sizes (i.e., higher noise levels) and shorter scan duration.
It has been proposed that P-glycoprotein (P-gp) may play a role in treatment-resistant central nervous system disorders (1). P-gp is an adenosine triphosphate–binding cassette transmembrane glycoprotein located at the luminal side of the blood–brain barrier, where it functions as an efflux transporter and hence prevents its substrates from entering the brain. In common central nervous system disorders, such as epilepsy, overexpression of P-gp is thought to be an important mechanism of pharmacoresistance (2,3).
At present, several 11C-labeled P-gp substrate tracers, which are promising imaging tools for the in vivo assessment of P-gp function at the blood–brain barrier, are available. The best characterized tracers are (R)-11C-verapamil (4–7) or 11C-N-desmethylloperamide (8). In addition, tracers to measure P-gp expression, such as 11C-laniquidar (8–10) and 11C-tariquidar (11), are available.
In principle, the mapping of P-gp distribution using PET can also be performed using relatively weak P-gp substrate tracers, because these should yield higher cerebral uptake than strong substrate tracers, such as (R)-11C-verapamil (7). Phenytoin is a weak P-gp substrate and, in a previous study, a reversible single-tissue-compartment model with blood volume parameter (1T2k + Vb) was identified as the best candidate model for describing 11C-phenytoin kinetics in healthy subjects (12). 11C-phenytoin showed several potential advantages, such as low metabolism; a lower efflux rate (k2) than, for example, 11C-verapamil; and the ability to shorten scan duration from 60 to 45 min without notable loss of accuracy and precision of the pharmacokinetic parameters (12).
To study differences in P-gp function at the voxel level, parametric 11C-phenytoin images may be needed. To date, no parametric methods have been applied to 11C-phenytoin data yet. Therefore, the aim of the present study was to investigate the performance of various parametric methods for describing 11C-phenytoin kinetics.
MATERIALS AND METHODS
Scanning Protocol
Six healthy male volunteers (mean age, 28 y; age range, 21–32 y) were included in this study. All subjects were screened for medical history and underwent physical (including neurologic) examination and laboratory tests. Subjects were also screened for neurologic and psychiatric illness and history of drug abuse. Written informed consent was obtained from each subject after they were given a written and verbal description of the study. The study was approved by the Medical Ethics Review Committee of the VU University Medical Center.
All subjects underwent 2 baseline dynamic PET studies on the same day. Scans were obtained on a Gemini TF PET/CT scanner (Philips). The properties of this scanner have been reported elsewhere (13). Before tracer injection, a low-dose CT scan was acquired. These data were used to correct the subsequent emission scan for photon attenuation. Next, a dynamic emission scan in 3-dimensional acquisition mode was started simultaneously with an intravenous injection of 345 ± 54 (mean ± SD) MBq of 11C-phenytoin with a specific activity of 72 ± 27 MBq·μmol−1. 11C-phenytoin was synthesized as described previously (14). The radiotracer was provided in a total volume of 7 mL and administered at a rate of 0.8 mL·s−1, followed by a flush of 42 mL of saline at 2.0 mL·s−1 using an infusion pump (Med-Rad).
During the 60-min 11C-phenytoin scan, arterial blood was withdrawn continuously using an automatic online blood sampler (Veenstra Instruments) (15) at a rate of 5 mL·min−1 for the first 5 min and 2.5 mL·min−1 thereafter. At 2.5, 5, 10, 20, 30, 40, and 60 min after tracer injection, continuous blood sampling was interrupted briefly to withdraw 7 mL of manual blood samples. After each sample, the arterial line was flushed with a heparinized saline solution. In addition, all subjects underwent a structural MRI scan using a 1.5-T Sonata scanner (Siemens Medical Solutions). More details on the study protocols can be found elsewhere (12).
Blood and Image Analysis
Manual samples were used to determine plasma–to–whole-blood radioactivity concentration ratios. In addition, the concentrations of parent 11C-phenytoin and its radioactive metabolites in plasma were determined using the procedure described by Mansor et al. (12). For the image analysis, each MR image was coregistered with the corresponding PET image using VINCI software (Max Plank Institute). Next, volumes of interest (VOIs) were defined using an automated method based on an MRI template (PVElab) (16). The P-gp is fairly uniformly distributed over the brain and therefore we used PVElab with the Hammers template that consisted of 67 regions covering the entire brain (17). Gray and white matter segmentation of the coregistered MR image was performed using statistical parametric mapping version 8 (SPM8), which is incorporated in the PVElab software. These segmentations were used in combination with the VOIs to extract gray matter regional values from the dynamic PET studies.
Parametric Analysis
Three different parametric methods were evaluated: the Logan plot analysis (18), a basis function method (BFM) implementation of the single-tissue-compartment model with blood volume parameter (19), and spectral analysis (SA) (20). For the Logan method, the start and end times used were 12 and 140 min, respectively. For the BFM method, the start and end basis function exponentials were 0.04 and 0.1 min−1, and for SA these were 0.03 and 0.17 min−1, respectively. Both methods were used with 30 basis functions.
The distribution volume (VT) was obtained with all 3 methods, whereas the influx rate constant (K1) was obtained using the BFM and SA methods. The finding from this parametric study will be compared with a previous NLR compartmental analysis performed on the same data (12). Because of the sensitivity of NLR to noise, comparisons were performed at the VOI level with both small (≤5 mL) and large (>5 mL) VOIs to assess their effect on the test–retest variability of the studied parametric methods. After kinetic analysis, the TRT variability of all kinetic parameters was calculated. TRT variability was calculated as the difference between test and retest kinetic parameters divided by their mean times 100%. The Levene test was used to assess the impact of different scan durations and VOI size on TRT of K1 and VT. In addition, the parametric VT and K1 values were averaged over each VOI. TRT performance of VOI-averaged parametric values was analyzed using Bland–Altman plots (21). Apart from assessing bias and impact of different VOIs sizes on parametric quantification, the impact of shorter scan duration on parametric TRT variability was also studied.
RESULTS
Evaluation of Bias Between Nonlinear Regression and Parametric Methods
Typical 11C-phenytoin parametric VT and K1 images for a healthy subject are shown in Supplemental Figure 1 (supplemental materials are available at http://jnm.snmjournals.org). The correlations of VT obtained using the 3 parametric methods with that obtained using NLR are shown in Figure 1. Correlations are good for all 3 methods, but at the same time a small negative bias for the parametric methods of about 5% can be seen. Figure 2 shows scatterplots of K1 obtained using BFM and SA versus K1 obtained using NLR. Correlations are excellent, with an average overestimation of about 4% for BFM and an underestimation of about 16% for SA. Results from all correlation analyses are summarized in Table 1.
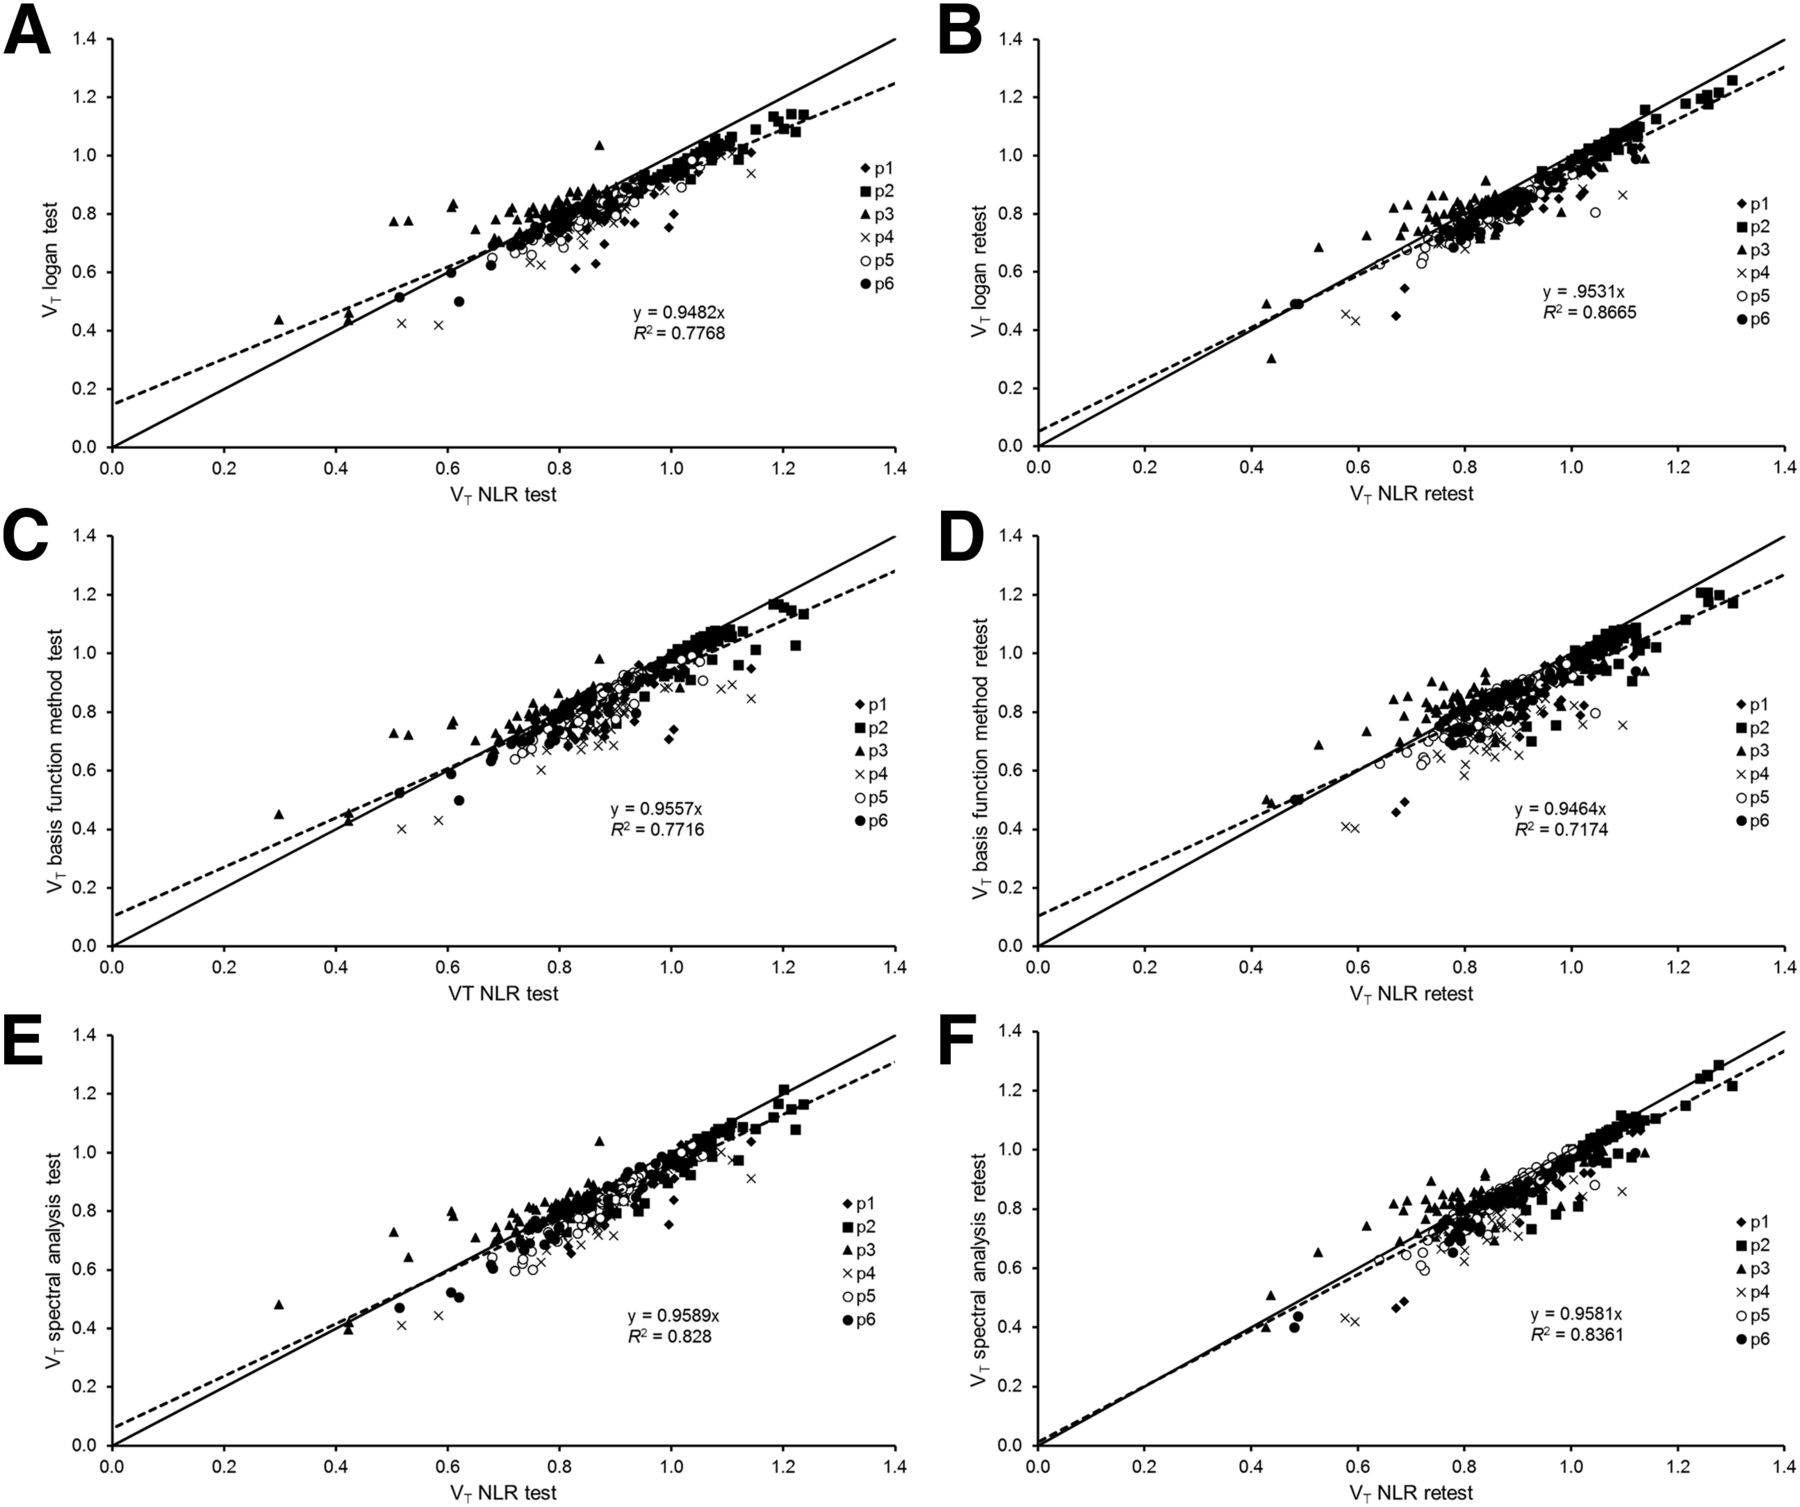
Scatterplots of regional averaged VT obtained with parametric method versus NLR analysis, pooled over 6 subjects. VT using Logan for test (A), Logan retest (B), BFM test (C), BFM retest (D), SA test (E), and SA retest (F). Solid line represents line of identity, whereas dotted line represents correlation line with intercept. Data were taken from whole regions.
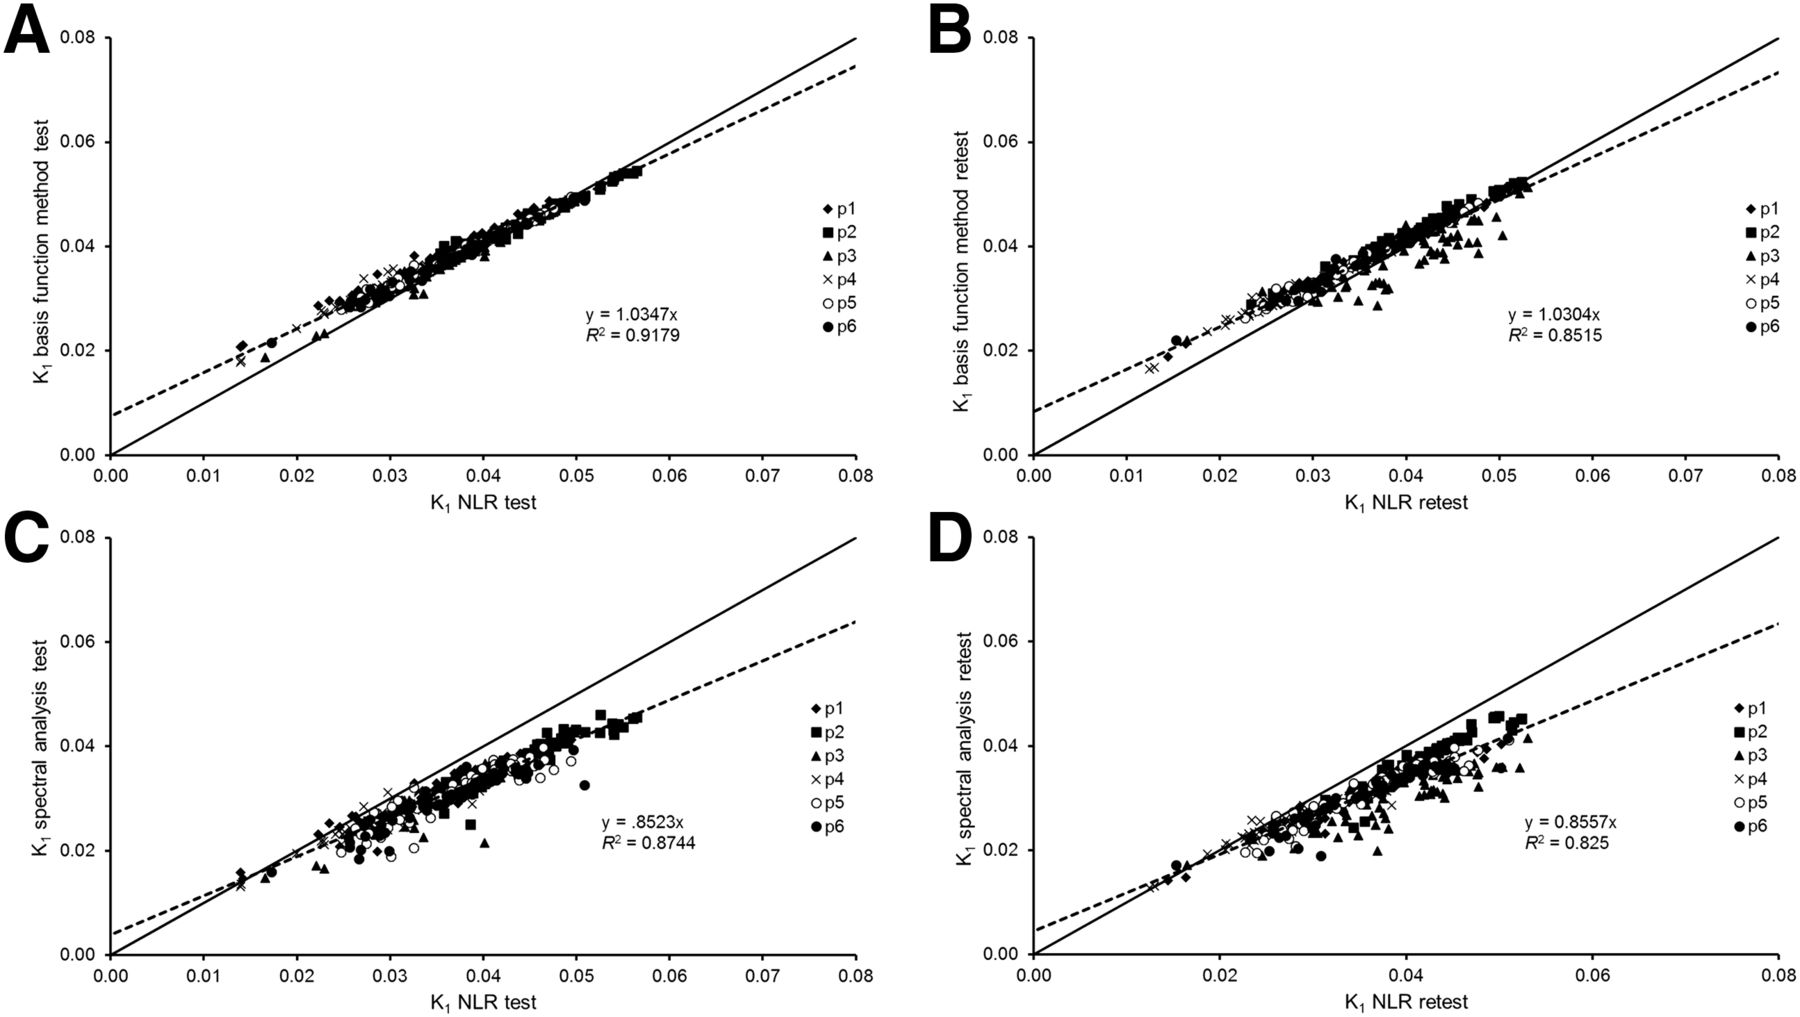
Scatterplots of K1 obtained with parametric method versus NLR analysis pooled over 6 subjects. K1 using BFM for test (A), BFM retest (B), SA test (C), and SA retest (D). Solid line represents line of identity, whereas dotted line represents correlation line with intercept.
Summary of Correlation, Slope, and Intercept Between Various Parametric Methods Compared with NLR
TRT Repeatability
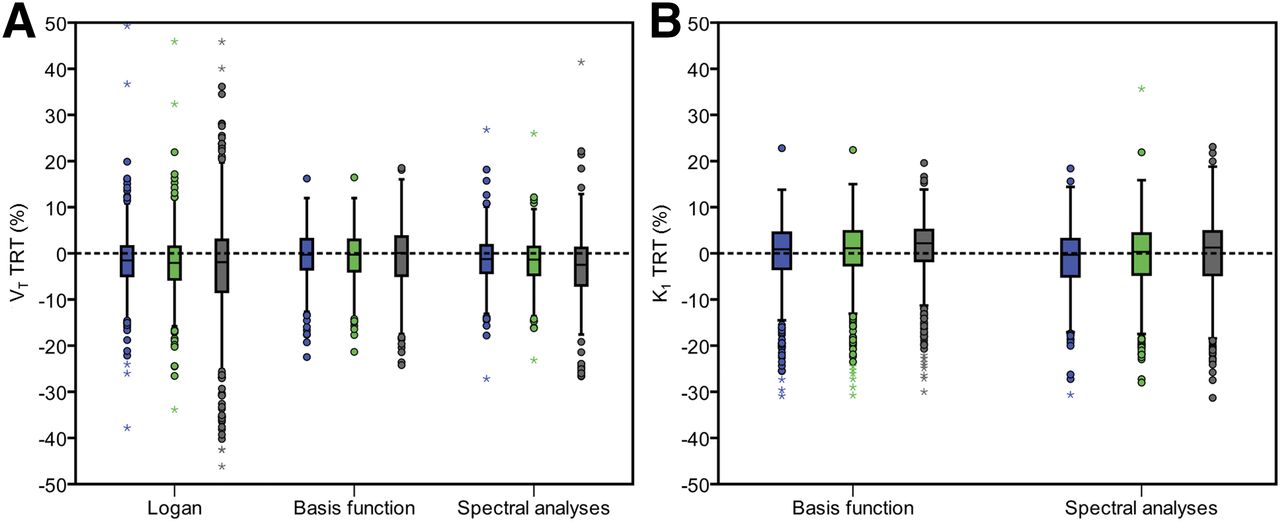
Figure 3 shows box plots of the percentage differences between test and retest values of VT and K1, respectively, obtained using the Logan, BFM, and SA methods. For each parametric method, results are provided for both small (≤5 mL) and large (>5 mL) VOIs. The repeatability of Logan- and SA-derived VT seemed to be more affected by the use of small VOI BFM–derived VT. For K1, both methods (BFM and SA) showed less than 5% (1 SD) TRT variability. In general, the median percentage difference between test and retest studies was about 5%. A somewhat wider range (larger interquartile range) in TRT variability of both K1 and VT (Fig. 3) was observed for small compared with large VOI, but this difference was not statistically significant (Levene test, P > 0.05).

TRT variability of VT (A) and K1 (B) for different parametric methods for small (≤5 mL, blue) and large (>5 mL, green) VOIs.
Impact of Scan Duration
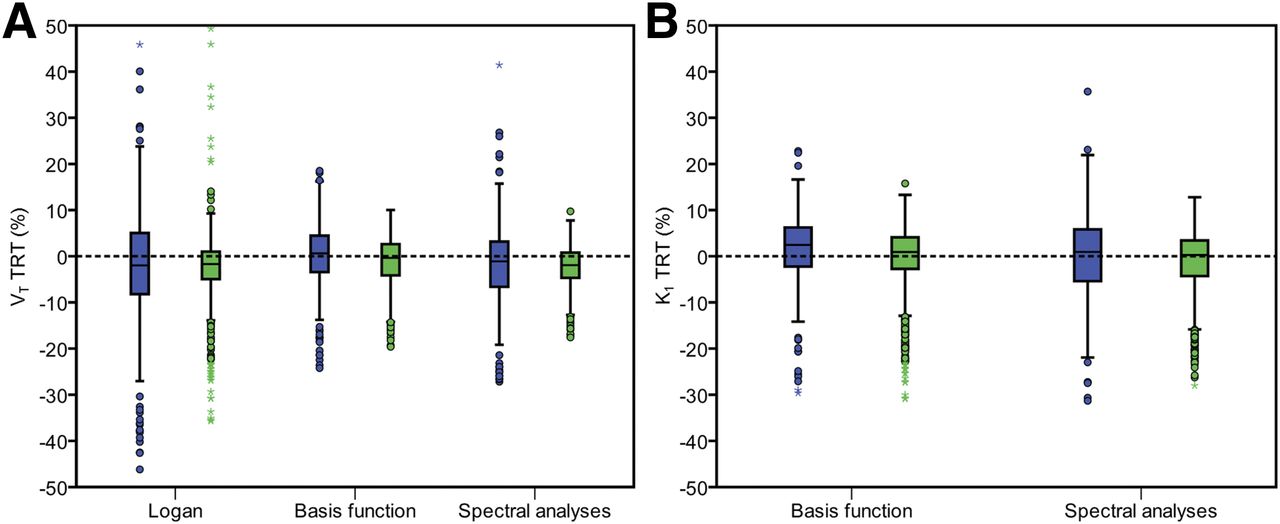
Figures 4A and 4B show VT and K1 TRT variability, respectively, for different scan durations. A somewhat wider range (larger interquartile range) of 9.3% for 30 min, versus 6.7% and 6.3% for 45 and 60 min, respectively, in TRT variability of VT was seen. Logan- and SA-derived VT seemed to be more affected by shortening the scan duration than BFM-derived VT. Yet, even for shorter scan durations, K1 obtained with both methods (BFM and SA) showed less than 5% (1 SD) TRT variability. Shortening the scan duration to 45 min leads to slight deterioration of VT TRT variability (from 1.7% to 2.1% for Logan, from 0.6% to 0.7% for BFM, and from 1.29% to 1.7% for SA), but differences were not statistically significant (Levene test, P > 0.05). Differences between 45- and 30-min scan durations (from 2.1% to 4% for Logan, from 0.7% to 0.75% for BFM, and from 1.7% to 2.9% for SA), however, were statically significant (Levene test, P < 0.05). TRT data are shown as Bland–Altman plots in Supplemental Figure 2 for 60 min of scan durations, and the plots for 45 and 30 min are shown in Supplemental Figures 3 and 4. Variabilities in the Bland–Altman plots for 45-min data were similar to those of 60-min data but became larger for 30-min data. A summary of the Bland–Altman plots is given in Table 2. It can be seen that shortening the scan duration from 60 to 45 min did not substantially affect TRT variability of K1 and VT.
TRT variability of VT (A) and K1 (B) for different parametric methods and scan durations. Blue box plot = 60 min; green box plot = 45 min; brown box plot = 30 min.
Summary of Results for Bland–Altman Plots for Each Method with Different Scan Durations for VT (Logan, BFM, and SA) and K1 (BFM and SA)
DISCUSSION
Results of the present study indicate the validity of several parametric methods for quantifying 11C-phenytoin kinetics in the brain. Three well-established and accurate parametric methods were evaluated. Other alternatives such as multilinear analysis (22) were not available at our institute and could not be evaluated in the current study. However, this method could provide improved calculation time compared with BFM because of a full linear approach. For VT, strong correlations and good agreement were seen between the various parametric methods and NLR. The small negative bias of about −5% was mainly caused by the data from a single subject (p5). Unfortunately, it was not possible to identify any reason for this discrepancy. Although the Logan plot does not take Vb into account, the bias in VT was not substantially different from the biases seen with BFM and SA. In addition, although Logan plot analysis may suffer from noise-induced bias (22,23), this was not seen in the present study. BFM showed an overestimation in K1 of about 4% with a larger underestimation in the case of SA. The incorporation of Vb as a fit parameter would result in an underestimation of K1 for SA (Fig. 2). Therefore, the SA analysis was repeated without incorporating Vb as a fit parameter. In this case, the underestimation in K1 reduced to about 5%. At the same time, however, bias in VT increased to about 15%. Overall, among the 3 parametric methods, BFM provided the smallest bias in VT of 5% underestimation compared with NLR.
As shown in Figure 3, the TRT variabilities of VT and K1 for all 3 parametric methods were small (SD < 5%). Overall, BFM shows the best TRT variability for VT, followed by SA and Logan, respectively. With respect to K1, SA seemed to provide better TRT variability than BFM. TRT variabilities were slightly increased for small compared with large VOIs for all parametric methods. In addition, the TRT percentage of VT and K1 in parametric methods were comparable to the NLR method. Even though the TRT variabilities were small, there might be a limitation for quantification of 11C-phenytoin in or near high uptake regions such as the choroid plexus due to spill-over effects, as was also seen for the hippocampus in (R)-11C-verapamil studies (24).
In general, TRT variabilities of K1 and VT increased when shortening the scan duration. VT repeatability obtained with BFM seemed to be less affected when shortening scan duration. K1 repeatability was more sensitive to reducing scan duration. Overall, scan duration could be shortened from 60 to 45 min without substantially affecting VT and K1 repeatability for any of the methods tested. The performances of various methods, however, were based solely on data obtained from healthy (male) subjects. Further studies will be needed to assess whether various parametric method are sensitive enough to provide better quantification under other or pathologic conditions.
Overall, from our studies the finding shows that the BFM seems to be a good parametric method for the evaluation of 11C-phenytoin studies, with the potential to reduce the scan duration to 45 min.
CONCLUSION
Among the different parametric methods for quantifying 11C-phenytoin kinetics in the brain, BFM produced the best results in terms of bias and repeatability. In addition, scan duration could be shortened to 45 min, but further validation under pathologic conditions is warranted.
DISCLOSURE
This work was supported by the European Union seventh framework program EURIPIDES (FP7/2007-2013 under grant agreement no 201380). Syahir Mansor is a PhD student and was supported by a scholarship from the Malaysian Ministry of Education and University Sains Malaysia. No other potential conflict of interest relevant to this article was reported.
Footnotes
Published online Sep. 22, 2016.
- © 2017 by the Society of Nuclear Medicine and Molecular Imaging.
REFERENCES
- Received for publication May 24, 2016.
- Accepted for publication August 29, 2016.


Jump to section
Related Articles
Cited By...
- No citing articles found.