


Abstract
The cerebral adenosine A2A receptor is an attractive therapeutic target for neuropsychiatric disorders. 18F-fluoroethyl and 18F-fluoropropyl analogs of 18F-labeled pyrazolo[4,3-e]-1,2,4-triazolo[1,5-c]pyrimidine (SCH442416) (18F-FESCH and 18F-FPSCH, respectively) were developed as A2A receptor–specific PET ligands. Our aim was to determine an appropriate compartmental model for tracer kinetics, evaluate a reference tissue approach, and select the most suitable PET ligand. Methods: A 90-min dynamic PET scan with arterial blood sampling and metabolite analysis was acquired for 22 healthy male Wistar rats starting at the time of 18F-FESCH (n = 12) and 18F-FPSCH (n = 10) injection. For each tracer, half the animals were vehicle-treated whereas the other half were pretreated with the A2A receptor–selective antagonist KW-6002, inducing full blocking. Regional tissue total volume of distribution (VT) was estimated by 1- and 2-tissue-compartment modeling (1TCM and 2TCM, respectively) and Logan graphical analysis. Midbrain, cerebellum, and hippocampus were evaluated as the reference region by comparing baseline VT with VT under full blocking conditions and comparing striatal nondisplaceable binding potential (BPND) using a simplified reference tissue model (SRTM) with distribution volume ratio minus 1 (DVR − 1) for 60- and 90-min scans. Results: On the basis of the Akaike information criterion, 1TCM and 2TCM were the most appropriate models for 18F-FPSCH (baseline striatal VT, 3.7 ± 1.1) and 18F-FESCH (baseline striatal VT, 5.0 ± 2.0), respectively. Baseline striatal VT did not significantly differ between tracers. After pretreatment, striatal VT was reduced significantly, with no significant decrease in hippocampus, midbrain, or cerebellum VT. Baseline striatal SRTM BPND did not differ significantly from DVR − 1 except for 18F-FPSCH when using a 60-min scan and midbrain as the reference region, whereas Bland–Altman analysis found a smaller bias for 18F-FESCH and a 60-min scan. After pretreatment, striatal SRTM BPND did not significantly differ from zero except for 18F-FPSCH when using hippocampus as the reference region. Striatal SRTM BPND using midbrain or cerebellum as the reference region was significantly lower for 18F-FPSCH (range, 1.41–2.62) than for 18F-FESCH (range, 1.64–3.36). Conclusion: Dynamic PET imaging under baseline and blocking conditions determined 18F-FESCH to be the most suitable PET ligand for quantifying A2A receptor expression in the rat brain. Accurate quantification is achieved by a 60-min dynamic PET scan and the use of either cerebellum or midbrain as the reference region.
- preclinical positron emission tomography (μPET)
- cerebral adenosine A2A receptor
- 18F-SCH442416 analogs
- kinetic analysis
- rat brain
Adenosine, an extracellular endogenous signaling molecule, is released to either reduce the energy demand or increase the energy supply to a damaged or stressed organ or tissue and thereby elicits cytoprotective and neuromodulatory effects via 4 different G-protein–coupled adenosine receptors: A1, A2A, A2B, and A3 (1–5). Of these receptors, high-affinity A1 and A2A have been extensively studied because they are well characterized both pharmacologically and biochemically (6). The A1 receptor is ubiquitously present within the human brain but has high expression levels in the hippocampus, cerebral cortex, thalamic nuclei, and dorsal horn of the spinal cord. The A2A receptor is restricted to the basal ganglia and is particularly abundant in the striatum. Lower levels of A2A receptor are expressed in several brain regions, including the hippocampus, cerebral cortex, amygdala, cerebellum, brain stem, and hypothalamus (7–10).
Many studies have reported a dysregulation of A2A receptor in neuropsychiatric disorders such as Parkinson, Huntington, and Alzheimer diseases; attention deficit hyperactivity and panic disorders; schizophrenia; pain; and impaired sleep (11). Several studies have suggested that the A2A receptor may play an important role in the regulation of dopaminergic and glutamatergic neurotransmission in the basal ganglia through antagonistic interactions with the dopamine D2 receptor and by forming functional heterodimers with metabotropic glutamate receptor 5, cannabinoid receptor type 1, and the adenosine A1 receptor (12–14). PET can be used with high-affinity and selective A2A receptor antagonist radioligands to exploit changes in A2A receptor distribution and density during disease progression and to monitor the response of such changes to treatment. Furthermore, PET can be used to assess A2A receptor occupancy by investigational drugs in the human brain, thereby providing a useful tool for the drug discovery process (11).
Several PET radiotracers have been developed and evaluated for in vivo imaging of the A2A receptor in the brain (15–23). We have developed 18F-fluoroethyl and 18F-fluoropropyl analogs of 18F-labeled pyrazolo[4,3-e]-1,2,4-triazolo[1,5-c]pyrimidine (SCH442416) (18F-FESCH and 18F-FPSCH, respectively) (Fig. 1) and evaluated them in healthy rats (6). Preliminary evaluation of these tracers showed a distribution corresponding to the known regional A2A receptor densities in rat brain. Moreover, both tracers demonstrated slightly different but reversible kinetics with a decreased nonspecific binding and an increased striatum-to-cerebellum ratio compared with 11C-labeled pyrazolo[4,3-e]-1,2,4-triazolo[1,5-c]pyrimidine (11C-SCH442416). Metabolite analyses indicated the presence of hydrophilic radiometabolites, which are not expected to cross the blood–brain barrier (6).
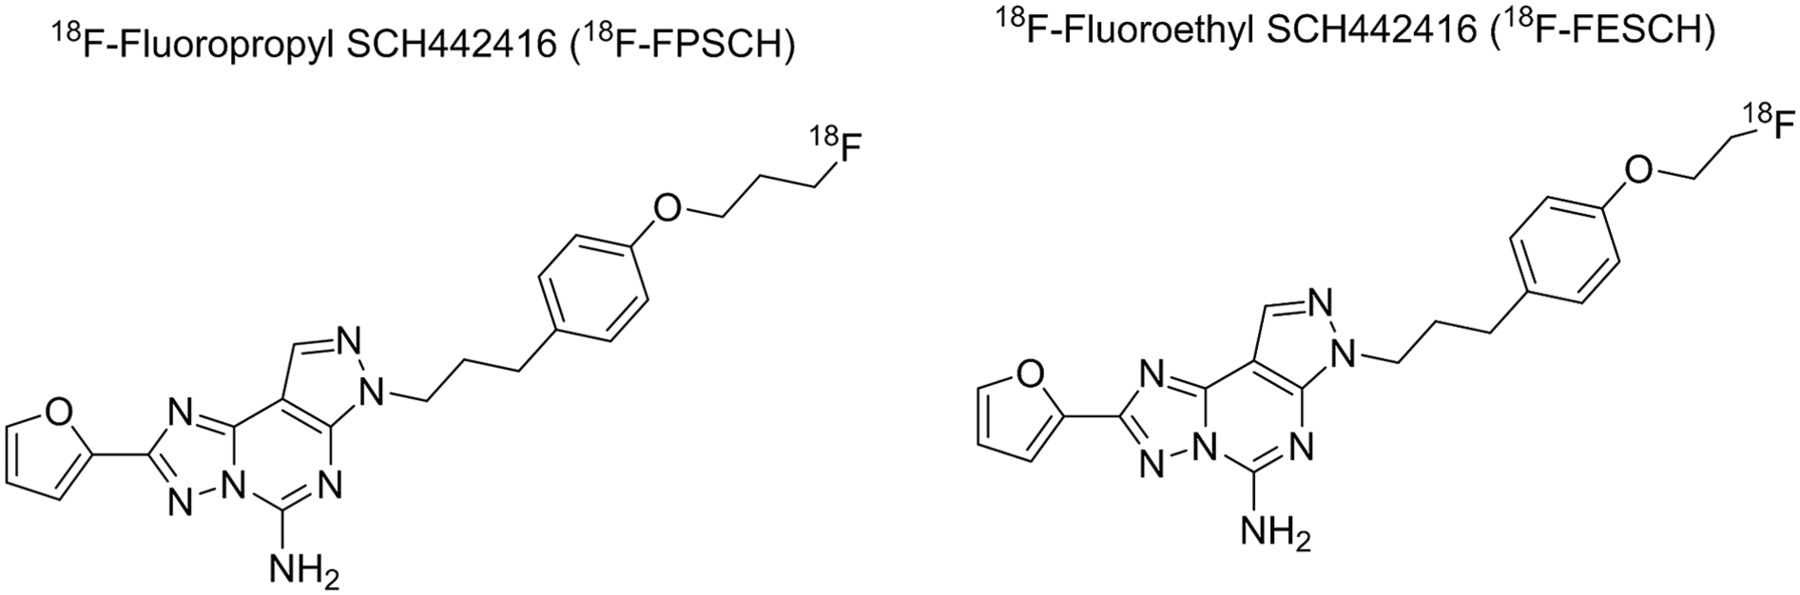
Chemical structures of 18F-labeled SCH442416 analogs.
The aim of the present study was to develop a suitable tracer kinetic model for the quantification of the cerebral A2A receptor with these radiofluorinated A2A receptor ligands, to evaluate a reference tissue approach, and to determine whether there is a reduction in acquisition time.
MATERIALS AND METHODS
General
The compounds SCH442416 and KW-6002 were purchased from Axon Medchem BV, and 1,2-ethanediol di-p-tosylate and 1,3-propanediol di-p-tosylate were acquired from Sigma-Aldrich. All other chemicals were of analytic grade; were obtained from commercial suppliers such as Fluka, Rathburn, Sigma, and Merck; and were used without further purification.
Radiosynthesis of 18F-FESCH and 18F-FPSCH
The synthesis, radiolabeling, and quality control of 18F-FESCH and 18F-FPSCH were described in detail previously (24). In brief, tracers were prepared by a 2-step 2-pot radiosynthetic method, starting with the corresponding intermediate 18F-fluorosynthons (2-18F-fluoroethyltosylate and 3-18F-fluoropropyltosylate), followed by selective fluoroalkylation of the O-desmethyl precursor.
Small-Animal PET Scanning
The animal experiments were performed by licensed investigators in compliance with the law on animal experiments of The Netherlands. The institutional animal care and use committee of the University of Groningen approved the protocols. Twenty-two male outbred Wistar-Unilever rats were included in the study design, subdivided into a control group and pretreated group for each tracer (Table 1). Five minutes before intravenous tracer administration, the pretreated animals were administered a cold A2A receptor antagonist, KW-6002 (1 mg/kg, 50% dimethyacetamide:saline [v/v]), by intraperitoneal injection to prove saturability and specific binding of the tracers in the brain (18,25). Because the median effective dose of KW-6002 in rat striatum for intraperitoneal injection is 0.044–0.062 mg/kg, as demonstrated by a dose occupancy study with 11C-preladenant, administration of a 1 mg/kg dose of KW-6002 by intraperitoneal injection is expected to fully block the A2A receptor in rat brain (23). The volume of the vehicle (solvent) was 1 mL/kg, corresponding to a volume of 0.3 mL for an average rat with a weight of 300 g. For each animal, a dynamic PET scan was acquired and reconstructed with time frames of 8 × 30, 3 × 60, 2 × 120, 2 × 180, 3 × 300, 5 × 600, 1 × 480, and 1 × 960 s. The PET data were corrected for random coincidences, scatter, and attenuation. During the scan, blood samples were drawn at 0, 5, 10, 15, 20, 30, 45, 60, 75, and 90 s and 2, 3, 5, 7, 10, 15, 30, 60, and 90 min after injection. Plasma samples taken at intervals of 2, 5, 10, 15, 30, 60, and 90 min were applied for metabolite analysis using thin-layer chromatography to determine average population-based metabolite curves separately for the control and pretreated animals.
Body Weight and Injected Dose
Male outbred Wistar-Unilever rats were obtained from Harlan. The animals were housed in Macrolon (Covestro) polycarbonate breeding cages (38 × 26 × 24 cm), maintained on a 12-h-light/12-h-dark regime, and fed standard laboratory chow (RMH-B) and water ad libitum. After arrival, the rats were allowed to acclimatize for at least 7 d. During PET imaging, all animals were anesthetized with isoflurane/medical air (inhalation anesthesia, 5% during induction, ≤2% during maintenance) and were kept on electronic heating pads during the entire study period. A femoral artery and a femoral vein were cannulated for blood sampling and tracer injection, respectively. A Harvard-style syringe pump at a speed of 1 mL/min was used for tracer injection. In addition, oxygen saturation and heart rate were measured using a pulse oximeter (Nonin) with an optical sensor attached to the hind leg. These parameters were maintained within physiologic limits by manual adjustment of the anesthesia parameters (isoflurane concentration and gas flow). In each scan session, 2 rats were scanned simultaneously (supine position) using a Focus 220 microPET camera (CTI, Siemens). The brains of both rats were placed in the field of view. Before the emission scan, a transmission scan of 515 s was obtained using a 57Co point source. The emission scan was acquired in list mode for 106 min, starting at the moment the tracer entered the body of the first rat; the second animal was injected 16 min later. Dynamic PET data were acquired in list mode and rebinned into time frames of 8 × 30, 3 × 60, 2 × 120, 2 × 180, 3 × 300, 5 × 600, 1 × 480, and 1 × 960 s, with the first rebinning starting at the injection time of the first animal and the second rebinning taking into account the delayed injection of the second animal. Time frames were reconstructed using a 2-dimensional ordered-subsets expectation-maximization algorithm (4 iterations, 16 subsets, and zoom factor of 2). The reconstructed images were smoothed with a 3-dimensional gaussian filter (1.35 mm in full width at half maximum in both directions) and split so that a separate dataset was available for each animal with the proper timings. During the dynamic PET scan, blood samples (0.1–0.15 mL) were taken from the cannulation of the femoral artery. After collecting 25 μL of whole blood, plasma (25 μL) was acquired from the remainder of the blood samples by short centrifugation (5 min at 1,000g). Radioactivity in both 25 μL of plasma and 25 μL of whole blood was counted on a γ-counter (CompuGamma 1282 CS; LKB-Wallac).
Small-Animal PET Data Analysis
Time–activity curves for the striatum, midbrain, cerebellum, and hippocampus were extracted from the dynamic PET data. Kinetic analysis was performed by fitting a 1TCM and a 2TCM to the time–activity curves using a blood- and metabolite-corrected plasma input function. Population average values were used as the input function in 2 pretreated 18F-FPSCH animals for which arterial blood sampling was not available. Besides the compartment models, a Logan graphical analysis of the PET data was performed, with the linear fit starting at 9 min after injection. For both 18F-FPSCH and 18F-FESCH, distribution volume, VT, was determined for 1TCM and 2TCM and Logan graphical analysis, and 1TCM and 2TCM fittings were compared using the Akaike information criterion.
PET data were analyzed using Inveon Research Workplace (Siemens Medical Solutions). The summed PET time frames from each animal were coregistered to an MRI template of a rat brain with predefined volumes of interest. Translation, rotation, and scaling were adjusted to visually optimize fusion of the images. Volumes of interest were transferred from the MRI template to the PET data, and tissue time–activity curves were extracted and rescaled to SUVs using measured body weight and injected dose. Compartmental models were fitted to the time–activity curves using blood- and metabolite-corrected data from arterial plasma samples and uncorrected data from whole-blood samples as input functions, with the fractional cerebral blood volume fixed to 3.6% (1). A single exponential was fitted to the parent fraction data, whereas a triple exponential was fitted to the whole blood and plasma radioactivity data. PET frames were weighted according to the frame duration and frame mid time relative to the start of the acquisition. A delay parameter describing a timing offset between tissue and blood data was fitted simultaneously with the compartment model.
Once the most appropriate compartmental model was determined, hippocampus, midbrain, and cerebellum were evaluated as reference regions by calculating the striatal distribution volume ratio minus 1 (DVR − 1) relative to each of these regions. Because blocking was expected to be complete for the pretreated animals, the DVR − 1 was not expected to differ significantly from 1. For the control group, striatal DVR − 1 was compared with nondisplaceable binding potential (BPND) using an SRTM for both a complete dynamic scan of 90 min and a dynamic scan of 60 min to assess the feasibility of reducing the acquisition time. We excluded cortical areas and brain regions close to the striatum as candidate reference regions, because such regions suffer from spillover effects from striatum-specific binding and from nonspecific tracer uptake in the Harderian glands or the skull because of possible tracer defluorination.
RESULTS
18F-FPSCH and 18F-FESCH VT
1TCM, 2TCM, and Logan graphical analysis VT data for 18F-FPSCH and 18F-FESCH in control and pretreated animals are presented in Table 2. The corresponding Akaike information criterion for 1TCM and 2TCM together with representative fits of both tracers is presented in Figure 2. For 18F-FPSCH, the 2TCM Akaike information criterion proved to be lower than the 1TCM Akaike information criterion in 11 of 48 cases, suggesting that 1TCM is the most suitable model for 18F-FPSCH. However, for 18F-FESCH, the 2TCM Akaike information criterion was lower than the corresponding one for 1TCM in 35 of 40 cases, suggesting that 2TCM is the most appropriate compartmental model for 18F-FESCH.
VT for Striatum, Hippocampus, Midbrain, and Cerebellum Using 1TCM, 2TCM, and Logan Graphical Analysis
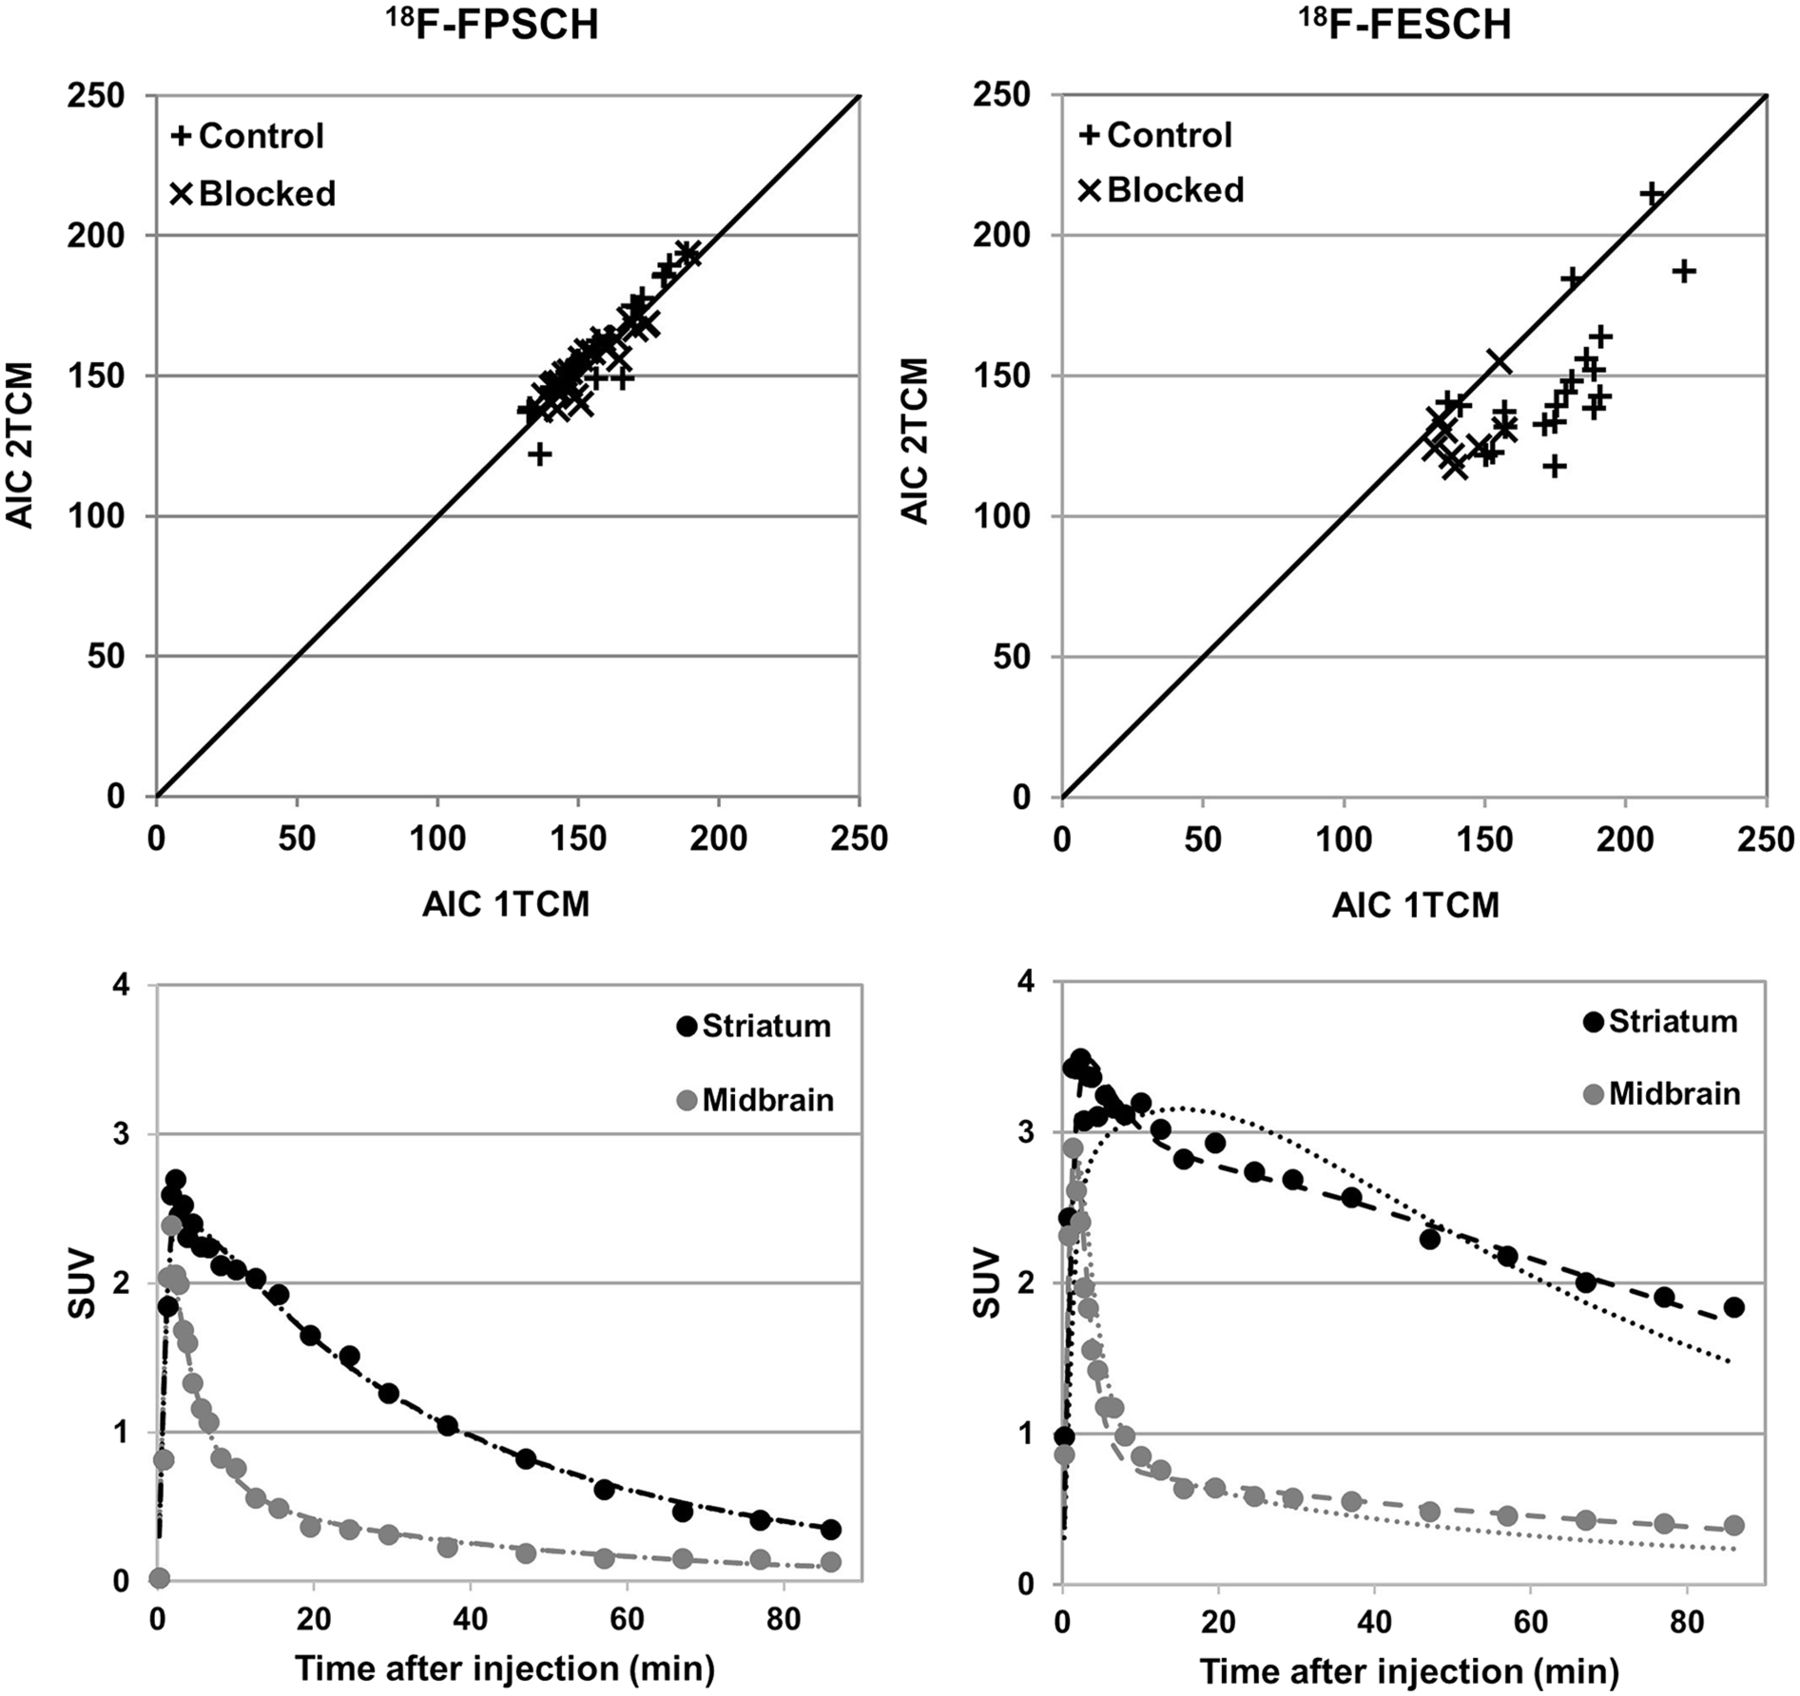
Akaike information criterion (AIC) for 1TCM and 2TCM (top) and representative 1TCM (dotted line) and 2TCM (dashed line) fitting (bottom) for 18F-FPSCH and 18F-FESCH.
18F-FPSCH
For 18F-FPSCH VT, 2-way repeated-measures ANOVA showed a significant interaction between brain region and model, with Bonferroni posttests revealing significant differences in average striatal VT between 1TCM and the Logan plot but no significant difference between average 1TCM and 2TCM VT in any brain region.
Because 1TCM is the preferred compartmental model to describe 18F-FPSCH tracer kinetics, 1TCM VT was further analyzed using 2-way repeated-measures ANOVA to determine the regional effect of pretreatment. This analysis showed a significant interaction between brain region and pretreatment, whereas Bonferroni posttests demonstrated a significant difference in average VT between control and pretreated animals for the striatum but not for hippocampus, midbrain, or cerebellum.
For the pretreated animals, the 1TCM DVR − 1 representing striatal 18F-FPSCH uptake relative to the hippocampus, midbrain, and cerebellum was, respectively, 1.10 ± 0.09, 1.04 ± 0.15, and 1.04 ± 0.11. In no case were these values significantly different from 1 (Wilcoxon signed rank test, P > 0.05).
18F-FESCH
18F-FESCH VT was analyzed using 2-way repeated-measures ANOVA. This analysis showed a significant interaction between brain region and model, with Bonferroni posttests revealing a significant difference in average VT between 1TCM and 2TCM for the hippocampus and cerebellum but no significant difference between average Logan and 2TCM VT in any brain region.
Because 2TCM is the compartmental model of choice for 18F-FESCH tracer kinetics, the effect of pretreatment on regional 2TCM VT was evaluated using 2-way repeated-measures ANOVA. This analysis showed a significant interaction between brain VOI and pretreatment, with Bonferroni posttests demonstrating a significant difference in average VT between control and pretreated animals for the striatum but not for the hippocampus, midbrain, or cerebellum.
For the pretreated animals, 2TCM DVR − 1 representing striatal 18F-FESCH uptake relative to the hippocampus, midbrain, and cerebellum was, respectively, 1.13 ± 0.20, 1.16 ± 0.43, and 1.09 ± 0.44—that is, not significantly different from 1 (Wilcoxon signed rank test, P > 0.05).
18F-FPSCH Versus 18F-FESCH
Using a nonparametric, 2-tailed Mann–Whitney test, no significant differences were found between striatal 18F-FESCH 2TCM VT (5.0 ± 2.0) and striatal 18F-FPSCH 1TCM VT (3.7 ± 1.1) in control animals (P = 0.33).
18F-FPSCH and 18F-FESCH BPND
Striatal BPND was calculated as 1TCM DVR − 1 for 18F-FPSCH and 2TCM DVR − 1 for 18F-FESCH, using the simplified reference tissue model (SRTM) and 90- and 60-min acquisitions. As the reference region, hippocampus, midbrain, and cerebellum were considered.
Control Group
SRTM BPND data for the control group are presented in Table 3. For this group, 1-way repeated-measures ANOVA (Friedman test) for each tracer and for each candidate reference region revealed no significant differences between striatal BPND calculated as DVR − 1 and striatal BPND determined using SRTM and a 90- or 60-min acquisition except for 18F-FPSCH striatal BPND using midbrain as the reference region. In that case, Dunn multiple-comparison posttesting showed a significant difference between striatal BPND calculated as 1TCM DVR − 1 and SRTM BPND determined using a 60-min rather than a 90-min acquisition.
Baseline Striatal BPND Calculated as DVR − 1 and Using SRTM with 90- and 60-Minute Scans
Again, for the control group, a Bland–Altman comparison (% difference) of 18F-FPSCH striatal BPND calculated as 1TCM DVR − 1 with striatal BPND for 18F-FPSCH using SRTM and a 90- and 60-min acquisition is presented in Table 4 for the 3 candidate reference regions. This is also presented for 18F-FESCH in Table 5, where striatal BPND calculated as 2TCM DVR − 1 is compared with SRTM BPND for a 90- and 60-min acquisition and for the different candidate reference regions. For visual assessment of agreement between the different methods, striatal BPND calculated as DVR − 1 is also plotted in Figure 3 against SRTM BPND for a 90- and 60-min acquisition for both tracers and for the different candidate reference regions.
Bland–Altman Comparison of Striatal BPND Calculated as 1TCM DVR − 1 and Using SRTM for Baseline 18F-FPSCH PET with 90- and 60-Minute Scans
Bland–Altman Comparison of Striatal BPND Calculated as 2TCM DVR − 1 and Using SRTM for Baseline 18F-FESCH PET with 90- and 60-Minute Scans

Graphical overview of striatal BPND calculated as DVR − 1 and using SRTM with 90- and 60-min scans.
Pretreated Group
For the pretreated group, the BPND of 18F-FPSCH in the striatum using SRTM and a 90- or 60-min acquisition was, respectively, 0.11 ± 0.07 and 0.12 ± 0.07 (hippocampus as reference), 0.04 ± 0.12 and 0.05 ± 0.11 (midbrain as reference), and 0.04 ± 0.10 and 0.04 ± 0.11 (cerebellum as reference). The corresponding BPND for 18F-FESCH was 0.16 ± 0.21 and 0.21 ± 0.20, 0.14 ± 0.16 and 0.16 ± 0.15, and 0.04 ± 0.28 and −0.02 ± 0.43, respectively. None of these values significantly differed from 0 (Wilcoxon signed rank test, P > 0.05) except for 18F-FPSCH SRTM BPND for 90- and 60-min acquisitions using hippocampus as the reference region.
18F-FPSCH Versus 18F-FESCH
Comparing striatal BPND calculated as 1TCM DVR − 1 for 18F-FPSCH with striatal BPND calculated as 2TCM DVR − 1 for the control group and for each candidate reference region using a nonparametric, 2-tailed Mann–Whitney test, significant differences were found for the values calculated for the midbrain and cerebellum whereas no significant difference was found for the hippocampus.
DISCUSSION
We evaluated two radiofluorinated analogs of SCH442416, 18F-FPSCH and 18F-FESCH, as ligands for PET imaging of A2A receptor expression in rat brain. On the basis of the Akaike information criterion, 1TCM was the most appropriate model for describing 18F-FPSCH kinetics whereas 2TCM was the most suitable model for 18F-FESCH kinetics. Evaluation of the different compartment models was limited to the tracer kinetics of the subcortical regions, although previous studies with A2A receptor radioligands have used the centrum semiovale (26,27) and cerebral cortex as the reference region (28,29). However, fitting of 2TCM to tracer uptake in the cortical regions and cerebellum proved problematic for the dynamic 18F-FPSCH scans because of defluorination of the 18F-FPSCH compound, resulting in an accumulation of activity in the skull and other bone structures surrounding the brain, confounding the tracer kinetics of the cortical regions and cerebellum with an irreversible component. For this reason, the standard template-based cerebellar brain volume of interest was adjusted manually to cover only the central part of the cerebellum such that these confounding spillover effects were minimized.
No significant differences were found between the striatal VT of the two tracers in control animals, although the average VT in the striatum was higher for 18F-FESCH (2TCM fit) than for 18F-FPSCH (1TCM fit). For both tracers, striatal VT calculated from a Logan plot was lower than VT calculated from a compartment model fit, although this difference was significant only for 18F-FPSCH. This observation is in line with literature data reporting that Logan plotting underestimates VT because of the impact of noise (29).
We observed a significant reduction in the striatal VT of both tracers after pretreatment. On the other hand, no significant pretreatment-induced decrease in VT occurred in the hippocampus, midbrain, or cerebellum. Moreover, the striatal DVR relative to each of these 3 regions after pretreatment was not significantly different from 1, indicating that nondisplaceable tracer binding in the striatum is identical to that in each of these 3 brain regions. These findings indicate that the hippocampus, midbrain, and cerebellum can be considered suitable candidates for a reference tissue approach to quantifying specific tracer binding in the striatum.
We evaluated SRTM for striatal BPND calculation in control animals using either hippocampus, midbrain, or cerebellum as the reference region and using 60- and 90-min dynamic PET scans. No significant differences were found between striatal SRTM BPND and DVR − 1 except for 18F-FPSCH using a 60-min scan and midbrain as the reference region. For the pretreated group, striatal SRTM BPND for 18F-FPSCH with hippocampus as the reference region differed significantly from 0 although a value of 0 had been expected since full blocking of the A2A receptor was induced by predosing (23). Moreover, for 18F-FESCH, striatal SRTM BPND with hippocampus as the reference region demonstrated a considerably increased coefficient of variation (Table 3) for the control group compared with SRTM BPND using the other brain regions as the reference region. On the basis of these findings, we conclude that midbrain and cerebellum are the reference regions of choice for SRTM BPND estimation of 18F-FPSCH and 18F-FESCH uptake in the rat brain. Selecting cerebellum as the reference region for SRTM BPND quantification of striatal uptake of an A2A receptor–specific PET ligand is also supported by other PET studies (15,19,20,31).
A Bland–Altman analysis comparing striatal SRTM BPND with DVR − 1 for 18F-FPSCH (Table 4) and for 18F-FESCH (Table 5) using both 90- and 60-min dynamic PET data demonstrated that both brain regions perform similarly in terms of bias and 95% confidence interval. The scanning time can be reduced to 60 min with a limited increase in bias and 95% confidence interval. For a reduced scanning time of 60 min, cerebellum appeared to perform slightly better as a reference region for 18F-FPSCH quantification, whereas midbrain had the smallest bias and 95% confidence interval for 18F-FESCH quantification. This Bland–Altman analysis also proves that SRTM provides an accurate BPND for specific striatal 18F-FESCH uptake (Table 5) although 2TCM is the most appropriate compartmental model for tracer 18F-FESCH kinetics in both the striatum and candidate reference regions and SRTM assumes 1TCM tracer kinetics in both reference and target tissue. However, literature data have shown that if the compartmental models of reference and target tissue are matched, the bias induced by SRTM is minimal (32,33).
Other A2A receptor–specific PET ligands that have been developed are 18F-MNI-444, 11C-TMSX, 11C-KW-6002, 11C-SCH442416, and 11C-preladenant (16,23–26,28,30,34). Except for 18F-MNI-444 and 11C-preladenant, A2A receptor quantification using these tracers is challenging because of the low specific-to-nonspecific binding ratio or high extrastriatal binding. 18F-MNI-444 was tested in rhesus monkeys and humans and demonstrated good brain penetration, with the BPND ranging from 2.6 to 4.9 in A2A receptor–rich regions (15,16). On the other hand, 11C-preladenant has a striatal BPND of around 5.5 and fast tracer kinetics such that a 60-min acquisition is sufficient for accurate A2A receptor quantification in rat brain. However, 11C-labeled PET tracers have some intrinsic disadvantages due to the short half-life. On the other hand, 18F-FPSCH and 18F-FESCH are fluorinated compounds, therefore providing more flexibility in terms of imaging, and have demonstrated tracer kinetics similar to those of 11C-preladenant, with a BPND of around 2.5. Comparing 18F-FPSCH and 18F-FESCH, striatal SRTM BPND using either midbrain or cerebellum as the reference region proved to be significantly lower for 18F-FPSCH than for 18F-FESCH. Taking into account this finding and the Bland–Altman analysis demonstrating the smaller bias for 18F-FESCH than for 18F-FPSCH for a 60-min scan, 18F-FESCH is preferred over 18F-FPSCH for PET imaging of A2A receptor expression in the rat brain. However, for translation into a clinical setting, the presented metabolite results and optimal compartmental models need to be reevaluated for 18F-FESCH brain uptake in humans, because of possible interspecies differences in tracer kinetics and metabolism. Because the cerebellum demonstrated low to negligible A2A receptor density in autoradiography experiments with human brain tissue (35), previous studies with A2A receptor–specific radiotracers in humans have used cerebellum as a reference region (16). This reference tissue approach could also be considered for the quantification of 18F-FESCH in a clinical setting, thus avoiding the need for arterial sampling and metabolite analysis.
CONCLUSION
We evaluated two radiofluorinated analogs of SCH442416, 18F-FPSCH and 18F-FESCH, as PET ligands for imaging A2A receptor expression in rat brain. Full kinetic analysis using arterial blood sampling indicated 1TCM and 2TCM to be the most suitable models for 18F-FPSCH and 18F-FESCH, respectively. Dynamic PET imaging under baseline and full blocking conditions determined 18F-FESCH to be the most suitable PET ligand for quantifying A2A receptor expression in the rat brain. Accurate quantification of striatum-specific binding is achieved by a 60-min dynamic PET scan and SRTM with either cerebellum or midbrain as the reference region.
DISCLOSURE
No potential conflict of interest relevant to this article was reported.
Acknowledgments
We thank Jurgen Sijbesma, Mohammed A. Khayum, and Soumen Paul for their technical assistance.
Footnotes
Published online Oct. 27, 2016.
- © 2017 by the Society of Nuclear Medicine and Molecular Imaging.
REFERENCES
- Received for publication May 11, 2016.
- Accepted for publication October 2, 2016.


Jump to section
Related Articles
Cited By...
- No citing articles found.