


Abstract
PET studies of cerebral neuroreceptors are often recorded over periods ranging from 1 to 2 h, and head movements during the studies not only lead to blurred images but also may seriously disturb the kinetic analysis. We report the effect of motion on parametric images of the distribution volume ratio (DVR), as well as possible improvements if the dynamic PET data are corrected for head movements. Methods: The study was performed with the 5-hydroxytryptamine 2A receptor ligand 18F-altanserin. During PET scanning, which was performed in list mode for 1 h, the position of the head was monitored by an infrared motion-tracking system. The list mode data were sorted into time frames of between 10 s and 2 min. Motion was corrected using the multiple-acquisition-frame (MAF) approach, which calculates individual attenuation files for each emission frame and its corresponding head position to avoid misalignment of transmission and emission data. After reconstruction of attenuation-corrected emission frames, each image frame was realigned to match the head position of the first frame of the emission scan. The resulting motion-corrected dynamic images were evaluated using the noninvasive Logan plot to obtain parametric images of DVR. Results: DVR images of motion-affected 18F-altanserin scans showed artifacts whose extent depended on the amount of movement. The artifacts were mainly at the border between gray matter and white matter and at the outer border of gray matter. They were seen as discontinuities and small spots whose values exceeded the expected DVR values or were even negative and that disappeared when motion correction was applied. These effects in human data were also seen on simulated 18F-altanserin images that contained no statistical noise. Conclusion: Whereas the native PET images looked just blurred if the patient moved during the PET scan, parametric images of the Logan DVR, which are calculated by pixelwise linear regression, contained severe discontinuities primarily at the cortical edge. MAF-based motion correction was able to avoid these errors.
Head motion during PET brain imaging, which may last between several minutes and 2 or 3 h, is a well-known reason for blurred images and may lead to misinterpretation and even uselessness of the recorded data. With increasing image resolution of PET, this problem becomes even more important. One way to reduce head motion is to restrain the head during the PET scan by a support such as an individually molded cushion (1), by a thermoplastic mask (2), or even by a stereotactic device (3). Such solutions are often not applicable or do not prevent all motion. Consequently, several procedures to correct the recorded motion-affected PET data have been suggested and implemented (4–8). Recently, the multiple-acquisition-frame (MAF) method (5) as implemented by Fulton et al. (7) became available in our PET laboratory. The advantages of motion correction of long dynamic PET acquisitions as demonstrated by Bloomfield et al. (8) became clear when time–activity curves obtained in neuroreceptor studies were examined and used for further kinetic analysis. It is obvious that time–activity curves can be distorted by head movements so that the outcome of a compartmental analysis will be erroneous. Compared with classic compartmental analysis, with its nonlinear fitting methods, linearized or graphic analyses such as the Patlak plot (9) or the Logan plot (10) are less susceptible to statistical noise in the PET data (11). It is not, however, clear how the linearized models behave if the PET recording is accompanied by head movements. This work analyzed the influence of head motion and its correction on parametric images calculated pixel by pixel with the help of linearized models. We looked at dynamic PET scans recorded after injection of the serotonergic 5-hydroxytryptamine 2A (5-HT2A) receptor ligand 18F-altanserin. Using these data with and without motion correction and the noninvasive approach of Logan et al. (12), we calculated and compared parametric images of the distribution volume ratio (DVR), which is related to the binding potential (BP) by BP = DVR − 1.
MATERIALS AND METHODS
The PET data were recorded during a study of serotonergic 5-HT2A receptors for which 18F-altanserin was administered to healthy volunteers (13). Using the Siemens/CTI HR+ PET scanner, transmission scans were performed for 10 min to allow for measured attenuation correction. After intravenous bolus injection of about 200 MBq of 18F-altanserin, PET emission data were acquired and stored in list mode for 1 h. During this scan, the position of the subject’s head was monitored with a Polaris optical tracking system (Northern Digital). The tracking system emits infrared light, which is reflected by 3 small markers attached to the subject’s head with the help of goggles and detected by the Polaris system. The Polaris system, combined with software that was developed earlier, measures the position and orientation of the subject’s head in the scanner coordinate system at 1-s intervals (7,14).
We examined the 6 PET measurements in which head movements were monitored by the tracking system. Before image reconstruction, the list mode data were sorted into a sequence of 42 frames, which contained counts summed over 6 × 10 s, 4 × 15 s, 2 × 30 s, 3 × 1 min, and 27 × 2 min. The use of relatively short frames even at times when the radiotracer concentration is slowly varying allows for the correction of head movements, provided they are not too fast. The mean position of the subject’s head during each frame was determined by evaluating the Polaris data. Motion was corrected using the MAF procedure (5), which was previously implemented and described by Fulton et al. (7). The first step of this procedure was the reconstruction of a 3-dimensional (3D) attenuation map using the transmission data and the daily blank scan. For each of the 42 emission frames, translations and rotations derived from Polaris data were used to reorient the 3D attenuation map and adjust it to the position of the subject’s head. By this step, misalignments between emission and transmission data were minimized. It was assumed that the healthy subjects did not move from the beginning of the transmission scan to the end of the first emission scan. Each of the 42 emission sinograms was reconstructed, including normalization and corrections for attenuation, scattered radiation, dead time, and radioactive decay. The 42 3D image volumes containing 63 planes of 128 × 128 pixels were individually motion corrected, so that their new position matched the position of the first frame of the emission sequence. Finally, the 42 image frames were assembled into a single file with the ECAT7 format (Siemens) for dynamic studies.
The uncorrected image data were processed with the same procedure, with the exception that the elements of all motion transformation matrices used in the MAF approach were 0.
In addition to the human data, 1 set of dynamic PET noise-free images of 18F-altanserin was simulated. By comparing noise-free dynamic image sequences without and with motion and the resulting parametric images, we were attempting to confirm that the observed artifacts were introduced by motion between reconstructed images and not by statistical noise. First, representative time–activity curves of gray matter, white matter, striatum, thalamus, and cerebellum were derived from a dynamic 18F-altanserin scan that had been recorded for a healthy volunteer who had not moved during scanning. Second, using Zubal’s computerized phantom (15), we created a realistic brain image volume with homogeneous areas of gray matter, white matter, striatum, thalamus, and cerebellum. Then, we constructed a file with dynamic image volumes by defining 42 image frames with the same timing scheme as described above and by copying the brain phantom into each frame. At this step, the segmented areas of each frame were weighted with their corresponding time–activity data obtained in the first step. Finally, the image volumes were smoothed with a 3D-gaussian filter with a full width at half maximum of 5 mm in all 3 dimensions to achieve a PET-like image resolution. Afterward, motion was introduced into these artificial 18F-altanserin image data, resulting in datasets SM1 (simulated and moved), SM2, SM3, and SM4. In the case of SM1, just 1 sudden movement with a caudad z-shift of 5 mm and a rotation of 5° around the z-axis was introduced after 30 min. The same movements were homogeneously distributed during the 60-min scan for dataset SM2. Dataset SM3 was obtained by applying smaller movements at 30 min with a caudad z-shift of 2 mm and a rotation of 2° around the z-axis. In the case of SM4, the same movements occurred gradually over 60 min. We report motions in and around only the z-axis. Equivalent simulations involving the other axes gave similar results and not reported here.
The measured radioactivity images—with and without motion correction—as well as the simulated images were converted into parametric images of the DVR according to the noninvasive Logan plot approach (12):
 Eq. 1
Eq. 1
INT is the intercept of the linear fit to the Logan plot. T ranges from the time of the first frame to that of the last (42nd) frame. In the calculation of parametric images, cROI(t) is the time–activity curve of each single image pixel and cREF(t) the time–activity curve of the receptor-poor reference region. The noninvasive Logan plot was chosen as a representative linearized calculation of parametric images because it is widely used to estimate the BP of neuroceptor ligands. In the case of 18F-altanserin, the outcome of the DVR calculation has been shown to correlate well with that of nonlinear analyses (16). To show that the motion-related artifacts do not appear solely in the noninvasive Logan plot but arise generally in graphically calculated parametric images, we tested the outcome of the classic (invasive) Logan plot (10),
 Eq. 2 with the data of subject E and the outcome of the noninvasive Ichise plot (version MRTM2) (17),
 Eq. 3 with the data of subject D. To study the classic Logan plot, which yields the distribution volume (DV), we applied as the input function the plasma radioactivity curve cPlasma(t) obtained in subject D and corrected for metabolized tracer, instead of the cerebellar time–activity curve. The Ichise plot according to Equation 3 delivers the parameters γ1 and γ2, from which the BP is derived by BP = −(γ1/γ2 + 1). k2′ denotes the average tissue-to-plasma efflux constant (17).
The calculations of Equations 1–3 were done with the PXMOD tool, which is a part of the software package PMOD (18) (version 2.55; PMOD Technologies Ltd.).
The Logan DVR plot needs cREF(t), the time–activity curve of a reference region, for which the cerebellum was chosen. In addition, the preprocessing step of the PXMOD software requires a time–activity curve cRICH(t) of a receptor-rich volume of interest (VOI), which was defined over the cortex in several planes at the level of the basal ganglia. Using cRICH(t) and cREF(t), the preprocessing step calculates a Logan plot and determines the time at which the plot starts to be linear. This time is used in the pixelwise calculation. The VOIs from which the time–activity curves were derived were independently defined on both the corrected and uncorrected image data. These image data represented images summed from 0 to 60 min after tracer injection.
To examine the occurrence of the artifacts in the motion-affected data in more detail, we looked at the level of single pixels. For this purpose, we chose the simulated noise-free dynamic 18F-altanserin scan into which gradual head motion (SM2) had been introduced. Time–activity curves were defined for 11 adjacent single pixels located at gray matter, at white matter, and at the border between gray matter and white matter (Fig. 7A). These data and, alternatively, the corresponding unmoved data were used to calculate the classic Logan plot (Eq. 2). The Logan plot was graphically fitted with the PKIN tool of the software package PMOD. The metabolite-corrected plasma curve of subject D was used as input function. In this way, just the pixels at the border of gray matter and white matter were analyzed, without considering a reference region that might also have been disturbed by motion. Because data without any statistical noise were used, the DV values yielded by the linear regression were dependent exclusively on the different tissue types of the single pixels and their motion-induced alterations.
RESULTS
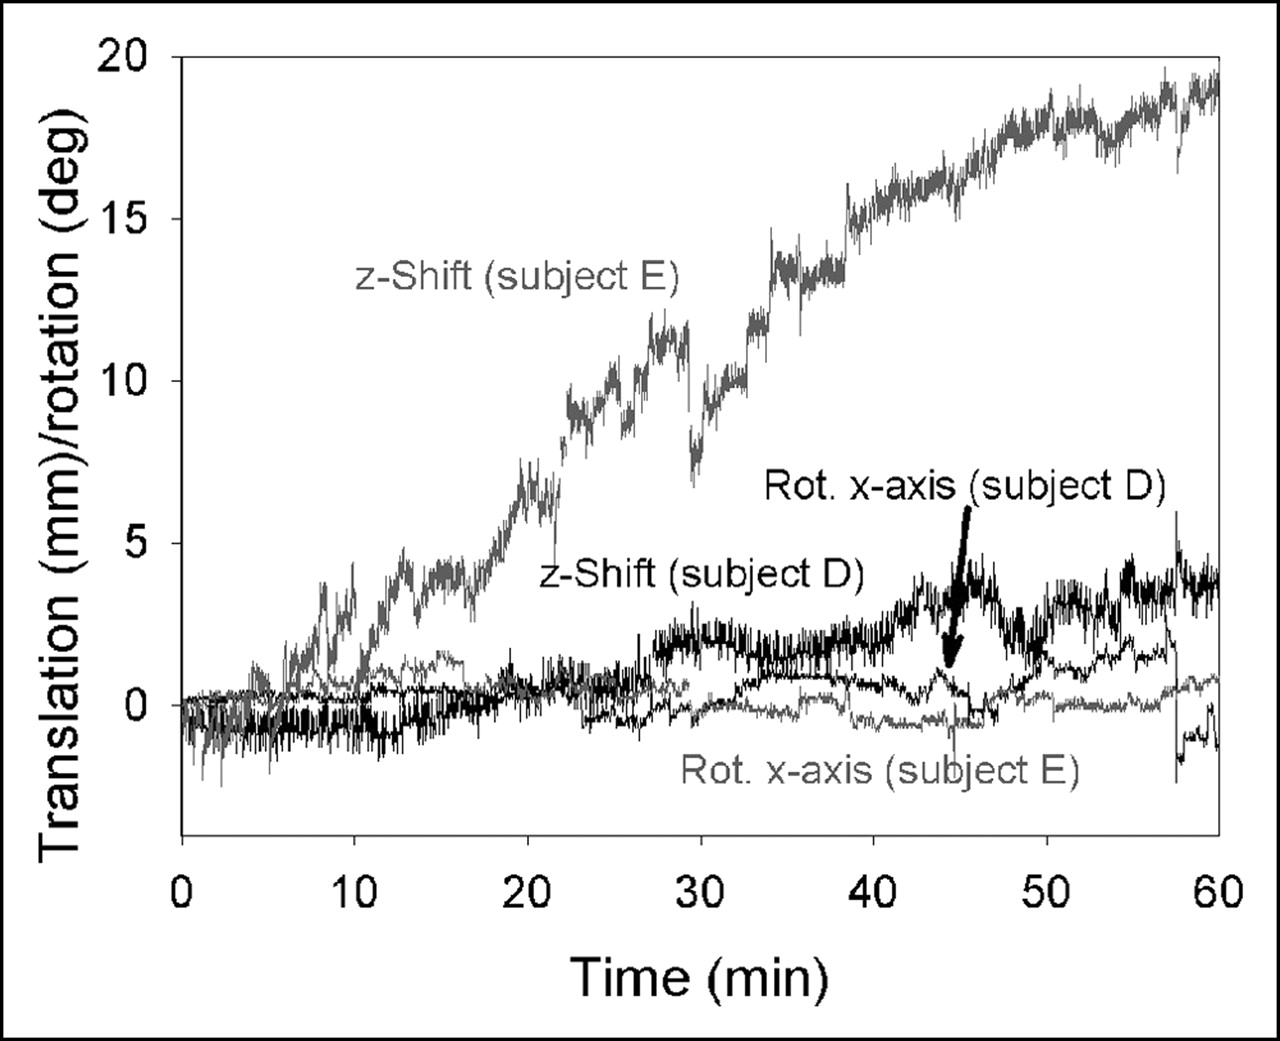
The maximum translations and rotations in the 60-min Polaris records of the study subjects are summarized in Table 1. The primary direction affected by the movement was the z-axis (subject axis). Some subjects tended to move toward their feet. In subject E, this shift was about 2 cm (Fig. 1), leading to considerable blurring of the summed image (Fig. 2). Some of the head movements occurred suddenly—sometimes followed by a quick return into the old position, sometimes staying in the new position. Other motions, such as those in Figure 1, showed a continuous trend with superimposed rapid movements.

Motion recordings of subject D (black) and subject E (gray) with 2 different extents of z-shift. Movements become worse at end of scan. Rot. = rotation around.
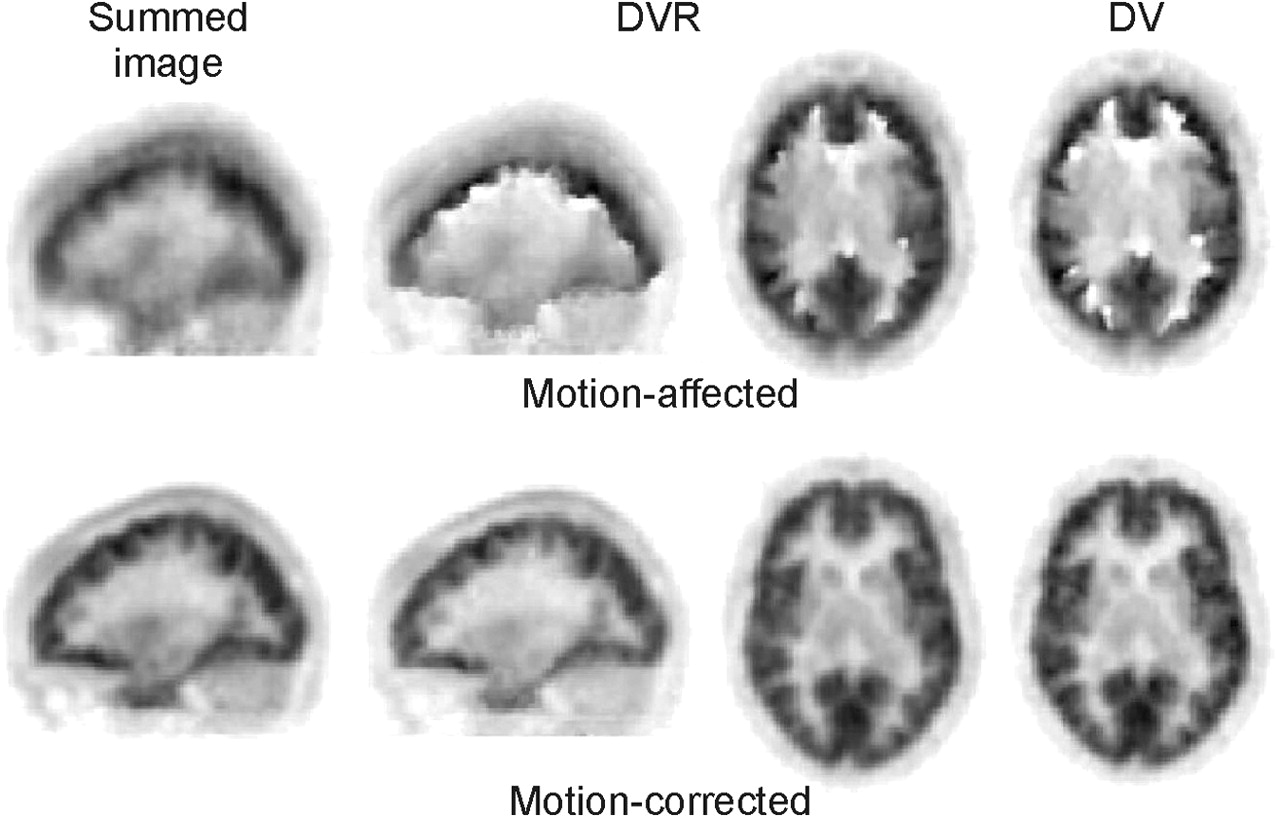
Summed images (sagittal view, 60 min) of cerebral distribution of 18F-altanserin in subject E before and after motion correction, corresponding DVR images in sagittal and transverse orientations, and DV images in transverse view.
Maximum Translations and Rotations
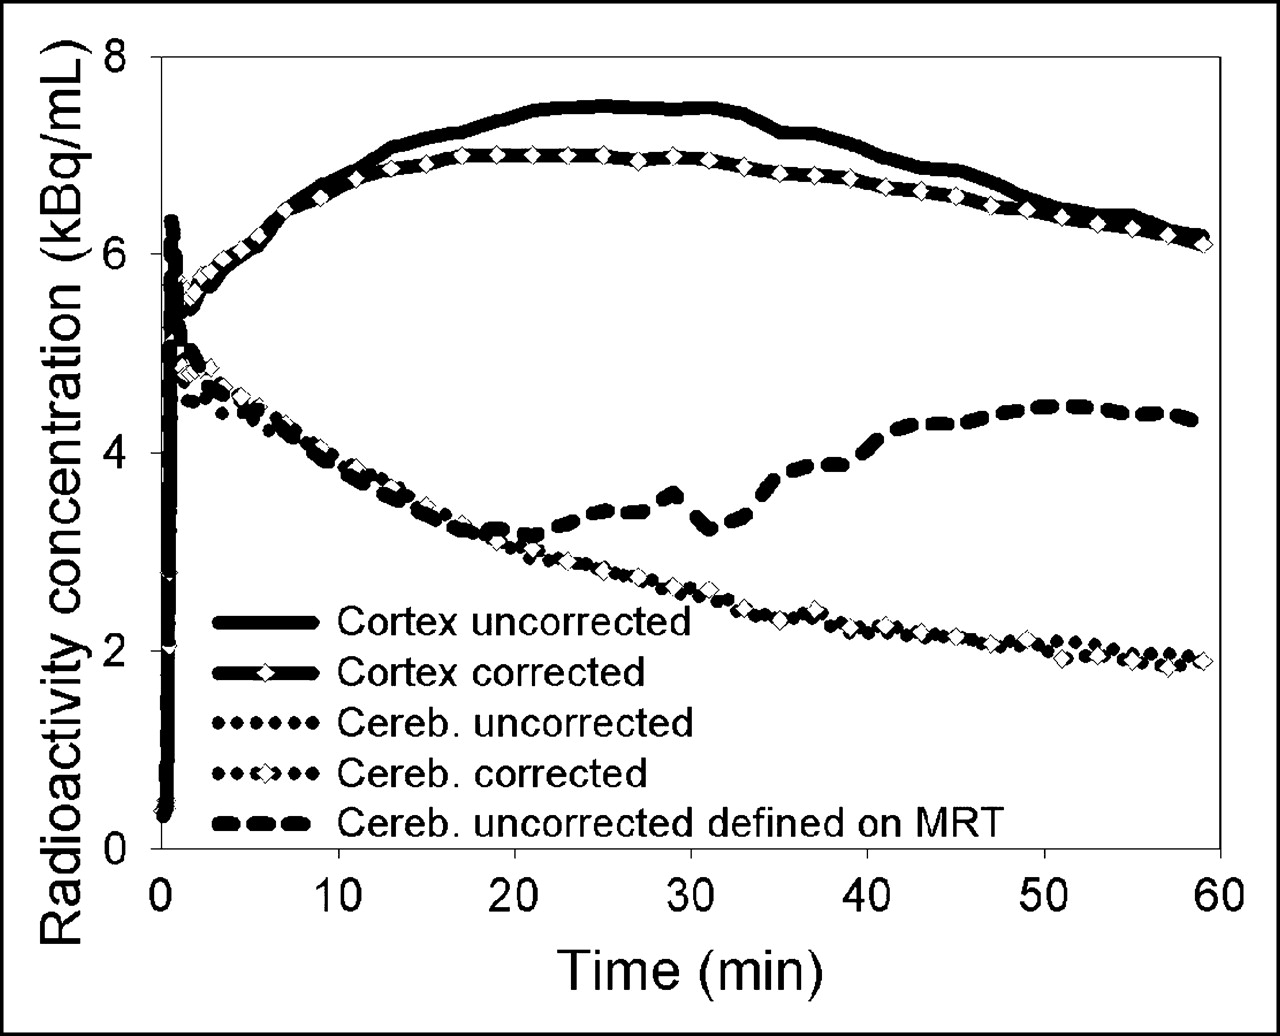
As demonstrated in Figure 2, the MAF method was able to correct for rather large movements (in this case, up to 20 mm). When time–activity curves were derived from large cortical and cerebellar VOIs that had been defined on summed images of the uncorrected and corrected data, the cortical time–activity curves showed considerable differences between uncorrected and corrected data whereas the cerebellar time–activity curves were quite similar (Fig. 3). However, when the cerebellar VOI was defined on an MRI tomogram that had been registered to the transmission scan, the cerebellar time–activity curve of the motion-affected data revealed a heavy distortion that was due to the cortical pixels included in its late data.

Cortical and cerebellar (cereb.) time–activity curves for subject E before and after motion correction. The different cerebellar time–activity curves were obtained by defining their VOIs in 2 different ways, as described in the text.
Calculation of DVR images from dynamic 18F-altanserin image data not corrected for motion caused artifacts that exhibited discontinuities especially at the borderline of the cortex—that is, between the outer cortical surface and the cerebrospinal fluid (CSF)—as well as at the border between gray matter and white matter. In the case of subject E, this phenomenon was observed at the border between gray matter and white matter (Fig. 2, middle). Similar discontinuities were found at the outer cortical surface toward the CSF. With smaller movements, such as those seen in subject D, with a z-shift of up to 4–5 mm, the artifacts become less pronounced but were still visible as, for example, white and black spots at the edge from gray matter to white matter (Fig. 4A). Even more artifacts became visible when BP images were calculated with the noninvasive Ichise plot (Fig. 4C). In this subject cranially located BP images (not shown here) exhibited even the scalp. When the 2 graphic analyses were applied to motion-corrected data, all artifacts disappeared and a continuous change from gray matter to white matter was seen (Figs. 4B and 4D). The scalp was no longer visible on the cranial BP images.
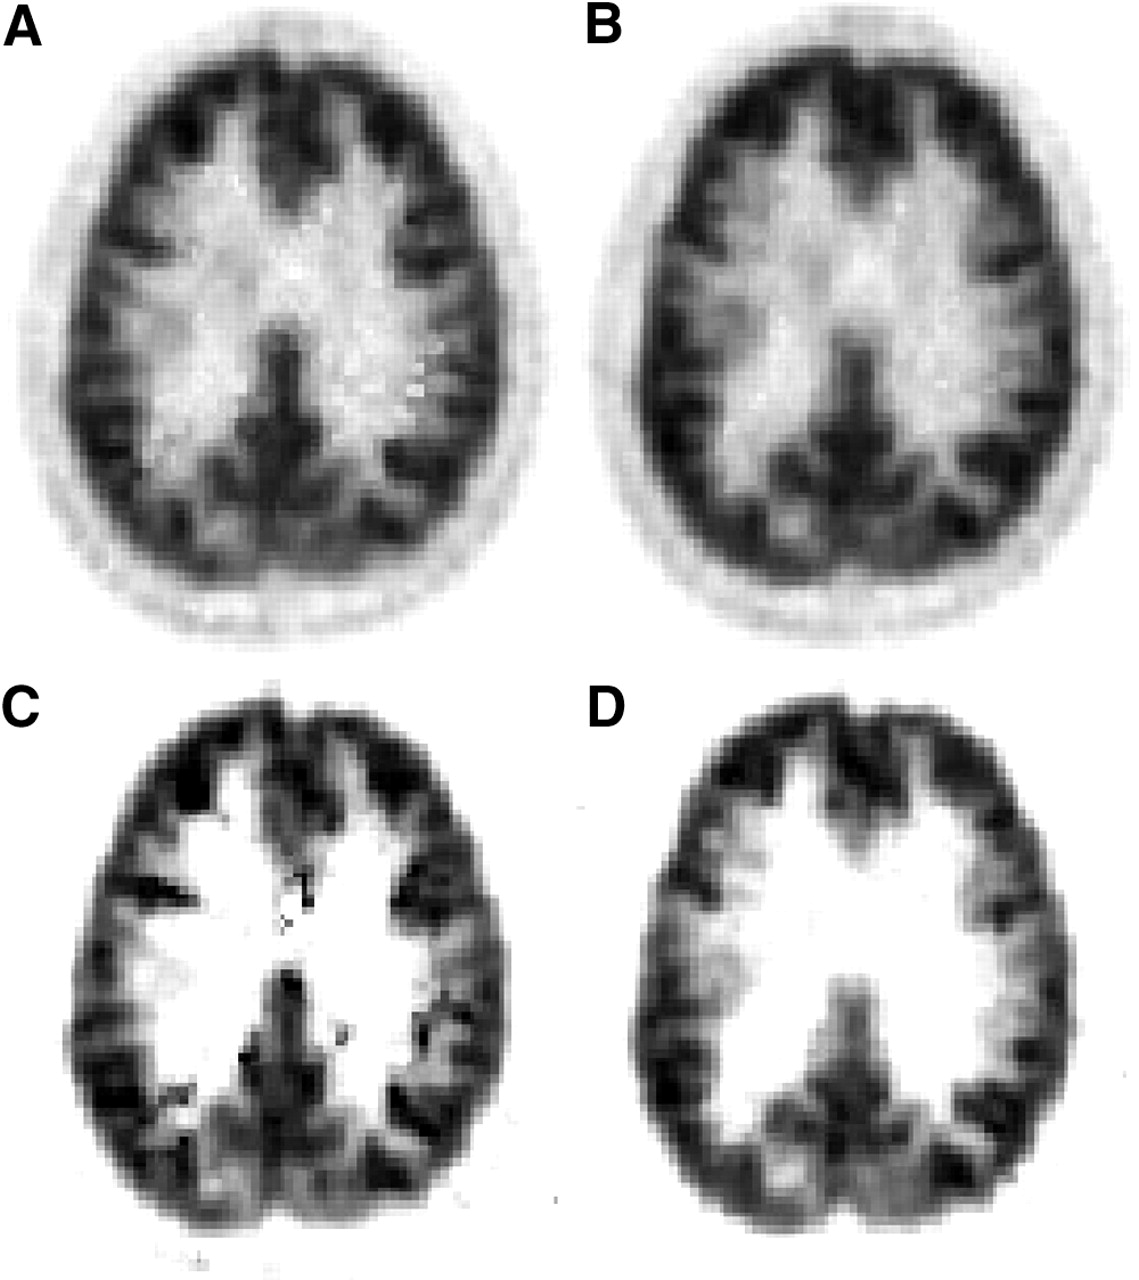
DVR (A and B) and BP (C and D) images obtained via noninvasive Logan plot and noninvasive Ichise-MRTM2 plot, respectively, before (A and C) and after (B and D) motion correction. These data were measured in subject D.
In measurements in which the movements were in the range of the pixel size (2 mm) or less, only subtle differences between DVR images with and without motion correction could be found. However, as demonstrated in Figure 5, head motion resulted in single spots and discontinuities at the edge between gray matter and white matter and at the outer border of gray matter. In this case, profiles clarified the difference between motion-uncorrected and -corrected data. As documented by the profiles of Figure 5C at y ≈ 120 mm and Figure 5D at z ≈ 40 mm, for example, single spots and sharp gradients disappeared after motion correction.
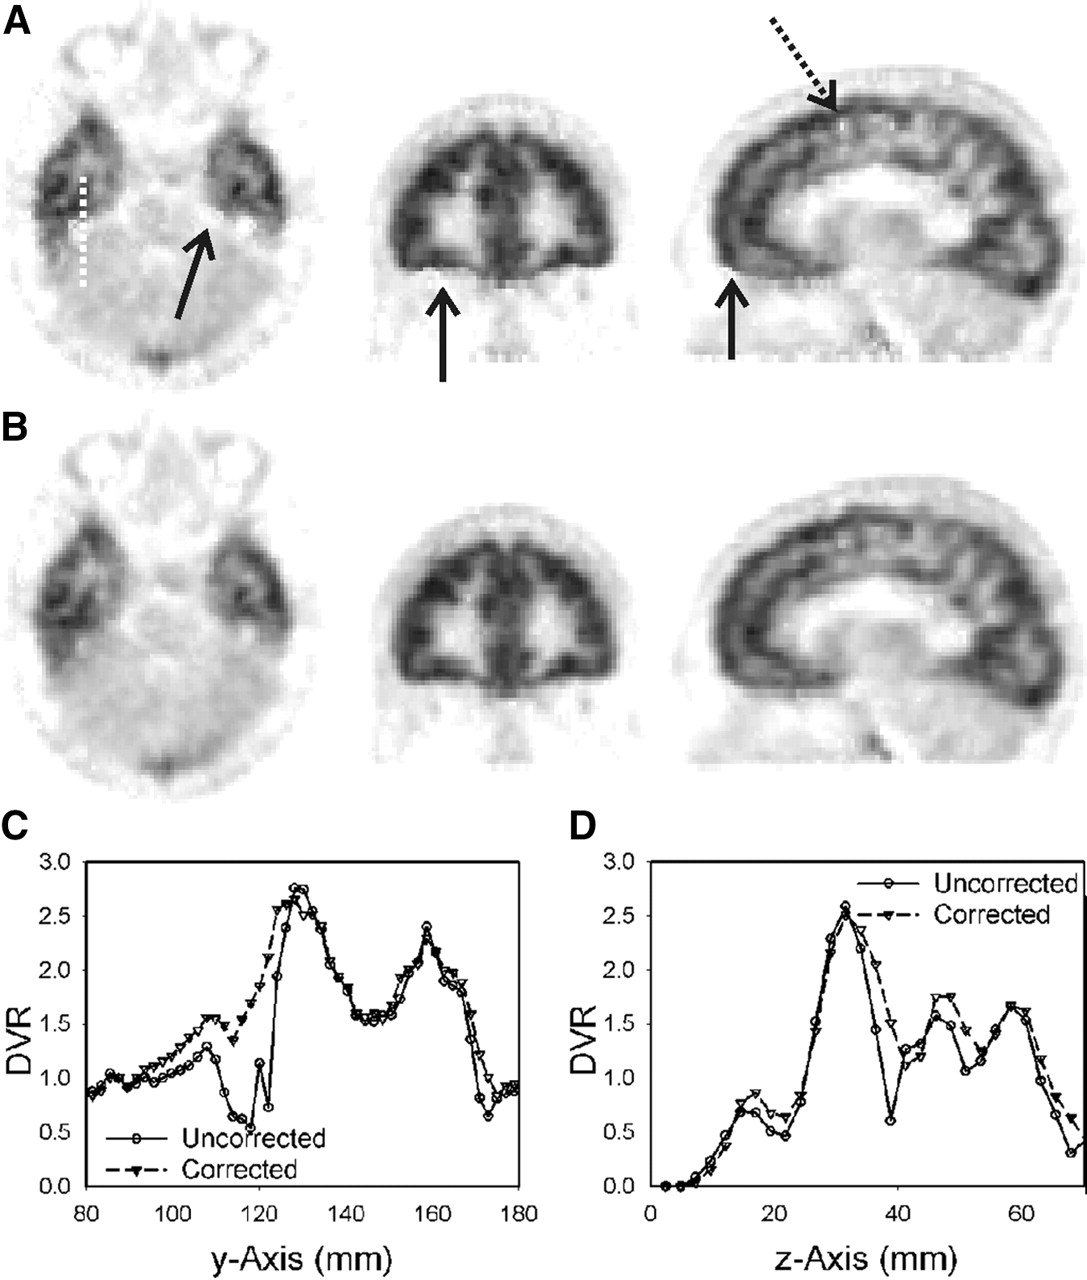
(A and B) Comparison of DVR images in subject A before (A) and after (B) motion correction. Discontinuities and single spots in uncorrected data are indicated by arrows. On corrected images, gradual changes are found where artifacts are visible in uncorrected data. (C) Profiles belonging to dotted white line crossing temporal lobe. (D) Profiles crossing single light spot, which is indicated by dotted arrow, in vertical direction.
The parametric images investigated thus far were calculated by noninvasive approaches so that all data—that is, voxels within the brain as well as voxels within the reference tissue cerebellum—were prone to head motion. To exclude a possible influence by a distorted time–activity curve of the cerebellum (Fig. 3), the data of subject E, with his 20-mm z-shift, were also analyzed with the invasive Logan plot technique for which the metabolite-corrected plasma curve was used as input function. Again, considerable artifacts could be seen on the DV image if no motion correction was applied. They disappeared with motion correction (Fig. 2, right column).
When examining dynamic simulated noise-free 18F-altanserin data into which movements such as those of subjects A and D had been introduced, we found artifacts with discontinuities at the border of tissue types similar to those observed in the real data (Fig. 6). For conditions SM1 to SM3 (Figs. 6B to 6D), there were artifacts at the edge between gray matter and white matter. When condition SM4 was applied, pixelated artifacts became present at the outer cortical outline (Fig. 6E).

DVR images based on simulated dynamic 18F-altanserin study free from counting-rate noise: motion-free data (A); data with motion conditions SM1 (B), SM2 (C), SM3 (D), and SM4 (E).
Logan plot analysis of adjacent single pixels ranging from gray matter to white matter, which were obtained from motion-unaffected and motion-affected simulated noise-free 18F-altanserin image sequences, confirmed the presence of the discontinuities observed on the complete images. Time–activity curves from the motion-unaffected data showed a continuous change from gray matter to white matter (Fig. 7B). The motion-affected time–activity curves, especially those at the border between gray matter and white matter, exhibited distortions such as atypical increases in the second part of the curves. Consequently, the Logan plots of motion-affected time–activity curves yielded erroneous DV values that were too high (compared with the motion-unaffected data) or even negative (Fig. 7C).
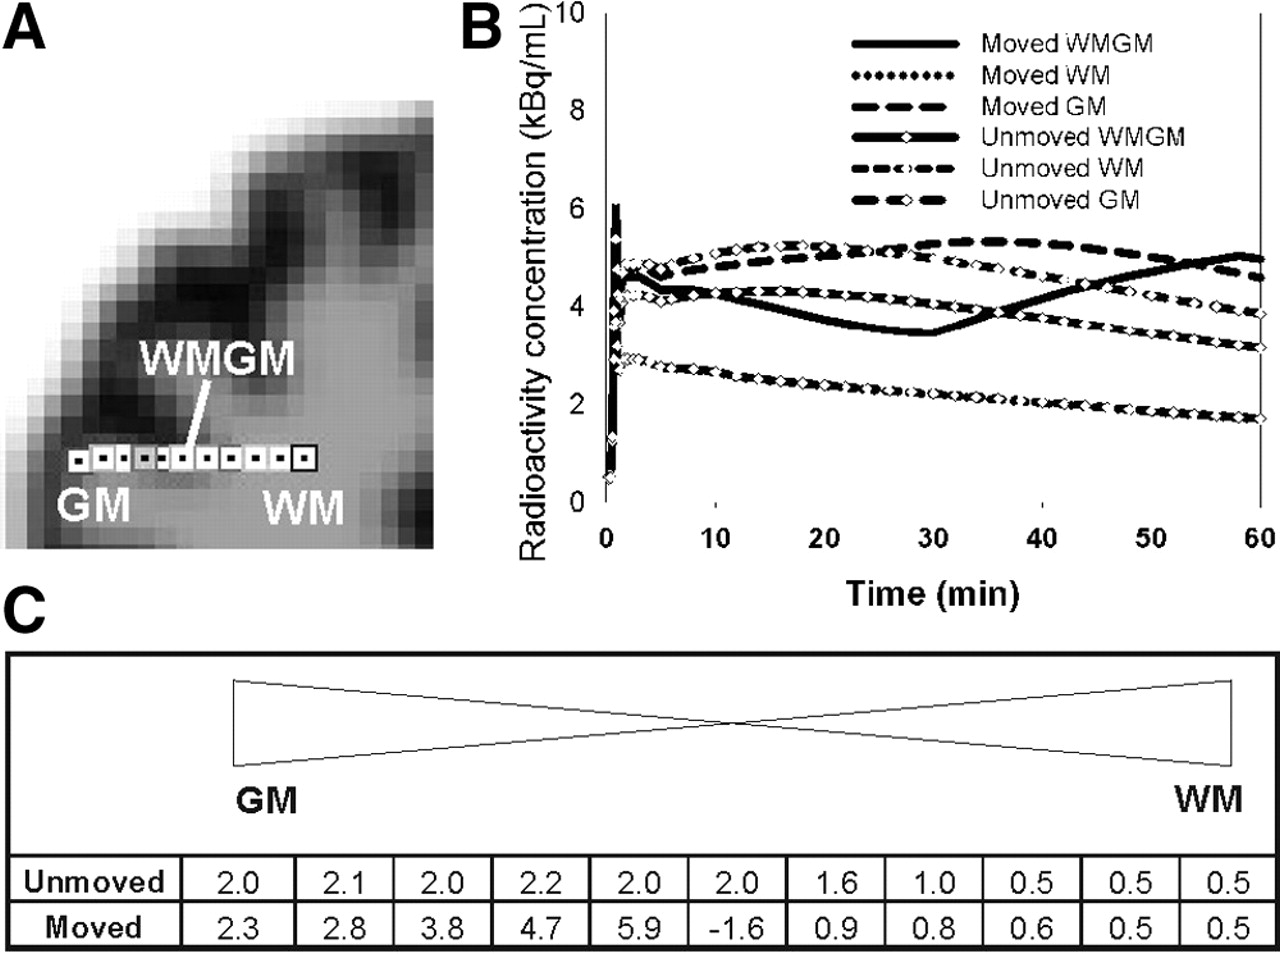
(A and B) Single voxels defined in brain area ranging from gray matter (GM) to white matter (WM) (A) and corresponding time–activity curves (B) of GM, WM, and mixed tissue (WMGM) voxels superimposed on simulated dynamic 18F-altanserin images with and without motion. Time–activity curves of WM for data with and without motion overlap completely. (C) DV values resulting from Logan plot analysis of time–activity curves for data with and without motion.
DISCUSSION
Graphic or linearized approaches are widely applied in the analysis of dynamic PET data to estimate parameters such as BP in neuroreceptor studies. There is an ongoing discussion that graphic analysis is prone to statistical noise in the recorded data, and suggestions have been made to reduce the influence of this noise and to avoid the bias caused by it (11,19–21). In a recent investigation of serotonergic receptor binding with 18F-altanserin, we observed on the DVR images small spots that were first explained by the presence of noise in the recorded radioactivity (13). In some of these studies, we had the opportunity to track movements of the subject’s head during PET scanning and to test the newly implemented MAF correction for head movements. The discontinuities present on parametric images of uncorrected data were removed after motion correction. The discontinuities were detected especially at the border of 2 different types of tissue: between gray matter and white matter and at the border between brain tissue and CSF. These observations for real data that had been affected by motion of different extents (Figs. 2, 4, and 5) could be confirmed with simulated data free of statistical noise. Looking at the DVR images (Fig. 6) as well as at the outcome of the DV plots (Fig. 7), both of which were based on simulated motion-affected data, one can see that the change of image voxels from one tissue to another during PET scanning leads to the same spots and discontinuities as found on the DVR images of subjects who moved their heads during the PET measurement.
The normal continuous change of DVR values from one tissue type to another is in agreement with the limited image resolution of PET. The BP of 18F-altanserin is about 1 in the cortex (16) and decreases to 0 in the white matter. At the border between cortex and white matter, the limited image resolution and the accompanying partial-volume effect produce heterogeneous tissue with values of BP gradually changing from high to low. When head motion occurs, white matter may become present at image voxels that included gray matter before the motion, and vice versa. In this way, the data fed into the linear equation used in the graphic DVR calculation contain sudden or gradual changes, especially of the term cROI(t), that are related directly to temporal changes of the reconstructed radioactivity. When image voxels are not fixed to a single tissue but comprise different tissues during the scanning time, the graphic approach yields plots with nonlinear behavior also in the part of the plot that would be expected to be linear. The attempt to apply linear regression to such a plot may result in erroneous values—possibly too high or even negative—as also shown in Figure 7.
With the MAF method, movement during a frame cannot be corrected. Therefore, for accurate motion correction, the dynamic PET scan should consist of short time frames. In our study, the maximum frame duration was 2 min, resulting in a dynamic PET scan of 42 frames. This may be sufficient if the movements are not too rapid. However, rapid movements within a frame cannot be corrected. Consequently, residual image blurring will be present, and summed images will not be of optimum quality. This problem should only slightly affect the linearized calculation of parametric images, because the MAF approach is able to correct for long-term trends in head motion. Residual motion errors averaged over a single time frame will lead to minor cROI(t) errors similar in effect to statistical errors. The statistical errors are known to cause a possible bias but do not invalidate the outcome.
Errors due to the limited time resolution of the MAF method may be reduced by using shorter time frames of 1 min or less. Another solution may be motion correction based directly on lines of response (LOR) (8,22,23). Such motion correction introduces the problem of count losses, especially if the patient’s head rotates around a transversal (x or y) axis. Although the count losses may be corrected (i.e., scaled) by appropriate normalizing factors, such correction cannot counterbalance the loss of statistical accuracy. Further studies should examine the pros and cons of the MAF and LOR methods and their different influences on the calculation of parametric images.
CONCLUSION
The recording of head motion using a motion-tracking device such as the Polaris system and markers attached to the patient’s head, together with the use of correction software, has proved to be a convenient way to correct for head motion. This technique is able to improve the quality of brain PET considerably and to avoid errors in the calculation of parametric images by graphic methods.
Acknowledgments
We cordially remember our coauthor Kay Bente, who passed away unexpectedly some weeks after the submission of the manuscript. Kay’s contribution was most valuable for the simulations that helped us verify and understand data measured in humans. We appreciate the radiosynthesis of 18F-altanserin by the Institute of Nuclear Chemistry. We thank Elisabeth Theelen and Suzanne Schaden for their excellent technical assistance.
Footnotes
Received Oct. 13, 2004; revision accepted Jan. 27, 2005.
For correspondence or reprints contact: Hans Herzog, PhD, Institute of Medicine, Forschungszentrum Juelich, D-52425 Juelich, Germany.
E-mail: h.herzog{at}fz-juelich.de
↵† Deceased.
REFERENCES
In this issue


Jump to section
Related Articles
Cited By...
- Validation and Evaluation of a Vendor-Provided Head Motion Correction Algorithm on the uMI Panorama PET/CT System
- Assessment of Motion Bias on the Detection of Dopamine Response to Challenge
- An Efficient Approach to Perform MR-Assisted PET Data Optimization in Simultaneous PET/MR Neuroimaging Studies
- Test-Retest Reliability of the SERT Imaging Agent 11C-HOMADAM in Healthy Humans
- PET/MRI for Neurologic Applications
- Methods for Motion Correction Evaluation Using 18F-FDG Human Brain Scans on a High-Resolution PET Scanner
- Effect of Patient Arm Motion in Whole-Body PET/CT
- MRI-Assisted PET Motion Correction for Neurologic Studies in an Integrated MR-PET Scanner
- Establishment of In Vivo Brain Imaging Method in Conscious Mice
- Movement Correction Method for Human Brain PET Images: Application to Quantitative Analysis of Dynamic 18F-FDDNP Scans
- Correction of Head Movement on PET Studies: Comparison of Methods