


Abstract
Head motion is difficult to avoid in long PET studies, degrading the image quality and offsetting the benefit of using a high-resolution scanner. As a potential solution in an integrated MR-PET scanner, the simultaneously acquired MRI data can be used for motion tracking. In this work, a novel algorithm for data processing and rigid-body motion correction (MC) for the MRI-compatible BrainPET prototype scanner is described, and proof-of-principle phantom and human studies are presented. Methods: To account for motion, the PET prompt and random coincidences and sensitivity data for postnormalization were processed in the line-of-response (LOR) space according to the MRI-derived motion estimates. The processing time on the standard BrainPET workstation is approximately 16 s for each motion estimate. After rebinning in the sinogram space, the motion corrected data were summed, and the PET volume was reconstructed using the attenuation and scatter sinograms in the reference position. The accuracy of the MC algorithm was first tested using a Hoffman phantom. Next, human volunteer studies were performed, and motion estimates were obtained using 2 high-temporal-resolution MRI-based motion-tracking techniques. Results: After accounting for the misalignment between the 2 scanners, perfectly coregistered MRI and PET volumes were reproducibly obtained. The MRI output gates inserted into the PET list-mode allow the temporal correlation of the 2 datasets within 0.2 ms. The Hoffman phantom volume reconstructed by processing the PET data in the LOR space was similar to the one obtained by processing the data using the standard methods and applying the MC in the image space, demonstrating the quantitative accuracy of the procedure. In human volunteer studies, motion estimates were obtained from echo planar imaging and cloverleaf navigator sequences every 3 s and 20 ms, respectively. Motion-deblurred PET images, with excellent delineation of specific brain structures, were obtained using these 2 MRI-based estimates. Conclusion: An MRI-based MC algorithm was implemented for an integrated MR-PET scanner. High-temporal-resolution MRI-derived motion estimates (obtained while simultaneously acquiring anatomic or functional MRI data) can be used for PET MC. An MRI-based MC method has the potential to improve PET image quality, increasing its reliability, reproducibility, and quantitative accuracy, and to benefit many neurologic applications.
Simultaneous MR-PET data acquisition (1) permits temporal correlation of the signals from the 2 modalities, opening up opportunities impossible to realize using sequentially acquired data. One such example is using the MRI information for PET data motion correction (MC). Typically, subject motion is difficult to avoid and can lead to degradation (blurring) of PET images and severe artifacts when motion has large amplitude. In the case of neurologic PET studies performed using stand-alone PET scanners, efforts have been made to minimize these effects using different techniques to restrain the subject's head, but these methods have had limited success (2,3). Alternatively, methods to correct for head movements have been investigated (4–12), and comprehensive reviews on this topic have been published (13,14). The simplest technique consists of realigning individual frames to a reference position and summing them to create a single volume. In a variation of this method, video cameras have been used to monitor the motion of the head and a new frame started each time motion above a set threshold was detected (4). Such image-based methods allow a frame-by-frame correction to be implemented but do not account for motion within the predefined frame. Furthermore, low statistics images obtained from short-duration frames are sometimes used, making the coregistration less accurate.
A more sophisticated MC method consisted of obtaining more detailed motion estimates using external monitors to track the motion of sensors placed on the subject's head. For example, it was demonstrated that it is possible to perform head MC using the Polaris optical tracking system (5–8) combined with the line-of-response (LOR) rebinning algorithm (15). In this algorithm, an LOR is transformed using the rigid-body transformation provided externally and rebinned into sinogram space. In these implementations, the LOR data were normalized before rebinning (i.e., prenormalization). However, postnormalization can also be performed (16), but this requires the estimation of motion-corrected time-weighted normalization (17). List-mode reconstruction can be performed by combining the optical motion-tracking method with list-mode data acquisition (7). Although this combined method has the potential of producing the most accurate results, the estimation of the sensitivity image through sampling is not trivial (18). Additionally, the precision of the optical tracking methods is limited by the residual freedom of the reflectors positioned on the subject's head. A promising technique to address this problem uses video cameras and structured light to observe a portion of the patient's face (12). However, all these methods require the optical sensors to have an unobstructed view from outside the scanner, which is not feasible on an integrated MR-PET scanner because of the presence of the radiofrequency coils.
In a combined MR-PET scanner, the MRI data acquired simultaneously with the PET data could be used to derive high-temporal-resolution motion estimates, eliminating the need for an optical tracking system. In this work, rigid-body MRI-assisted MC was demonstrated on an integrated MR-PET scanner. First, an implementation of an MC algorithm based on the LOR rebinning method and using postnormalization was proposed. Next, the quantitative accuracy of the proposed method was compared with image-based MC in phantom experiments. Finally, proof-of-principle studies in human volunteers were performed.
MATERIALS AND METHODS
Integrated MR-PET Scanner
PET Scanner Geometry.
The BrainPET prototype is a dedicated brain scanner that can be operated inside the bore of the Siemens MAGNETOM 3-T MRI scanner, a total-imaging-matrix system. Briefly, there are 32 detector cassettes that make up the PET gantry, each consisting of 6 detector blocks (Fig. 1). Each detector block consists of a 12 × 12 array of lutetium oxyorthosilicate crystals (2.5 × 2.5 × 20 mm) with a readout by magnetic field–insensitive avalanche photodiodes. To minimize the potential for interference with the MRI system, each cassette was individually shielded. Because of the geometric constraints and limitations in the number of electronic channels provided by the QuickSilver architecture (i.e., maximum 192 channels) (19), there were 6-mm gaps between adjacent heads in the same ring. Additionally, there were 2.5-mm gaps between the blocks in the same cassette.
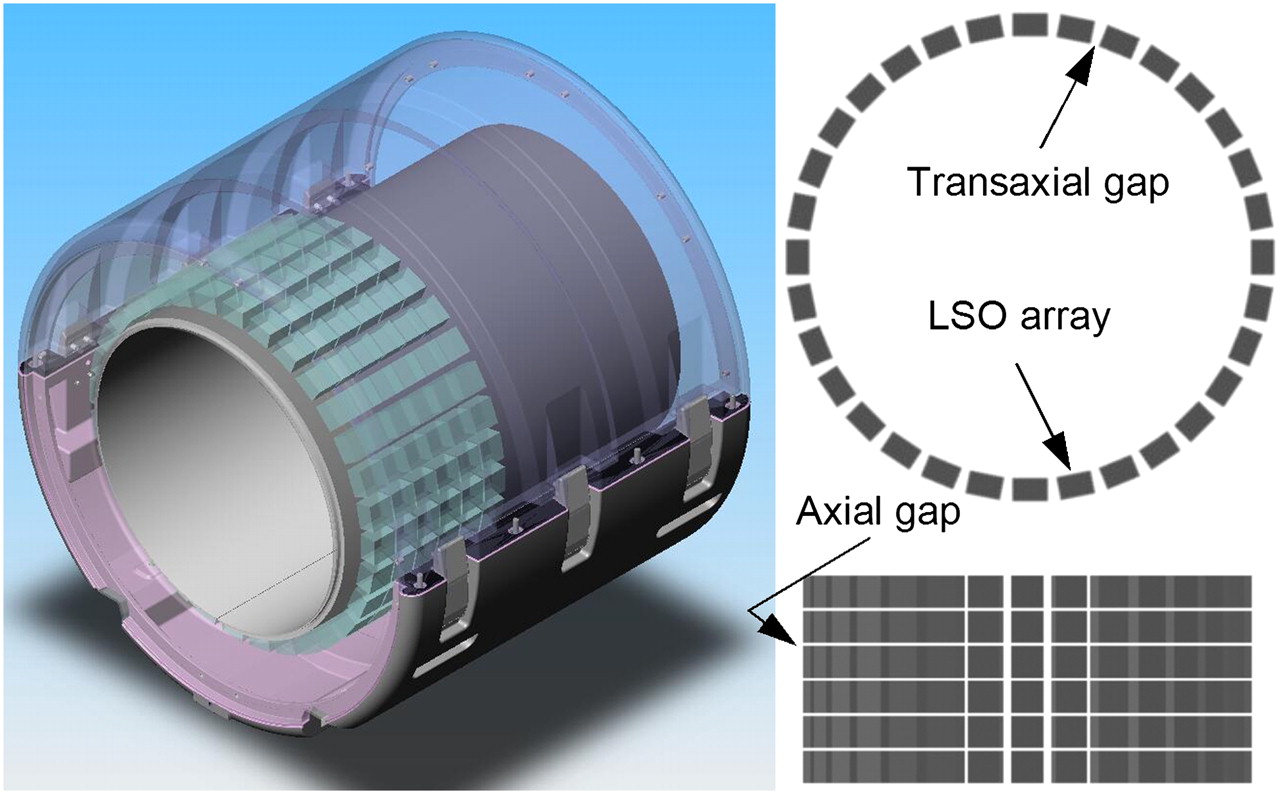
3D rendering of BrainPET scanner (left) shows placement of detector blocks inside gantry. Transaxial (upper right) and axial (lower right) sections illustrate gaps between LSO arrays. LSO = lutetium oxyorthosilicate.
Data-Processing Workflow Without Motion Correction.
Coincidence event data were acquired and stored in list-mode format. Each 48-bit event contained the addresses of the 2 crystals in which the annihilation photons were detected. The LOR joining these 2 crystals was positioned in the 3-dimensional (3D) space, using the physical coordinates of the crystals. LOR were rebinned into sinogram space using nearest-neighbor approximation and axial compression (span, 9; maximum ring difference, 67). In such a discrete remapping, more than one LOR is sent to a sinogram bin. To account for this, the sinogram sampling density, called dwell (DW) hereafter, is calculated by applying the same rebinning algorithm to an LOR dataset filled with 1 count per LOR. A look-up table, which contains the sinogram addresses for all LORs, was precalculated to speed up the rebinning. The sinogram space consisted of 1,399 sinograms; because of axial compression, the space was organized in 15 segments. Each sinogram consisted of 192 angular projections and 256 radial elements. A set of sinograms—prompt and random coincidences—was obtained after data rebinning. The calculation of random coincidences was performed, sorting the delayed coincidences into delayed single maps from which the total singles rate and the variance-reduced randoms were estimated (20).
The sensitivity data were acquired with a plane source scanned in 16 positions (with a 22.5° angular step), at 4 h per position. Each position provided the sensitivity for the LORs that were the most perpendicular (±11.25°) to the plane source, and the overall sensitivity (LORS) was obtained by combining these files. The normalization was obtained from the LORS sorted into the sinogram space and from the DW sinogram, using the following procedure. First, the sensitivity sinogram was divided by the DW sinogram, and the resulting sinogram was scaled by dividing it by the mean of the nonzero values. Next, to control the noise propagation in the reconstruction, the bins with low sensitivity (i.e., <0.1) were discarded, and the thresholded sensitivity was multiplied by the DW. Finally, the normalization sinogram was obtained by taking the inverse of the nonzero elements of this sinogram.
The head attenuation map (μ-map) was obtained using a recently implemented MRI-based attenuation-correction method (21). The scatter sinogram was obtained using a calculated method based on the single scatter estimation method (22). The implementation has been revisited for improving the speed, allowing a full 3D calculation (Inki Hong, private written communication, September 16, 2009).
The images were reconstructed with the ordinary Poisson ordered-subset expectation maximization 3D algorithm from prompt and expected random coincidence, normalization, attenuation, and scatter coincidence sinograms using 16 subsets and 6 iterations (23). The reconstructed volume consisted of 153 slices with 256 × 256 pixels (1.25 × 1.25 × 1.25 mm).
Data-Processing Workflow with Motion Correction.
The list-mode dataset was divided into n frames (LMFi, i = 1,n) of variable duration (Δti) according to the desired pharmacokinetic protocol. MC was subsequently applied separately for each of these frames. The head position at the beginning of the acquisition is usually set as the reference position for the whole study. Assuming there are k motion estimates available during LMFi, this frame was divided into k subframes (LMFij, j = 1,k). Rigid-body spatial transformation matrices (Tij) to the reference position for all these subframes and frame durations (Δtij) were obtained from the MRI data. The list-mode frames LMFij were histogrammed into the corresponding LOR files (LORFij). The motion was accounted for in the LOR space by moving the coordinates of all crystals based on Tij. Specifically, it is applied to the physical coordinates of the 2 crystals defining each individual LOR, and 2 points that define a new line (LORcorr) were obtained. After this step, LORcorr was rebinned into sinogram space, generating prompt (SPij_corr) and random (SRij_corr) sinograms. A subframe-specific DW (SDWij_corr) was also calculated to account for the different sampling density after application of the spatial transformation. Because the radiofrequency coil was stationary with respect to the scanner, its attenuation (LORC) cannot simply be combined with the subject's head attenuation anymore and instead was combined with the sensitivity in the LOR space (i.e., LORSC = LORS × LORC). Tij was then applied to LORSC to obtain the subframe-specific sensitivity sinogram (SSCij_corr). The processing time for a subframe is currently approximately 16 s on the BrainPET workstation (Xeon X5355 [Intel]; 2.66-GHz quad processor, 16-GB RAM).
The emission data from all the subframes were combined to obtain the corrected prompt and random coincidence sinograms (i.e., SPi_corr = Σ SPij_corr and SRi_corr = Σ SPRij_corr). Time-weighted sensitivity (SSCi_corr = ΣΔtij × SSCij_corr) and DW (SDWi_corr = ΣΔtij × SDWij_corr) sinograms were generated and used to create the frame-specific normalization sinogram (SNi_corr). The head attenuation (SAref) and scatter correction (SScatref) sinograms were estimated only in the reference frame. The motion-corrected PET volume was reconstructed from these sinograms (i.e., SPi_corr, SRi_corr, SNi_corr, SAref, and SScatref) using the standard 3D ordinary Poisson ordered-subset expectation maximization algorithm.
MRI Motion Tracking.
One MRI-based motion-tracking method is to repeatedly acquire anatomic data during the PET data acquisition and then coregister the individual MRI volumes to obtain the motion estimates. The disadvantage, however, is that motion estimates with a temporal resolution in the minute range are obtained depending on the MRI sequence acquisition time and they do not allow for intraframe MC. Furthermore, this method cannot be used for sequences that do not provide anatomic information (e.g., MRI spectroscopy).
Another method for tracking the motion is the one already implemented on the Siemens Trio scanner—prospective acquisition correction (24). This method requires the collection of an echo planar imaging (EPI) series and tracking of prospective real-time motion by registration of each volume with the first in the series. Thus, EPI-derived motion estimates are obtained every time a complete volume is acquired, and these motion estimates could be made available to the PET reconstruction algorithm.
Motion-tracking information during high-resolution anatomic imaging with MRI can also be obtained using embedded cloverleaf navigators (CLNs), as we have previously demonstrated (25). Briefly, a CLN (duration < 4 ms) is inserted every repetition time (TR) of a 3D-encoded fast low-angle shot (FLASH) sequence, providing an estimate of the rigid-body transformation between the current position of the object relative to an initial k-space map (this map is acquired at the beginning of the scan in 12 s). These motion estimates are used by the MRI system to compensate for motion in real time. A log file containing all the transformations is produced.
These methods are suitable for tracking the head rigid-body motion and were used in this work.
MRI and PET Data Correlation
Despite the simultaneous acquisition, the PET and MRI data acquired with the BrainPET were not correlated by default, and 2 issues had to be addressed: the spatial coregistration of the 2 volumes and the temporal correlation of the 2 signals.
Spatial Correlation.
The spatial misregistration between the PET and MRI volumes comes from the fact that, due to physical limitations, the center of the PET scanner field of view (FOV) does not precisely coincide with the magnet's isocenter. Furthermore, the axial FOVs are not identical, and the MRI slices can be prescribed in any orientation. Acquiring isotropic 3D MRI data in the transversal orientation solves all these limitations, with the exception of the spatial mismatch issue. A solution to the spatial mismatch problem is to obtain a transformation matrix (TMRI→PET) by scanning a structured phantom visible on both PET and MRI scans. A Derenzo 20-cm-diameter phantom with holes ranging from 2.5 to 6 mm was filled with 50 MBq of 18F-FDG, and PET and MRI data were acquired simultaneously. The 2 volumes were coregistered based on mutual information using the Vinci software package (26). The experiment was repeated 6 times after the phantom was repositioned inside the scanner.
The MRI and PET scanners’ device coordinate systems follow the same rules for defining the orientations of and the rotations along each of the 3 orthogonal axes, and these same rules have been adopted in this work. PET and MR images are both presented using the radiologic convention.
Temporal Correlation.
On this prototype scanner, no clock synchronization between the 2 systems was implemented, and PET and MRI data were acquired independently under the control of different computers. Therefore, a synchronization method was implemented by inserting MRI output triggers into the PET list-mode data every time a motion estimate was obtained. Time marks normally inserted into the PET list-mode data every 0.2 ms were used to time stamp these MRI trigger events. Thirty-two different gates can be encoded, and a mechanism that allowed the manual switching between the inputs on which the gates were inserted (e.g., each time a new sequence started, a different trigger was inserted) was implemented.
To verify that all the trigger events were recorded, the following experiments were performed. First, a pulse generator was used to create trigger signals, and PET list-mode data were acquired with a 68Ge line source. The events were recorded for different pulse frequencies and acquisition times. As a next step, triggers were obtained directly from the MRI scanner. Because the MRI output signal was narrower (i.e., 10 μs) than the signal expected by the BrainPET, a signal stretcher was built. List-mode data were acquired with the line source and an MRI-visible phantom. The number of trigger events recorded was analyzed for various sequences, acquisition times, and TRs.
Hoffman Phantom Studies
A Hoffman phantom filled with approximately 50 MBq of 18F-FDG was used to acquire MRI and PET data simultaneously in 5 positions. A multiecho magnetization-prepared rapid-acquisition gradient echo (ME-MPRAGE) sequence was used to acquire data in each case. The first frame was set as the reference, and the other 4 MRI volumes were coregistered to it using mutual information (26). These transformations were used to correct exactly the same PET data both in the LOR and in the image space. In the first case, the procedure outlined in the “Data-Processing Workflow with Motion Correction” section was followed. The μ-map in the reference position was created by assuming uniform linear attenuation coefficients throughout the phantom volume (i.e., 0.096 cm−1). In the second case, the 5 PET volumes were reconstructed using the standard procedure. The μ-maps for these positions were obtained from the reference μ-map by applying the inverse transformations. Subsequently, the reconstructed PET volumes were moved back to the reference position and summed in image space. A PET volume uncorrected for motion was also reconstructed from all the data summed in the sinogram space. The 2 MC methods were compared by analyzing horizontal profiles drawn on representative images and average activity in volumes of interest.
Human Volunteer Studies
For testing the MC algorithm in a more realistic situation, 2 human volunteers were recruited to undergo combined MR-PET brain examinations. As per our approved Institutional Review Board protocol, the subjects injected with approximately 185 MBq of 18F-FDG were scanned for approximately 90 min. After an uptake period of approximately 25 min, the functional MRI and CLN sequences were each run for approximately 15 min, and the subjects were asked to move their heads 4 times in each case. Anatomic data were collected in between these acquisitions. PET and MRI data were acquired simultaneously throughout the scan.
EPI-Derived Motion Estimates.
The prospective acquisition-correction sequence provides motion estimates in the MRI reference frame (TMRI) every 3 s. To derive the estimates in the PET reference frame (TPET), the first individual MRI volume was transformed to account for the spatial mismatch, and then the subsequent volumes were retrospectively coregistered. In this way, the motion estimates were obtained directly in the PET reference frame. Each of the 300 subframes was processed using these estimates, and a corrected volume was reconstructed. Additionally, the data were reconstructed without MC.
CLN-Derived Motion Estimates.
A series of motion estimates with a sample rate of 50 Hz was obtained. However, 50 of these estimates were averaged and used for correcting the corresponding 900 1-s PET subframes. The problem of correcting for multiple receive radiofrequency coil elements for the navigator was circumvented by receiving the navigator signal using the birdcage while collecting the image information from the 8-channel receive array.
The motion-corrected and uncorrected volumes were quantitatively compared. For this purpose, the list-mode data were divided into 4 consecutive 3-min frames. These data were then processed with and without MC, and the corresponding 8 volumes were reconstructed. Brain structures were segmented from the ME-MPRAGE data acquired in the reference position using an automated segmentation algorithm (27). Time–activity curves were generated from the average activity measured in brain structures of interest.
RESULTS
MRI and PET Data Correlation
Spatial Correlation.
Representative PET images of the Derenzo phantom are shown in Figure 2 (left). Even the smallest structures (i.e., 2.5 mm) were resolved. A fusion of the PET and MR images demonstrating the axial offset between the 2 volumes is shown in the middle column. Table 1 provides the transformations derived by the coregistration of the PET and MRI data acquired after the phantom was repositioned inside the scanner. The average transformation obtained from these measurements was used for subsequent studies. After this transformation was applied, perfectly coregistered PET and MRI data were obtained (Fig. 2, right).
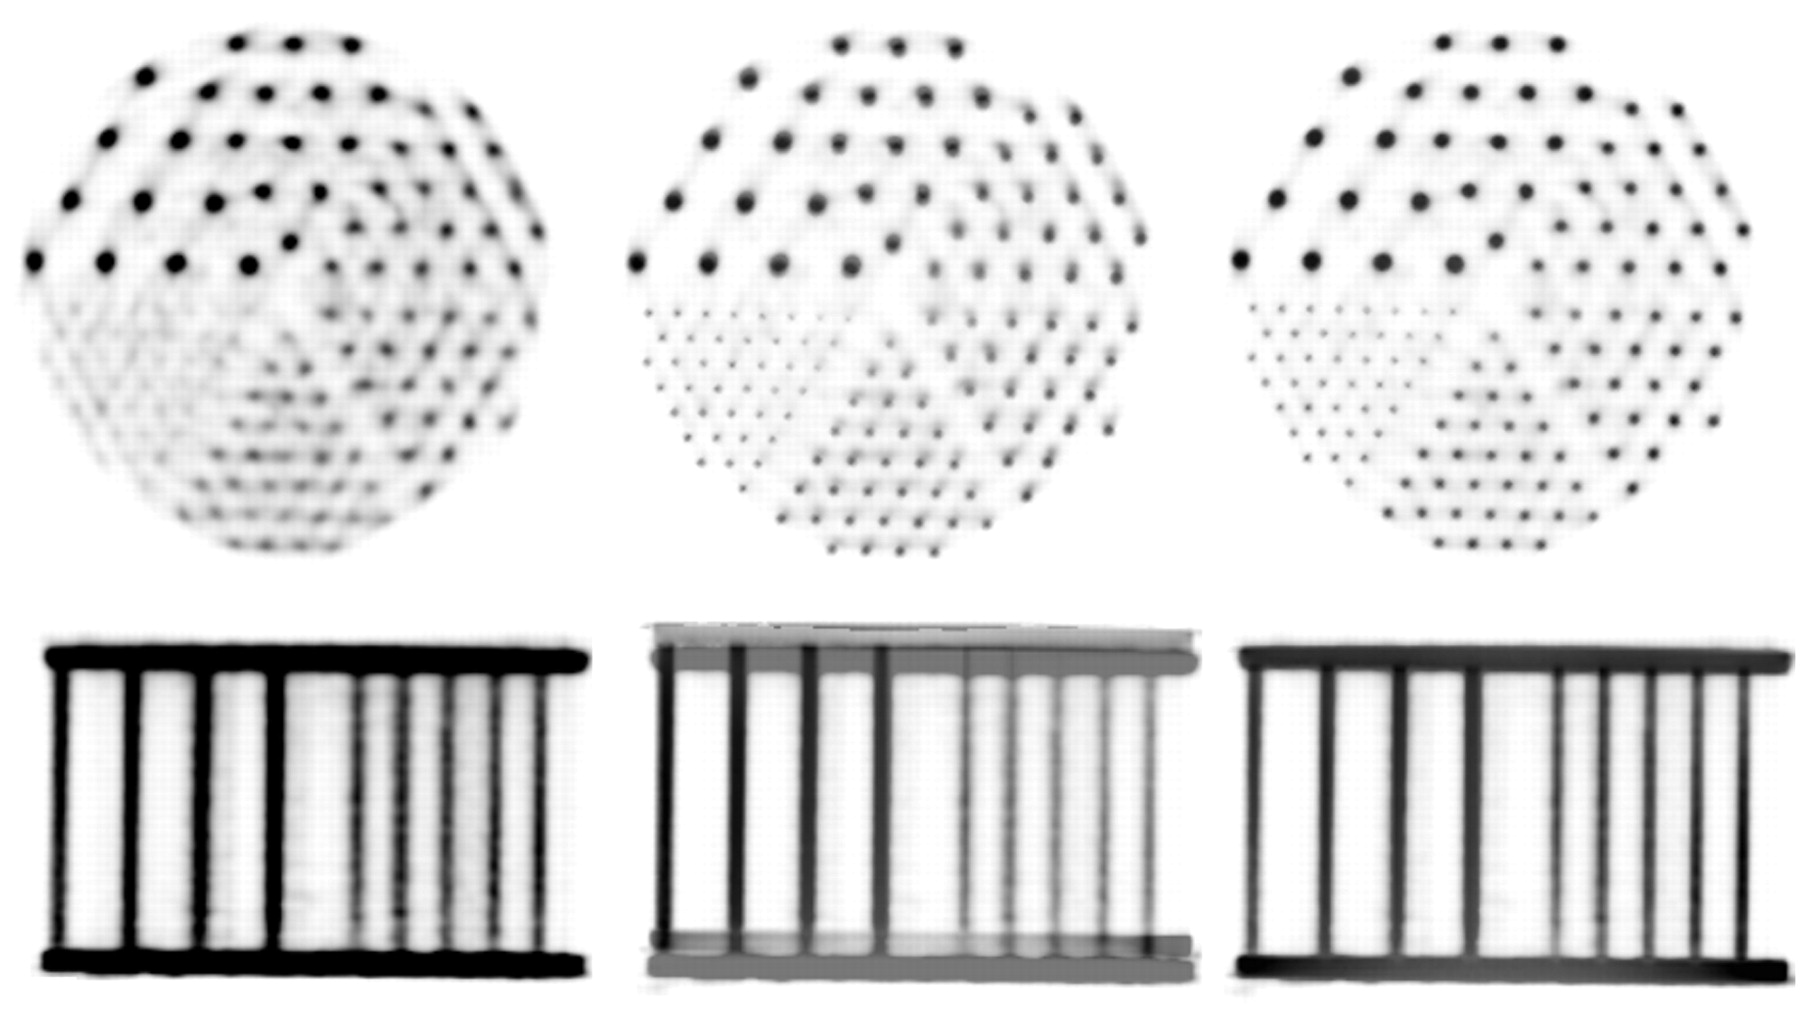
Simultaneously acquired MR-PET data using Derenzo phantom: representative PET images (left) and fused MR-PET images before (middle) and after (right) accounting for spatial mismatch between the 2 scanners. Images in transaxial and coronal orientations are shown in each case.
Spatial Mismatch Between PET and MRI Scanners
Temporal Correlation.
The number of gates recorded into the PET list-mode data for different MRI sequences (e.g., EPI, CLN), using a wide range of TRs (e.g., 20 ms to 5 s),measurements (e.g., 1 to 10) or acquisition times, perfectly matched the expected values (e.g., the total number of recorded gates equaled the acquisition time divided by the TR).
Hoffman Phantom Studies
A representative prompt sinogram is shown in Figure 3 (upper left). These data were obtained by summing the individual prompt sinograms corresponding to the 5 positions of the phantom. Also shown in Figure 3 were the corresponding normalization sinogram (lower left) and prompt and normalization sinograms after application of the MC (right column). Because of motion, most of the sinogram space has been filled with data; the percentage of empty bins was reduced from 44% to 2%.
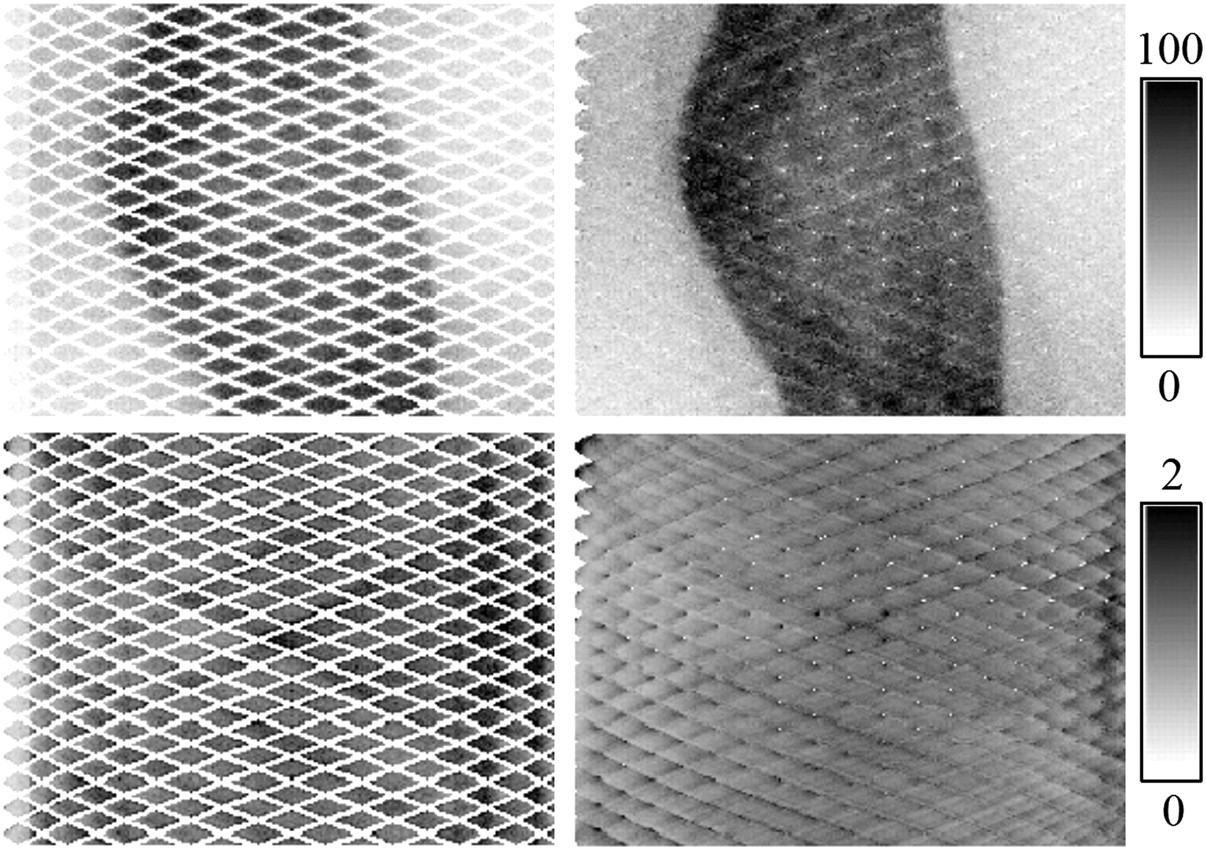
Representative prompt (upper) and normalization (lower) sinograms before (left) and after (right) spatial transformations are applied. Empty bins were filled with data after transformation was applied.
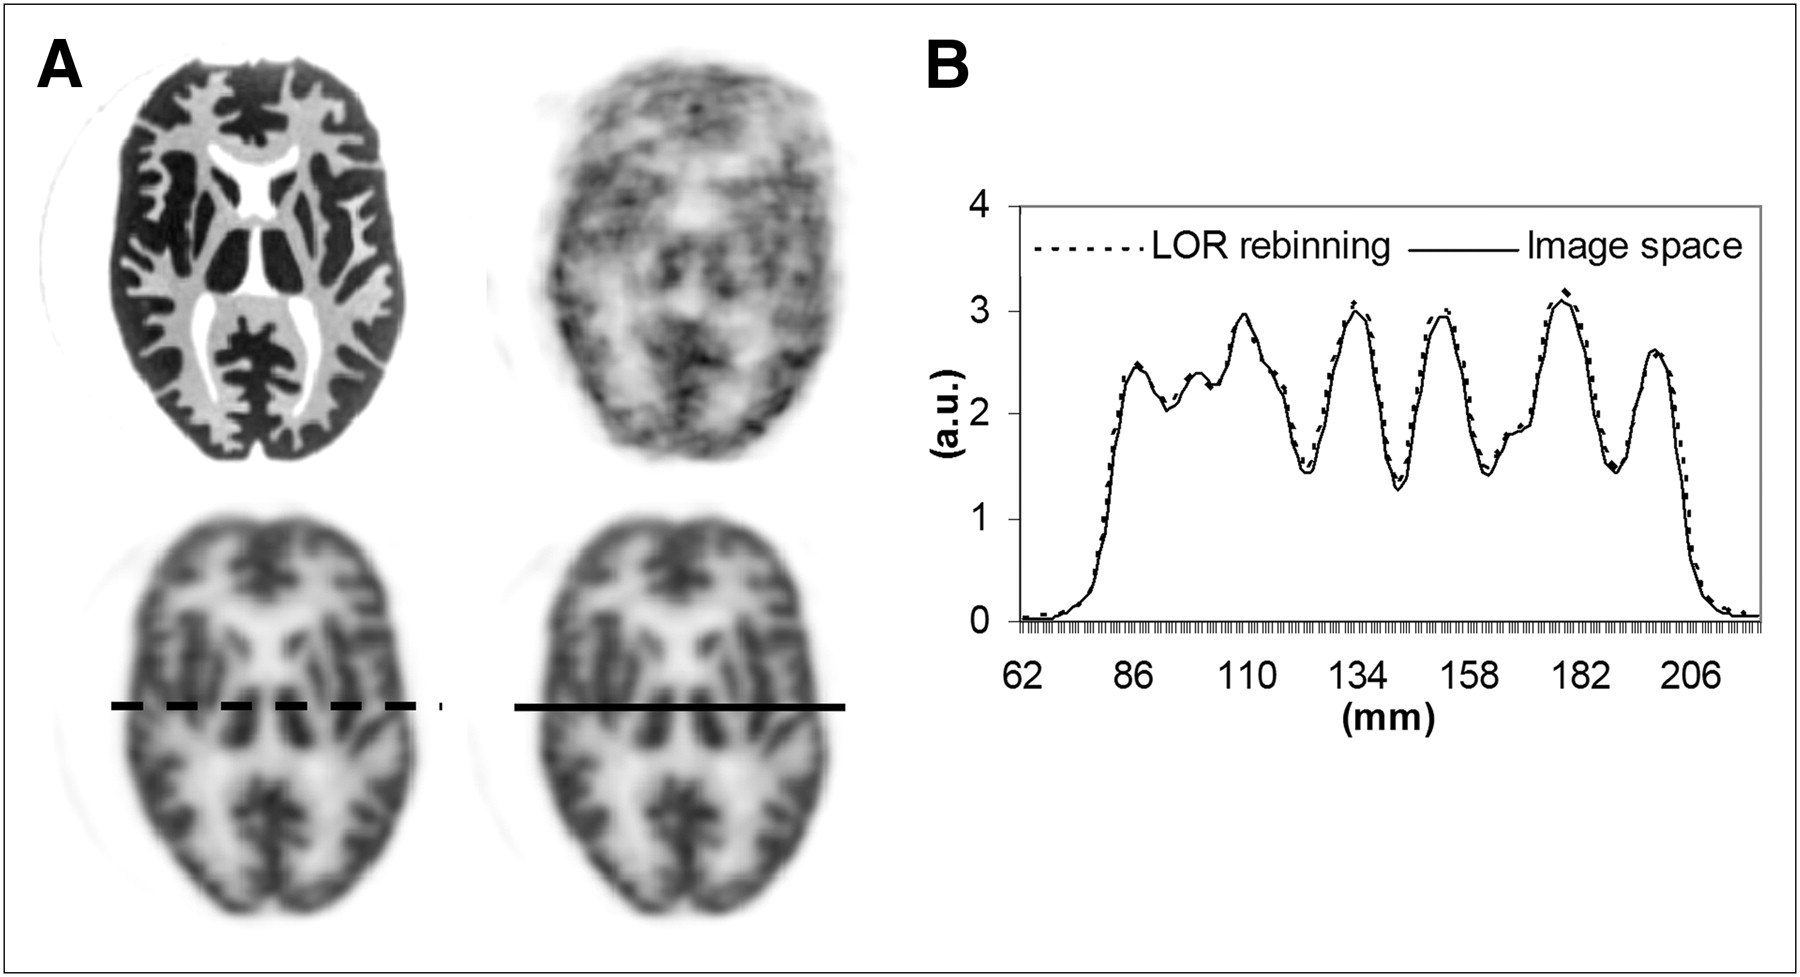
A representative MR image of the Hoffman phantom acquired in the reference position is shown in Figure 4A (upper left). The transformations for the subsequent volumes are given in Table 2. The corresponding PET image reconstructed without MC and images obtained after application of the MC in LOR space and in the image space are also shown in Figure 4A (upper right, lower left, and lower right, respectively), demonstrating substantial improvement. On the basis of the profiles drawn on the transaxial image (Fig. 4B) and the average activity measured in volumes of interest (Table 3), the 2 MC methods produced similar results, suggesting that the proposed LOR-based MC is as accurate as the image-based method.

MRI-based MC in Hoffman phantom using ME-MPRAGE–derived motion estimates: (A) MR images in reference position (upper left), uncorrected PET images (upper right), data corrected in LOR space before image reconstruction (lower left), and data corrected in image space after each individual frame was reconstructed (lower right). (B) Profiles drawn at indicated location demonstrated good agreement. a.u. = arbitrary units.
Hoffman Phantom MRI-Derived Motion Estimates
Quantitative Comparison of LOR-Based and Image-Space–Corrected Volumes in Hoffman Phantom
Human Volunteer Studies
EPI-Derived Motion Estimates.
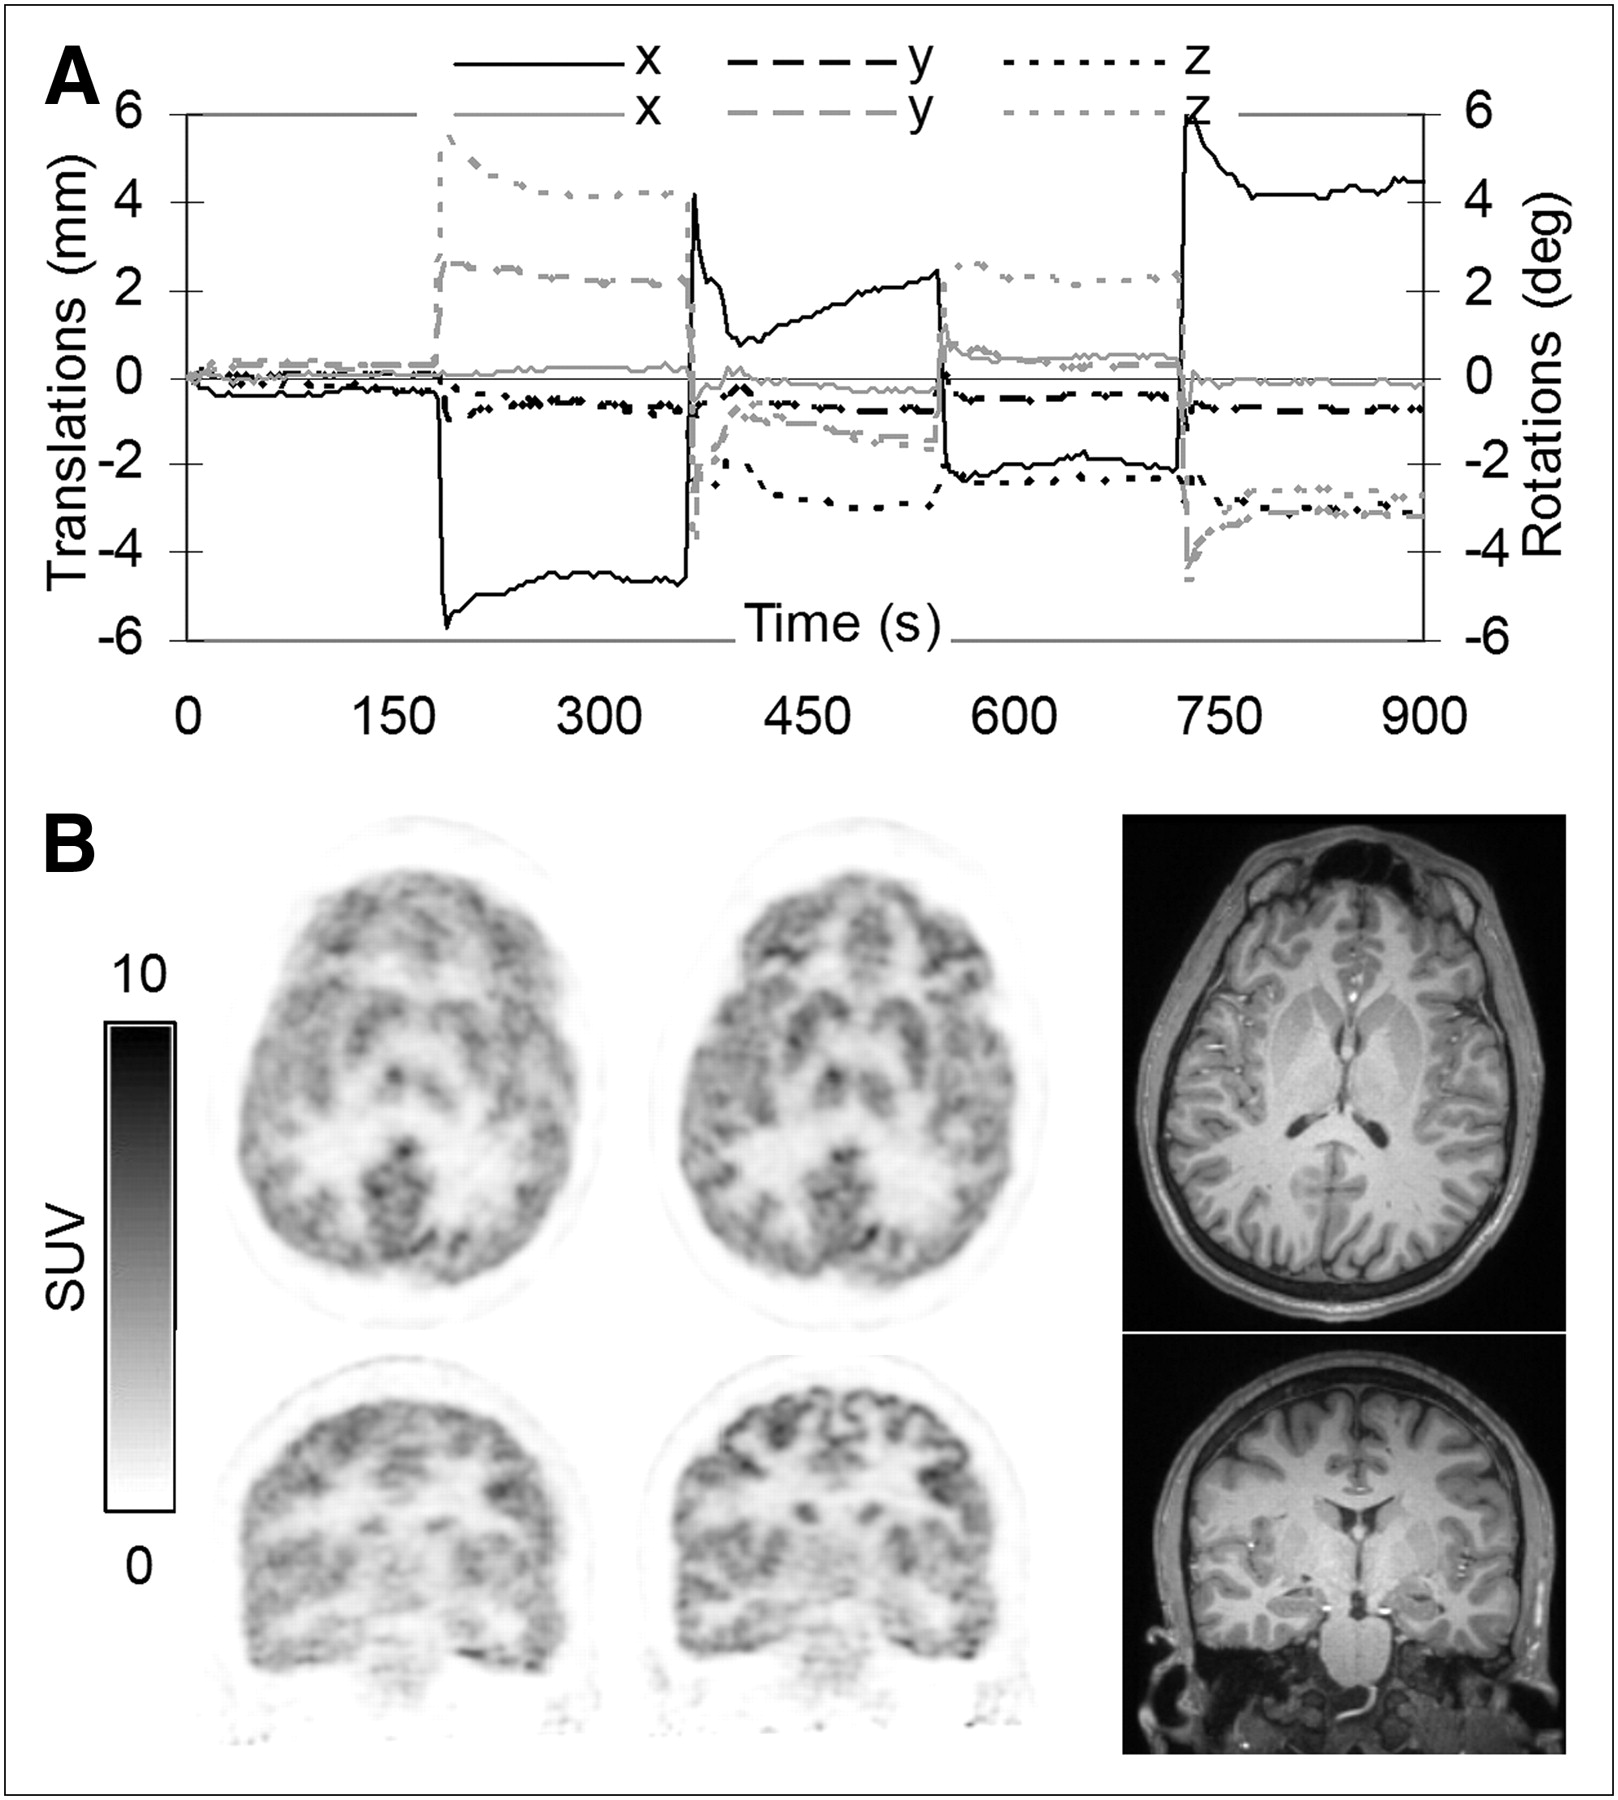
A plot of the transformations obtained every 3 s from the EPI data is shown in Figure 5A. The amplitude of the motion was less than ±6 mm and ±6°. In addition to voluntary motion, a slow drift can be observed in the third time interval. The changes observed immediately after the subject moved at some of the other time points (e.g., first and fourth) are probably due to the subject slowly drifting to a more comfortable position.

MRI-based MC in healthy volunteer using EPI-derived motion estimates. (A) Plot of motion estimates: translations along (black) and rotations about (gray) 3 orthogonal axes are shown. (B) PET data reconstructed before (left) and after MC (middle). PET image quality substantially improved after MC. Corresponding MR images are provided as reference (right). Images in transverse and coronal orientations are shown in each case. deg. = degrees; SUV = standardized uptake value.
The reconstructed PET images before and after MC and the corresponding MRI anatomic slices are shown in Figure 5B. An overall blurring of all the brain structures and a reduction in the gray matter uptake can be observed in the uncorrected data. After MC, excellent delineation of specific brain structures can be appreciated. The processing time was approximately 80 min.
CLN-Derived Motion Estimates.
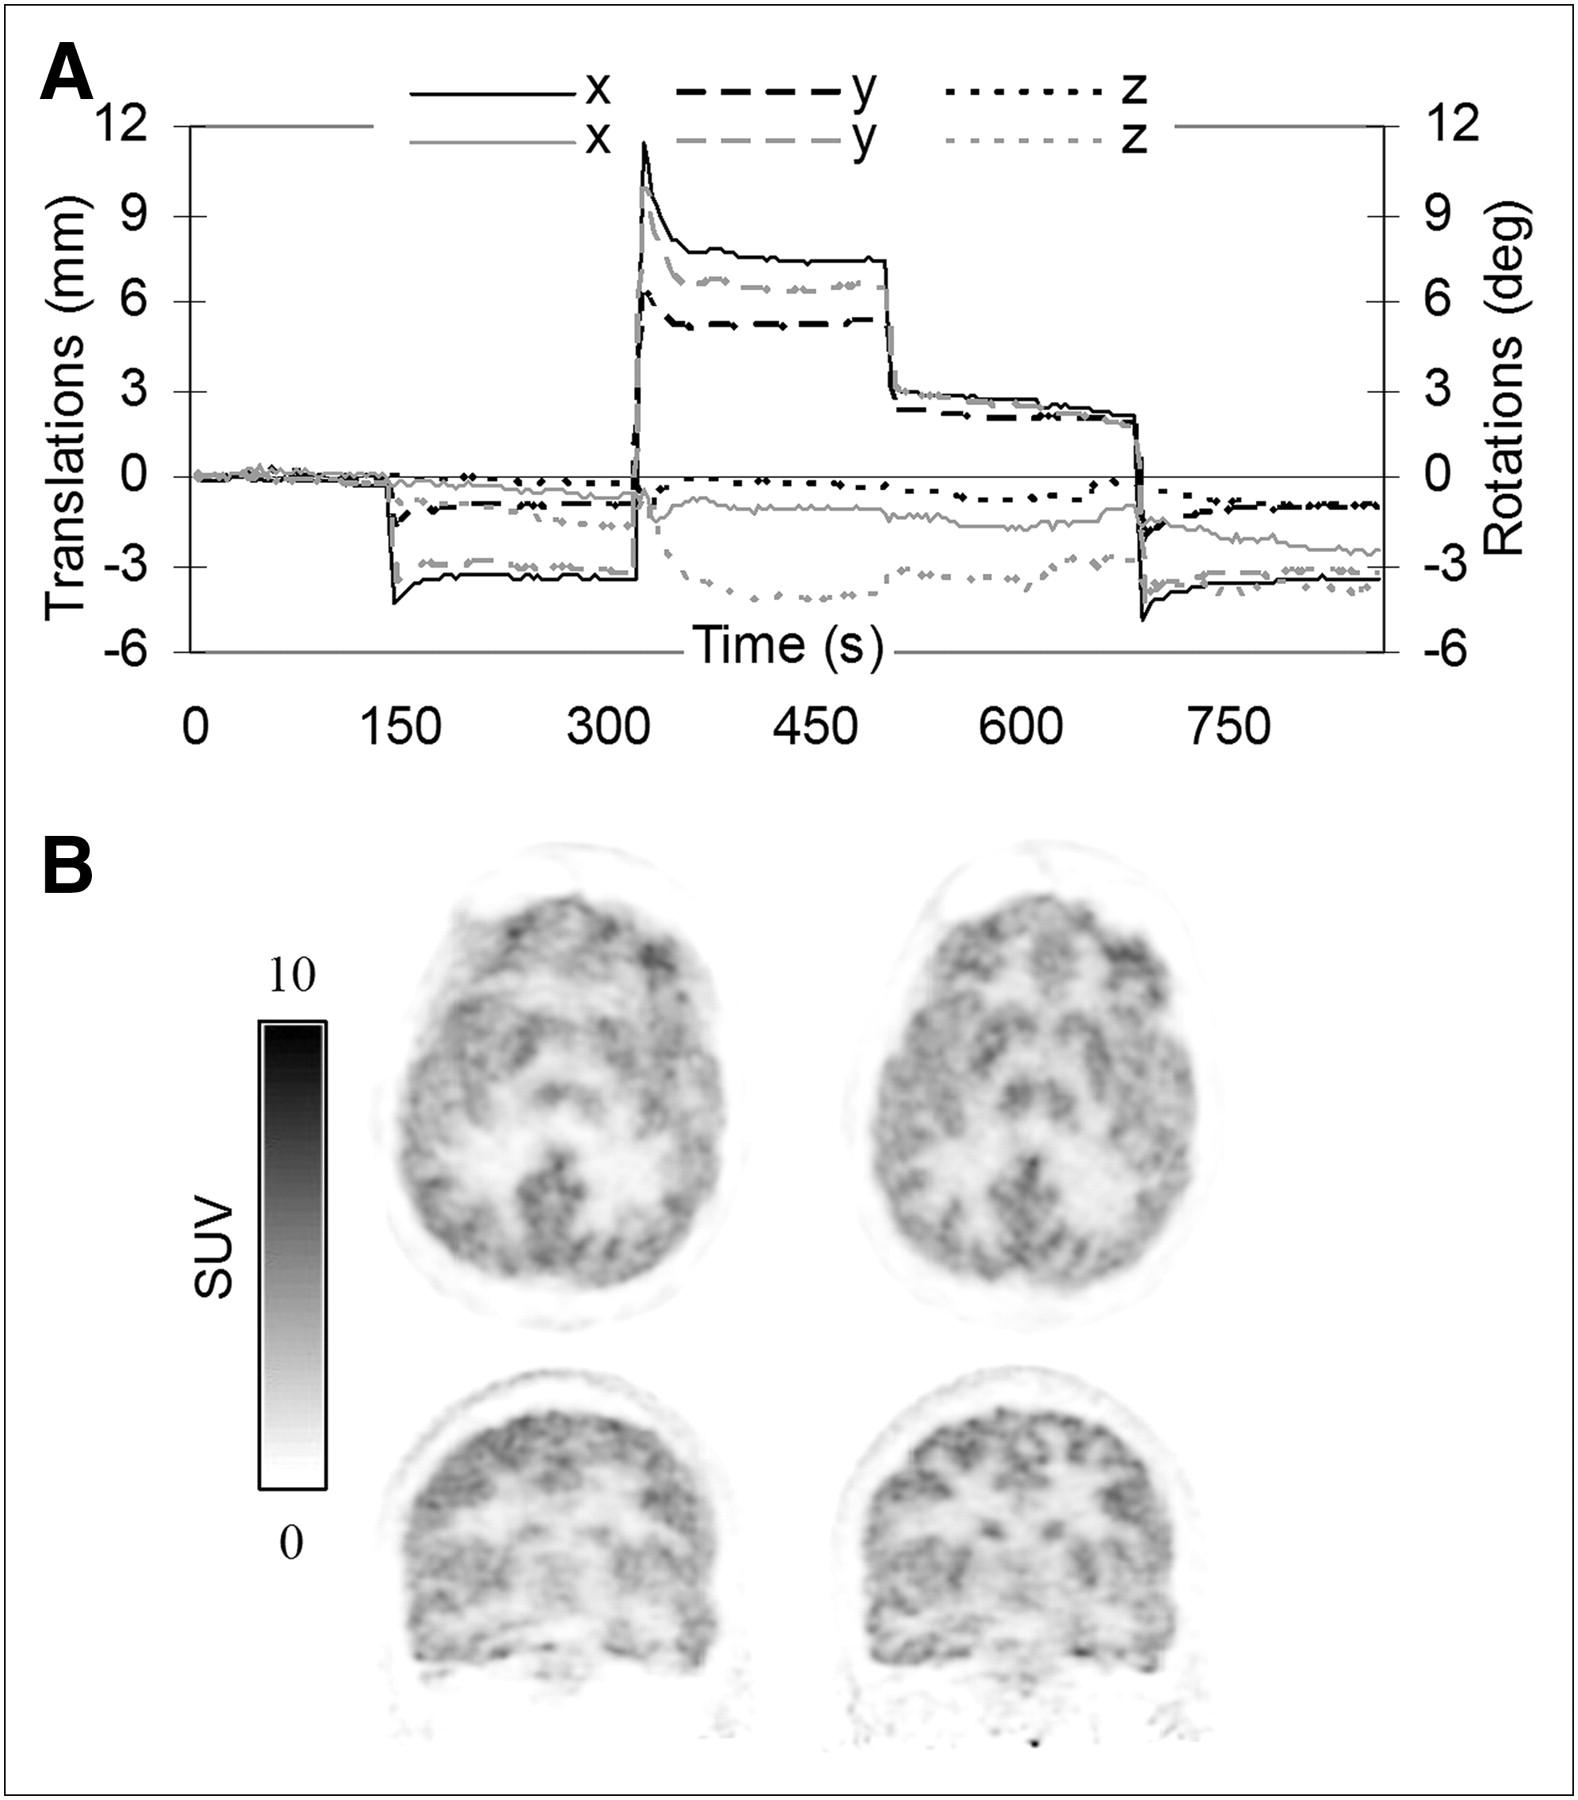
A plot of the translations and rotations applied to the PET data is shown in Figure 6A. Slightly larger amplitude movements were recorded in this case. The transformation matrices in the MRI reference frames (TMRI) were derived from these average values. This matrix was then combined with the TMRI→PET matrix to obtain the transformation in the PET reference frame (TPET) as follows: the translations between the 2 coordinate systems were first removed, the rotations were then applied, and finally the translations were reintroduced.

MRI-based MC in healthy volunteer using CLN-derived motion estimates. (A) Plot of motion estimates: translations along (black) and rotations about (gray) 3 orthogonal axes are shown. (B) PET data reconstructed before (left) and after MC (right). PET image quality substantially improved after MC. deg. = degrees; SUV = standardized uptake value.
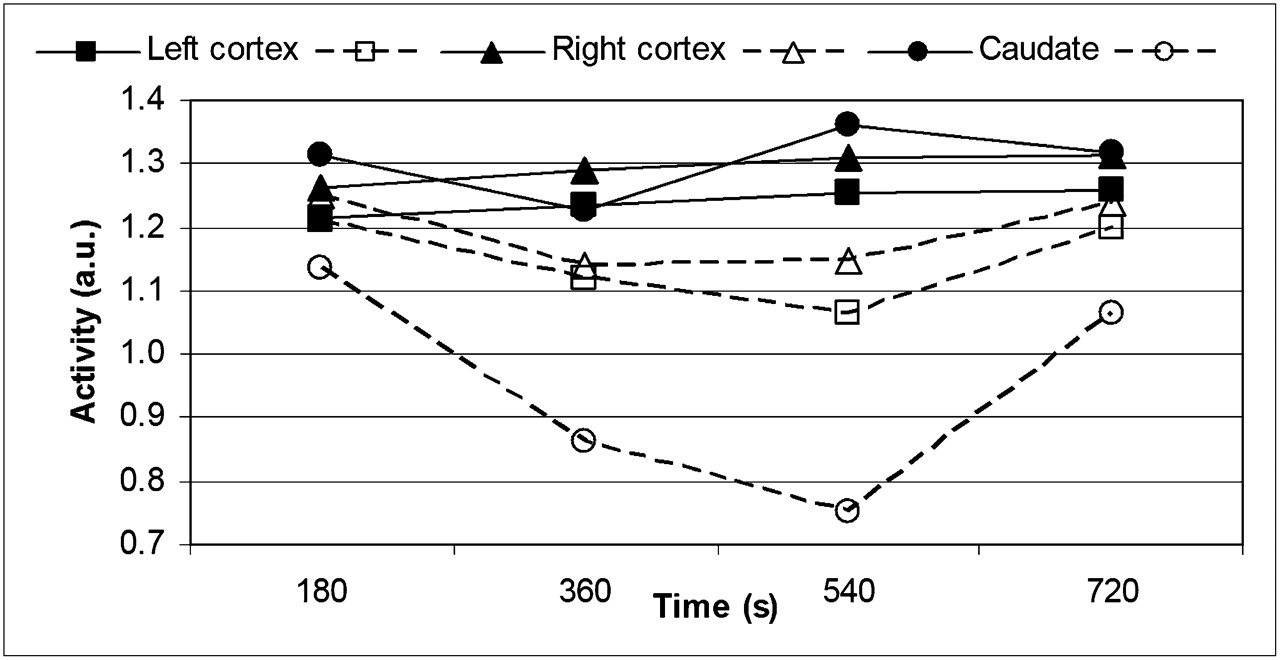
Representative images reconstructed before and after MC are shown in Figure 6B. The substantial improvement in image quality is evident. The processing time was approximately 4 h. Representative time–activity curves are shown in Figure 7. The expected 18F-FDG kinetics in the cortex were observed only after MC.

Time–activity curves obtained from PET data acquired during CLN sequence before and after MC. a.u. = arbitrary units.
On visual inspection, the CLN-based correction seems to produce slightly blurrier images than the functional MRI–based one (Figs. 5B and 6B), possibly due to the larger amplitude of the motion observed in the former case. It was previously reported that the accuracy of the CLN estimates decreases for translations larger than 10 mm or rotations larger than 10° (25). A quantitative comparison between the 2 MC methods was not possible because the activity was not in a steady state. These aspects will be investigated in future phantom studies.
DISCUSSION
Motion correction is highly desirable when a high-resolution PET scanner is used with patients. A solution to this problem is offered by the simultaneous acquisition of MRI and PET data in an integrated MR-PET scanner.
In this work, an LOR-based MC method for the BrainPET scanner has been proposed. This solution allows the use of the standard frame-based reconstruction toolbox and addresses the challenge imposed by the transaxial gaps present between the PET detectors blocks. Because an iterative reconstruction was used, low-count frames may introduce bias in the low-uptake regions (due to positivity constraints). This bias could be minimized by combining the data in LOR space before reconstruction. Furthermore, this method allows the proper handling of the regions that are not inside the PET FOV during the whole scan. For example, if the subject moves outside the FOV for 50% of the time, a sharp transition would be observed in the final image between the region that was inside the FOV for the whole study and the one that was temporarily outside. Performing the MC in LOR space leads only to a noise increase in this region while the average signal is maintained; however, a correction applied after image reconstruction leads to a 50% decrease in the average signal in the same region.
Three MRI-based motion-tracking methods were used in this work.
First, an image-based approach was used for deriving the motion estimates by spatially coregistering the MRI volumes. Compared with the PET image-based method, the coregistration of high-resolution MRI volumes is likely more accurate. In this work, the image-based method (using high-count frames) was used to validate our MC implementation. In phantom experiments, the proposed MC implementation was tested for a wide range of transformations, likely exceeding those normally observed in clinical studies. Although our phantom data results seem to suggest that the quantitative properties of the MC images are preserved, likely more work is required for a complete characterization.
Second, a method using EPI-derived motion estimates was tested in human volunteers. This method is also image-based because the motion estimates are derived by coregistering the individual EPI volumes acquired every TR. This approach is particularly attractive because it allows the simultaneous acquisition of functional MRI and PET data—of interest for several research applications.
Third, a method using CLN was presented in this work. Similar to the EPI-based method, a CLN-based method has the advantage of not interfering with the standard MRI data acquisition. Furthermore, the high-temporal-resolution motion estimates can be used to correct the PET data in short frames—a process that could be important for performing MC in the early phase of a dynamic PET study to sample the radiotracer input function.
In principle, it could be possible to obtain MRI motion estimates from the start to end of a PET acquisition. However, this is not trivial because a typical MRI protocol consists of multiple sequences acquired sequentially, which poses at least 2 challenges. First, intersequence realignment is necessary. For this purpose, a 3D scout (e.g., AutoAlign (28)) could be run between scans to monitor the head position. Second, motion tracking needs to be implemented for all standard MRI sequences. The initial CLN implementation (25) is not suitable for non–steady-state and 2-dimensional sequences. In these cases, a solution would be to separate the navigator from the imaging acquisitions using spatial–spectral radiofrequency pulses. For the navigator, the radiofrequency pulse could excite only the fat in the 3D slab, and for imaging, the radiofrequency pulse would excite only water in the required slice. Proper design of the spatial-spectral pulse could make this approach suitable for 2-dimensional FLASH and 2-dimensional turbo spin-echo sequences (the standard sequences routinely acquired in patient care). A different approach could be used when acquiring morphologic 3D MPRAGE data. In these sequences, there is a recovery period of several hundred milliseconds in which a navigator could be inserted.
The other challenge to the routine use of this method relates to the prohibitive computational time required for processing a long PET study. However, this could be significantly improved by exploiting the fact that the procedure is highly parallelizable (i.e., each subframe can be processed independently on a computer cluster). Furthermore, depending on the study, a threshold for relevant motion could be used (e.g., observing the motion of a virtual point above the nasion), which would reduce the number of subframes that have to be processed.
MRI-based MC has the potential to improve PET as a quantitative method. First, the nominal spatial resolution of the scanner can be achieved. Second, the mismatch between the attenuation and emission volumes can be eliminated. Third, better estimates of the radiotracer arterial input function can be obtained using image-based approaches from motion-corrected data. Together these improvements can increase the reliability and reproducibility of the PET data, potentially benefitting several neurologic applications that require precise quantification or involve uncooperative subjects.
CONCLUSION
A novel implementation of a rigid-body LOR-based MC algorithm is proposed for the BrainPET scanner. The quantitative accuracy of the method was first demonstrated in phantom experiments using motion estimates derived from coregistered high-resolution MRI volumes. Proof-of-principle MRI-assisted PET MC was demonstrated in human volunteers using 2 different MRI methods for tracking the motion. The MRI-assisted MC method allows one to take advantage of the high temporal resolution of the motion estimates provided by the MRI scan and, ultimately, to recover the nominal spatial resolution of the BrainPET scanner.
DISCLOSURE OF POTENTIAL CONFLICTS OF INTEREST
The costs of publication of this article were defrayed in part by the payment of page charges. Therefore, and solely to indicate this fact, this article is hereby marked “advertisement” in accordance with 18 USC section 1734.
Acknowledgments
This work was partly supported by NIH grant 1R01CA137254-01A1.
- © 2011 by Society of Nuclear Medicine
REFERENCES
- 1.
- 2.
- 3.
- 4.
- 5.
- 6.
- 7.
- 8.
- 9.
- 10.
- 11.
- 12.
- 13.
- 14.
- 15.
- 16.
- 17.
- 18.
- 19.
- 20.
- 21.
- 22.
- 23.
- 24.
- 25.
- 26.
- 27.
- 28.
- Received for publication May 19, 2010.
- Accepted for publication September 27, 2010.


Jump to section
Related Articles
Cited By...
- Assessment of Motion Bias on the Detection of Dopamine Response to Challenge
- MR-PET head motion correction based on co-registration of multi-contrast MR images
- Simultaneous task-based BOLD-fMRI and [18-F] FDG functional PET for measurement of neuronal metabolism in the human visual cortex
- An Efficient Approach to Perform MR-Assisted PET Data Optimization in Simultaneous PET/MR Neuroimaging Studies
- Development of a Dedicated Rebinner with Rigid Motion Correction for the mMR PET/MR Scanner, and Validation in a Large Cohort of 11C-PIB Scans
- Dopamine in the medial amygdala network mediates human bonding
- Insights into neuroepigenetics through human histone deacetylase PET imaging
- Dopamine D1 signaling organizes network dynamics underlying working memory
- Reconstruction-Incorporated Respiratory Motion Correction in Clinical Simultaneous PET/MR Imaging for Oncology Applications
- Potential Clinical Applications of PET/MR Imaging in Neurodegenerative Diseases
- Neurobiological basis of head motion in brain imaging
- PET and MR Imaging: The Odd Couple or a Match Made in Heaven?
- Respiratory Motion Correction in Oncologic PET Using T1-Weighted MR Imaging on a Simultaneous Whole-Body PET/MR System
- PET/MRI for Neurologic Applications
- MRI-Based Nonrigid Motion Correction in Simultaneous PET/MRI
- First Clinical Experience with Integrated Whole-Body PET/MR: Comparison to PET/CT in Patients with Oncologic Diagnoses