


Abstract
Change in binding potential (ΔBP) is often used to indicate alterations in neurotransmitter concentration in response to stimuli. Increasingly, it is being used in bolus studies as a quantitative index of dopamine (DA) release. In bolus studies, however, BP is an average quantity over time that is influenced by the dynamics of both the tracer and the neurotransmitter. We sought to characterize the sensitivity of ΔBP to changes in endogenous DA concentration and to elucidate possible biases in ΔBP with respect to timing of task-induced or drug-induced increases in DA. Methods: Noiseless simulations of 11C-raclopride PET curves were performed in a specific binding region with concomitant increases in endogenous DA. DA changes were modeled as δ-functions, γ-variates, or as realistic drug-induced increases in DA over time, based on published results. Graphical estimation of BP with a reference region as the input function was used, with a multilinear formulation of the operational equation. Results: Simulations demonstrated that ΔBP (a) is linear over a narrow range of integrated DA release, (b) has an inherent sensitivity to timing of DA perturbations, and (c) could incorrectly infer the relative amounts of DA released between subject populations or experimental conditions. These results are explained by what we term the effective weighted availability, which describes the interaction of a DA function and free raclopride concentration over time and follows directly from earlier work. Conclusion: We illustrate how, under quite plausible circumstances, ΔBP may lead to erroneous conclusions about relative amounts of DA released after dopaminergic perturbations. Our findings caution against using ΔBP as a quantitative or rank index of DA release when comparing different dopaminergic stimuli.
The compound parameter binding potential (BP = k3/k4), introduced by Mintun et al. in 1984 (1), typically has been used to describe and compare relative amounts of neuronal proteins (or relative drug occupancy of specific binding sites) between subject groups or therapeutic treatment states. Several investigators use the change in BP (ΔBP) relative to a baseline state to infer a directional change in regional neurotransmitter concentration in response to a pharmacological manipulation (2–16), during a behavioral task (17,18), and as an effect of cortical stimulation (19).
The measurement of ΔBP is related to the total amount of neurotransmitter (e.g., dopamine [DA]) released, calculated by the integral of the DA concentration over time. The theory of this relationship has been addressed for bolus-infusion studies in Endres et al. (20). As endogenous DA concentration changes over time, the apparent number of receptor sites available to the tracer (Bavail) changes. ΔBP, compared with a baseline scan, reflects some sort of average alteration in the DA concentration over the course of the PET scan. However, other factors actively contribute to ΔBP, including the shape of the stimulated DA release over time and the free tracer (e.g., raclopride) concentration curve shape (21). If any of these factors is altered, the consequence is a change in ΔBP that may not reflect the same DA release accurately and could corrupt straightforward interpretations of differences in DA function between populations. Differences in timing and duration of endogenous release after a stimulus are likely to exist between subjects and between experimental protocols. In light of these possible variations in DA kinetics, we sought to thoroughly characterize this commonly used index of DA release.
Many investigators have thoroughly characterized the types of biases that occur with different models and methodologies in calculation of BP (22–28). However, apart from these important issues, BP itself and ΔBP may not behave as one might expect. For example, ΔBP has been shown previously to not be a linear measure of receptor occupancy (29), as some may assume to be the case. Our goal was to explore the use of ΔBP as a quantitative index of neurotransmitter release. We claim that knowledge of this behavior is necessary for proper interpretation of data from experiments.
Several types of simulations of 11C-raclopride PET imaging were generated to examine effects of the timing and kinetics of DA release on ΔBP. Idealized DA release functions were simulated as γ-variates to examine ΔBP with respect to amount of DA release and as short-lived DA spikes of identical height and area under the curve to isolate the effect of timing on ΔBP. Realistic DA release responses were manually derived from 11C-cocaine and 11C-methylphenidate results (15) to provide information on the behavior of ΔBP when comparing kinetically different DA release patterns. Two additional sets of γ-variate functions were used to examine how changes in ΔBP are related to the temporal interaction of simultaneous change in both endogenous DA and free raclopride concentrations. Finally, the simulation results are explained in terms of an interaction term we have chosen to call effective weighted availability (EWA), and a hypothetical experiment is postulated to illustrate the effects of EWA in practice.
MATERIALS AND METHODS
General Simulation Protocol
Noiseless simulations of 11C-raclopride PET studies were performed using an enhanced compartmental model of receptor–tracer kinetics in competition with an endogenous ligand (30), implemented in MATLAB (MathWorks, Inc.) with COMKAT (31). COMKAT uses ode15s, a robust ordinary differential equation (ODE) solver with variable step size (32–34). The effect of DA transients on raclopride binding are added into the standard compartmental model via a version of equation 7 from Morris et al. (30):
 Eq. 1 where the FDA, BDA are the free and bound DA concentrations over time; konDA,koffDA are the binding and dissociation rate constants for DA at the DA D2 receptor site; Bmax(tot) is the total number of D2 receptors, including those occupied by DA at steady state; BRAC* is bound radioactive tracer (for this particular study, raclopride [RAC]); and BRAC is bound unlabeled tracer. All free and bound concentrations are time varying. An idealized plasma input function of raclopride concentration was used to drive the simulations; blood radioactivity was calculated from the plasma concentration, assuming a hematocrit of 0.39. Unless otherwise specified, striatal kinetic parameters of 11C-raclopride were set as follows: K1 = 0.0918 mL/min/g; k2 = 0.4484/min; kon = 0.0282 ([pmol/mL][min])−1; Bmax(tot) = 44 pmol/mL; koff = 0.1363/min; k5 = 0; and k6 = 0 (based on Pappata et al. (35)). In addition, kinetic parameters for endogenous DA were set: konDA = 0.025 ([pmol/mL][min])−1; koffDA = 25/min; and baseline DA concentration = 100 nmol/L (based on Fisher et al. (36)). (Note that to simulate the effect of endogenous DA on raclopride, we must specify the total number of receptors, Bmax(tot).) The commonly quoted parameter is B′max, the available receptor concentration at steady state. By assuming that Bmax(tot) = 44 nmol/L and that 50% of total receptors are occupied by endogenous DA at steady state, we implicitly assume that B′max = 22 nmol/L. This is consistent with the literature for both human (37) and nonhuman primate (38) imaging of D2 or D3 receptors. Simulations generated with these parameters alone, with no DA function to perturb the system, were considered to be the baseline condition and generated a BP, BP1. An ideal cerebellum curve (reference region) was generated with the same K1 and k2 as that of the striatal simulations, but with k3 = 0. Scans were simulated for 5,400 s, with 540 × 10-s frames.
Additional simulations were created with the following alternative tracer kinetic parameters (modified from Endres and Carson (21)): k2 = 0.333/min; kon = 0.0023 ([pmol/mL][min])−1; and koff = 0.02/min.
DA Responses as δ-Functions
DA perturbations were simulated as approximated ideal δ-functions. Perturbations were created by generating step functions of 1 min in width and 1 × 10⁴ nmol/L in height to briefly displace all bound species. Approximate δ-functions were simulated at many time points before, at, and after simulated 11C-raclopride injection. However, in each simulation, only one approximate δ-function was used.
DA Functions as γ-Variates
DA perturbations were also simulated according to:
 Eq. 2 where DAbasal is the baseline DA concentration (100 nmol/L), and td is the time delay (min) of the onset of the function relative to t = 0 of the simulated scan. The following settings were used to generate functions that peaked at the same time (tp = td + α/β), but differed with respect to DA integral: td = 1 min; α = 0.5; β = 1.0; γ = 100, 200, 300, 400, 500, 1,000, 2,000, 3,000, 4,000, 5,000, 10,000. Two additional γ-variate functions were created to examine the effect of timing of DA perturbations on ΔBP (td = 0, 1, 2, 3, 4, 5, 6, 7, 8, 9, 10 min): α = 1; β = 1.2; γ = 7,000; α = 2; β = 0.8; γ = 1,000. These γ-variate functions were simulated with the 2 sets of tracer kinetics mentioned earlier.
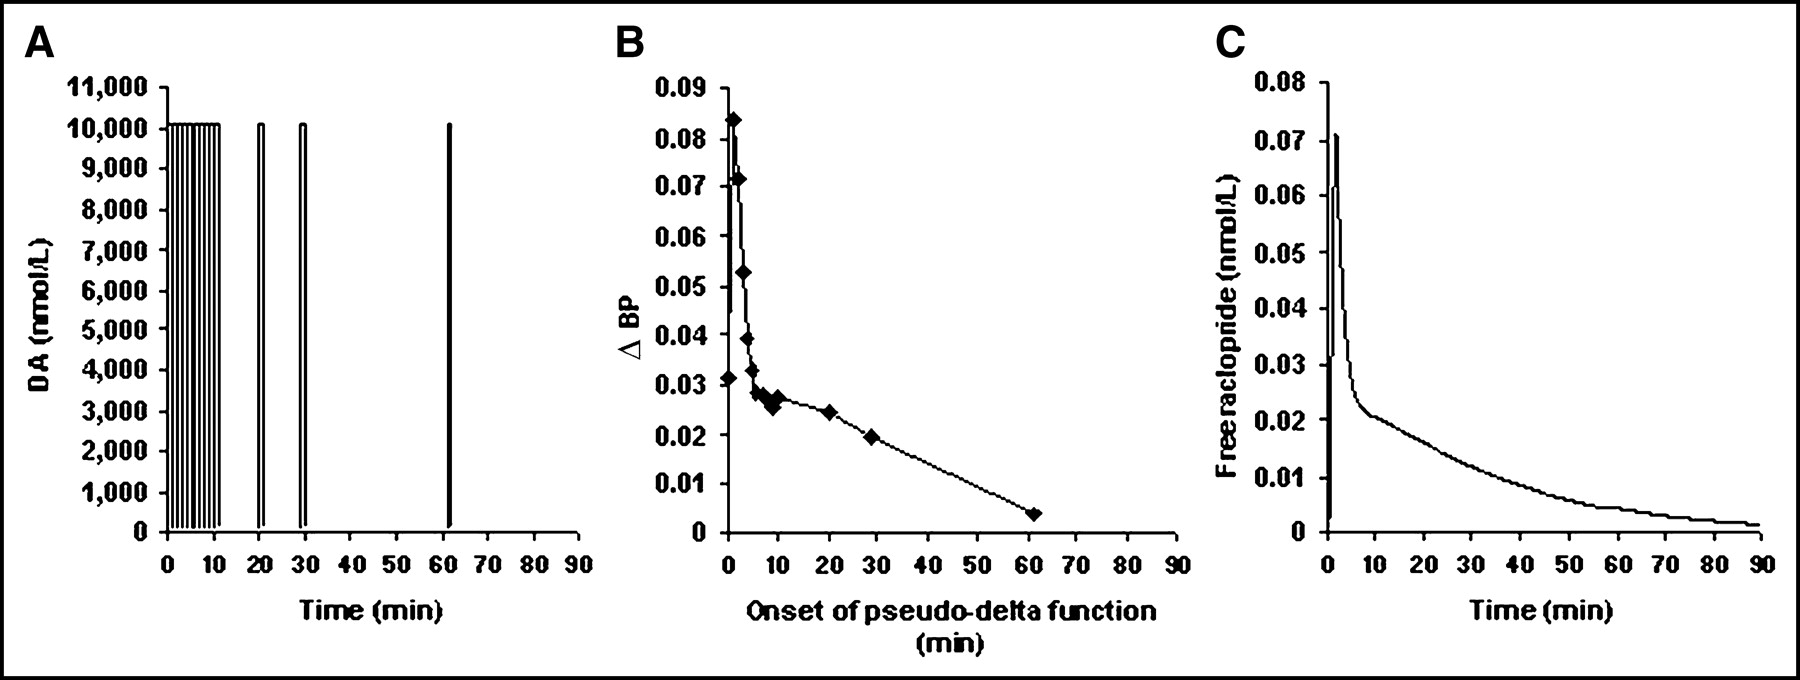
Short DA pulses (Fig. 1A) were chosen intentionally to be certain that calculation of ΔBP via Logan graphical analysis would be completely valid (i.e., the Logan plots would become linear).
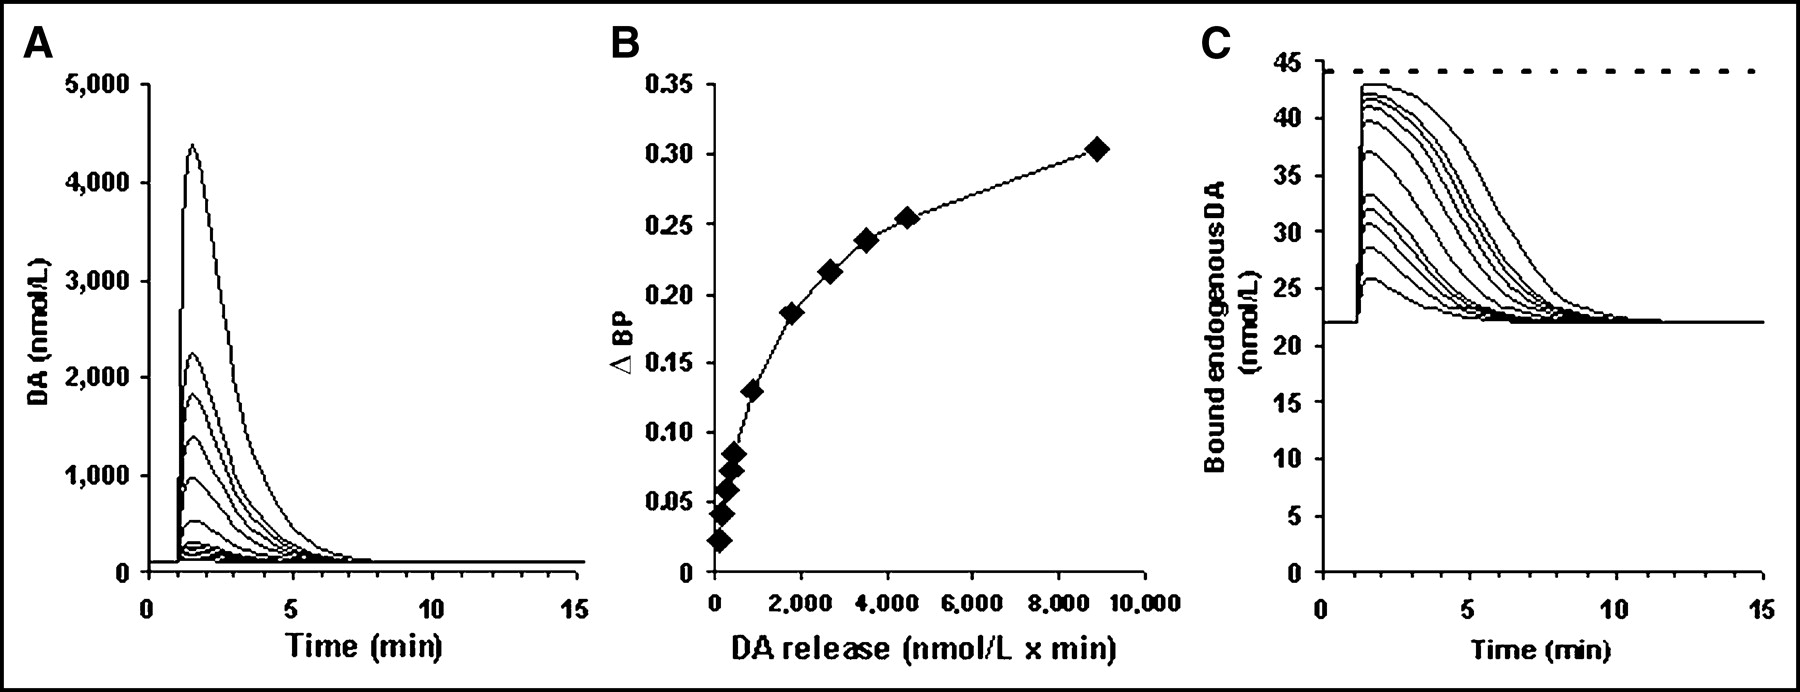
(A) Idealized DA perturbations with identical DA peak times used in simulated 11C-raclopride scans. ΔBP (B) and bound endogenous DA (C), corresponding to different DA release for each perturbation shown in A. Dashed line at 44 nmol/L indicates Bmax(tot).
DA Functions as Drug-Induced Increases in DA
Striatal and cerebellar time–activity curves of 11C-cocaine and 11C-methylphenidate (15) were used as a guide to approximate realistic DA functions induced by the respective pharmacological challenges of cocaine and methylphenidate. We reasoned that (a) bound tracer concentration accurately reflects the relative concentrations and time courses of cocaine and methylphenidate activity in the brain and (b) endogenous DA release is directly proportional to the amount of drug bound to the DA transporter—that is, all drug bound to the DA transporter causes inhibition of DA uptake and, hence, DA concentration persists at an elevated level in accordance with the retention of either cocaine or methylphenidate in the central nervous system. The differences in PET signal between the striatal and cerebellar time–activity curves of both 11C-cocaine and 11C-methylphenidate (15) were taken to represent specifically bound striatal concentration of tracer. To create DA responses, baseline DA was set to be 100 nmol/L, and peak DA concentration was set at 500 nmol/L. Curves were manipulated to mimic the shape of the specifically bound component (striatal minus cerebellar activity) of 11C-cocaine (cocaine-induced) and 11C-methylphenidate (mp-induced). mp-Induced curves were further manipulated to return smoothly to baseline at 90 min so that the area under the curves would be constant within the simulated 90-min scan. Cocaine-induced and mp-induced DA functions were introduced at the following times relative to the simulated bolus of 11C-raclopride: at 15, 10, 5, and 2.5 min before tracer injection, at the exact time of tracer injection (t = 0), and at 1, 5, 10, and 15 min after tracer injection.
Calculation of ΔBP and DA Release
Estimation of BP was derived via graphical estimation (39) with a reference region as the input function, using the multilinear rearrangement of the operational equation (40) as follows:
 Eq. 3 where C(t) and Cref(t) are the time-varying radioactivity concentrations in the striatum and cerebellum, respectively, and C(T) is the striatal concentration at time T. m is the slope and b is the y-intercept of the original Logan formulation using the cerebellum as the input function (39). Data from the first 10 min (600 s) of the scans was excluded in all cases. All Logan plots exhibited linearity after removing these time points. The change in BP from baseline (BP1) was calculated as ΔBP = (BP1 − BP2)/BP1, where BP2 was derived from one of the many time–activity curves created with a DA perturbation as described in Equation 1. Data are expressed as either ΔBP or as normalized ΔBP (nΔBP) relative to ΔBP at DA takeoff at t = 0 min:
 Eq. 4
Eq. 4
DA release (nmol/L·min) was calculated as the numerical integral of the DA curve minus the numerical integral of basal DA over the duration of the simulated scan (90 min). All γ-variate and drug-induced curves returned to baseline levels before the end of the simulated scan so that the numerical integral is essentially equal to the analytical integral to infinity.
RESULTS
Response of ΔBP to Changes in Amount of DA Released
DA functions designed to isolate the effect of DA integral (i.e., DA release) on ΔBP are shown in Figure 1. (Note that this and all subsequent graphical representations of DA perturbations are increases above a baseline DA concentration of 100 nmol/L.) All functions peak at exactly the same time. ΔBP is linear over a narrow range of amount of DA released (∫ DA < 450 nmol/L·min). As the amount of DA released is increased even more, the measured change in BP begins to approach a maximum value. (Note that the point at which ΔBP starts to plateau does not correspond to an extended or complete occupancy of receptors [Fig. 1C].)
Response of ΔBP to Timing of DA Release
DA curves that approximated δ-functions initiated at various times during simulated scanning and the resulting ΔBPs as a function of the timing are illustrated in Figure 2. All of the approximate δ-functions released the same amount of DA, but ΔBP exhibited a time dependence that closely followed the temporal pattern of free raclopride concentration (Fig. 2C).

(A) Idealized DA perturbations as approximate δ-functions used in 11C-raclopride simulations. (B) ΔBP resulting from each approximate δ-function, plotted vs. time of onset (td). (C) Free tissue raclopride, FRAC(t), curve over time for a case of no DA perturbation (baseline).
Response of ΔBP to DA Release Patterns with Different Kinetics (i.e., Shape)
Curves prepared to simulate cocaine-induced and mp-induced DA responses are shown in Figure 3. The large mp-induced curve and the small mp-induced curve differed by approximately a factor of 2 in amount of DA release (22,800 and 11,400 nmol/L·min, respectively). The cocaine-induced DA function was kinetically different from the small mp-induced curve but was chosen to have a similar, although slightly smaller, DA release compared with the small mp-induced curve (10,700 nmol/L·min). Figure 4A shows ΔBP for each type of DA perturbation relative to the timing of the respective functions. For all induced DA functions that occur at t > 0, ΔBP decreases steadily as the onset of each DA curve is delayed in time after tracer injection. ΔBP for the large mp-induced DA response is greater than ΔBP for the small mp-induced curves. Although the DA release from the large mp-induced curves is twice that of the small mp-induced curves, the corresponding ΔBPs for the large mp-induced curves are not twice the ΔBPs for the small mp-induced DA response. If ΔBP were an ideal measure of DA release, then the ΔBP for the large mp-induced curve would be twice that for the small mp-induced DA curve. For each cocaine-induced curve that takes off at a given time t, the value of ΔBP is larger than that for the corresponding small mp-induced response that takes off at the same time t. This result is despite the fact that the small mp-induced curves actually have slightly larger area under the DA curve (representing more DA release) than the cocaine-induced DA responses.

Timing of cocaine-induced (A) and mp-induced (B and C) endogenous DA responses used as perturbations in 11C-raclopride simulations. Bold lines indicate reference responses (DA responses beginning at t = 0 of the simulated scan). Note that the x-axes start at −20 min (i.e., 20 min before start of simulations).

(A) ΔBP for cocaine-induced and mp-induced DA responses with respect to timing of each perturbation. (B) Identical data set shown in A, normalized by ΔBP from a reference perturbation (Fig. 3) initiated at t = 0 for each DA curve type.
If we normalize each ΔBP value by the ΔBP based on a given DA response type at t = 0 (nΔBP), we see that there is some uniform relationship between ΔBP and timing of response (Fig. 4B). However, this is restricted to responses that follow, not precede, tracer administration; also bear in mind that in a real study, the proper reference response would not be known. As the DA functions are moved out later in time relative to the time of the simulated 11C-raclopride injection, nΔBP decreases in a consistent manner for all endogenous perturbations, regardless of shape (cocaine-induced vs. mp-induced) or DA integral (e.g., small mp-induced vs. large mp-induced). When endogenous DA curves are initiated before the start of the scan, 2 distinct patterns emerge that suggest an effect of shape of DA response on ΔBP. Both mp-induced DA curves introduced at t < 0 result in nΔBPs above 100%, whereas the cocaine-induced responses appear to produce a maximum drop in BP if they begin approximately at the time of bolus injection of 11C-raclopride.
Effect of Kinetically Different DA Curves on ΔBP: Model of Responses to Cognitive Stimuli
We examined the effect of timing and shape on ΔBP for smaller amounts of DA release. The 2 shapes and sizes might represent dopaminergic responses to cognitive stimuli (Fig. 5). Cognitive DA pattern (CDP) I represented a rapid increase in DA takeoff, a tall peak, and a return to baseline DA concentration approximately 10 min after the initial takeoff. The DA integral for CDP I was equal to 4,861 nmol/L·min. CDP II represented a smaller DA integral (3,906 nmol/L·min), a shallower DA peak, and a slower takeoff and return to baseline, where baseline DA concentration was restored by 15 min after DA takeoff.
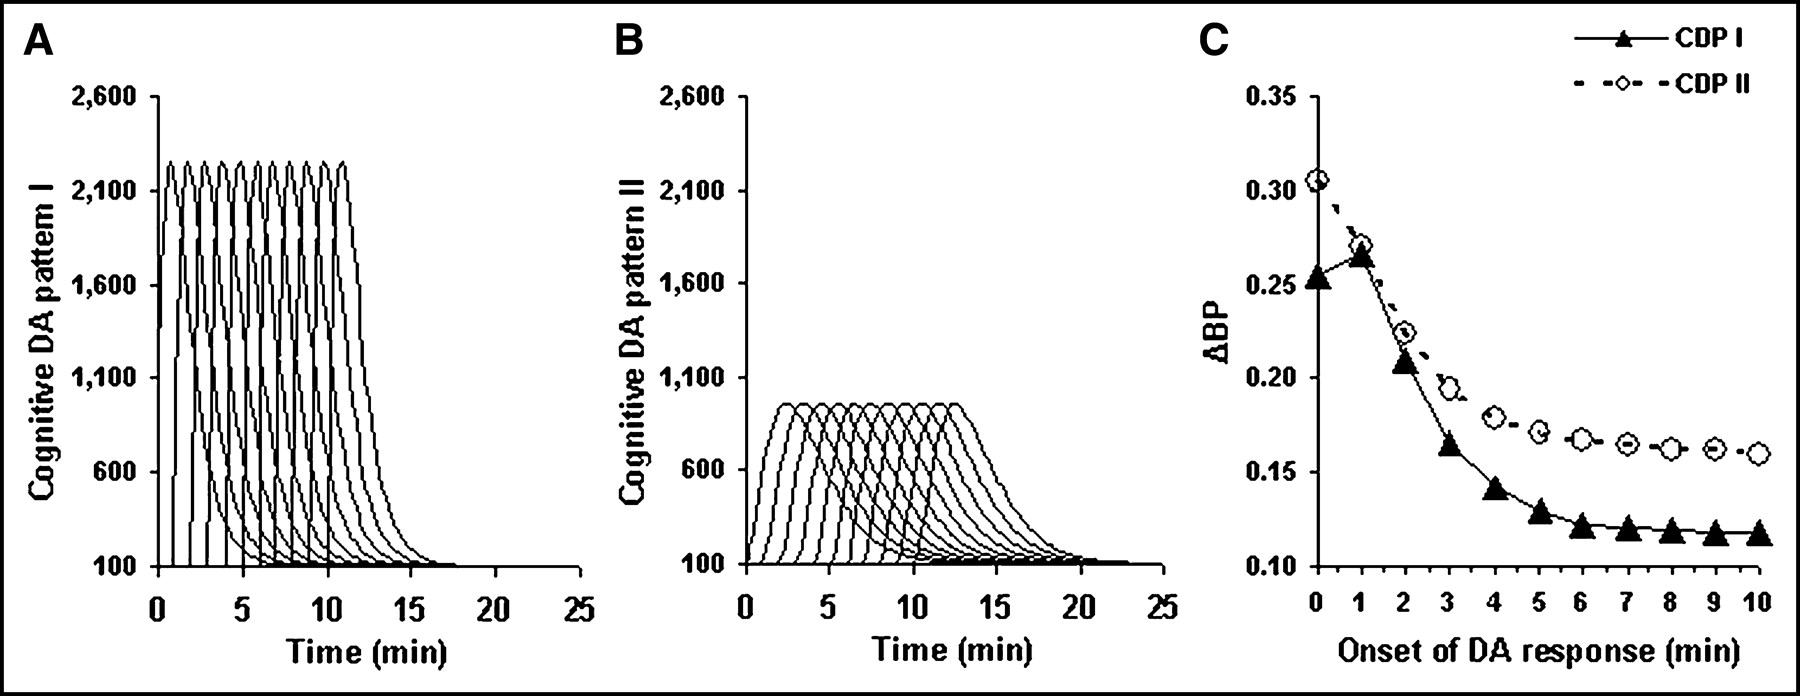
(A) γ-Variate functions representing CDP I at multiple times. Height of peak corresponds to 42.0 nmol/L bound endogenous DA, with corresponding transient maximum receptor occupancy of 95%. (B) γ-Variate functions representing CDP II at multiple times. Height of peak corresponds to 39.8 nmol/L bound endogenous DA, with corresponding transient maximum receptor occupancy of 90%. (C) ΔBP for CDP I (▴) and CDP II (○) as responses are delayed in time relative to bolus 11C-raclopride injection.
The ΔBPs for CDP I and CDP II curves (each γ-variate was simulated with td = 0, 1, …, 10 min) are presented in Figure 5C. For all DA responses initiated later than 3 min after the tracer, the ΔBP value is larger for the blunt DA response than for the sharp response, even though the sharp response corresponds to a greater total release of DA. These results are similar to the trend observed for the cocaine-induced and small mp-induced DA curves initiated at multiple times after tracer administration. In both instances, ΔBP was not solely a reflection of total amount of DA released.
DISCUSSION
Observations About ΔBP
Data from the simulations presented here demonstrate 3 properties of ΔBP. First, ΔBP does not increase linearly with increases in DA release, even for identically shaped DA curves. With our simulations, the linearity of ΔBP appears to be confined to a narrow range of the amount of DA release. This nonlinearity of ΔBP was observed in simulated PET data for which DA takeoff and peak time were held constant across simulations. The asymptotic behavior of ΔBP versus integrated DA release is not simply a function of receptor saturation; none of the γ-variate DA curves fully saturated D2 receptors at any point during the simulated study (Fig. 1C). Second, isolation of DA timing with idealized step functions showed that ΔBP is not purely a measure of DA release. Although the approximate δ-functions are physiologically unrealistic, they allow for examination of the timing effect on ΔBP without the confound of kinetics (i.e., shape) imposed by a DA curve. Finally, it was observed that ΔBP may not correctly predict the relative amounts of DA released by 2 DA responses if the responses are not kinetically identical. This was illustrated with both realistic (drug-induced) and idealized DA release patterns.
EWA
According to equation 6 of Endres and Carson (21), change in distribution volume (ΔV) can be expressed as:
 Eq. 5 where BP1 refers to the BP (k3/k4) resulting from the baseline condition scan; BP2(t) refers to the BP derived from a second scan with an induced increase in endogenous DA; and w(t) is a weighting factor. Substituting w(t) with equation 5 from (21), ΔV can be explained for a bolus study in terms of both the time-varying free raclopride concentration (FRAC) and the time-varying increase in DA concentration above baseline (DA) as:
 Eq. 6 In bolus studies with a dopaminergic stimulus, both free raclopride and free DA are functions of time. KdDA is the affinity constant for endogenous DA (assumed here to be 100 nmol/L); konB′max (= k3) is the apparent first-order binding rate constant; and koff (= k4) is the dissociation rate constant. Equation 6 assumes that DA is always in equilibrium between free and bound states. Although finite values were assigned to the association and dissociation rates of DA in this work, these rates are sufficiently fast that DA will be effectively in equilibrium in the simulations presented. Based on their respective definitions, ΔBP and ΔV are related as follows:
 Eq. 7 Equation 6 may be simplified to emphasize the existence of a simple linear relationship between ΔBP and what we term EWA:
 Eq. 8
Eq. 8
 Eq. 9 where const′ is a constant as long as BP1, KdDA, and ∫0∞ FRAC(t)dt behave as constants.
Confounds to ΔBP as a Measure of DA Release: Timing Is Everything
Endres and Carson (21) derived a relationship that describes how ΔBP is affected by the time-varying interaction of free neurotransmitter concentration and free tracer concentration. We have chosen to designate the temporally dependent (nonconstant) portion of this equation as EWA and have demonstrated via simulations that the value of the apparent ΔBP that is calculated from any 2 PET studies decreases linearly as EWA of the second scan is increased.
As suggested by Figures 4 and 5, both the timing and the kinetics of a DA response contribute to the ΔBP that is calculated from increases in DA relative to some baseline condition. Differences in the timing of a given DA response alter the temporal interaction of that particular DA curve with the free raclopride curve. EWA is the term that encompasses the interaction of DA response timing with the timing of the tracer concentration.
ΔBP Can Be Larger for Smaller DA Release: Seeing Is Not Always Believing
If 2 DA functions have very different kinetics, EWA is a means of predicting how the results may be interpreted. Data from the simulations of cocaine-like versus small mp-like curves and CDP I (sharp) versus CDP II (blunt) are 2 examples of how ΔBP may misrepresent relative amounts of DA released across 2 conditions. In both comparisons, ΔBPs were lower (naively implying less DA release) for the curves that actually represented larger amounts of DA release. The relative shape (i.e., latency to DA takeoff, time to peak, peak height, and rate of return to baseline) of the DA responses determines the relative EWAs and, hence, the relative size of ΔBP for 2 different curves being compared with each other.
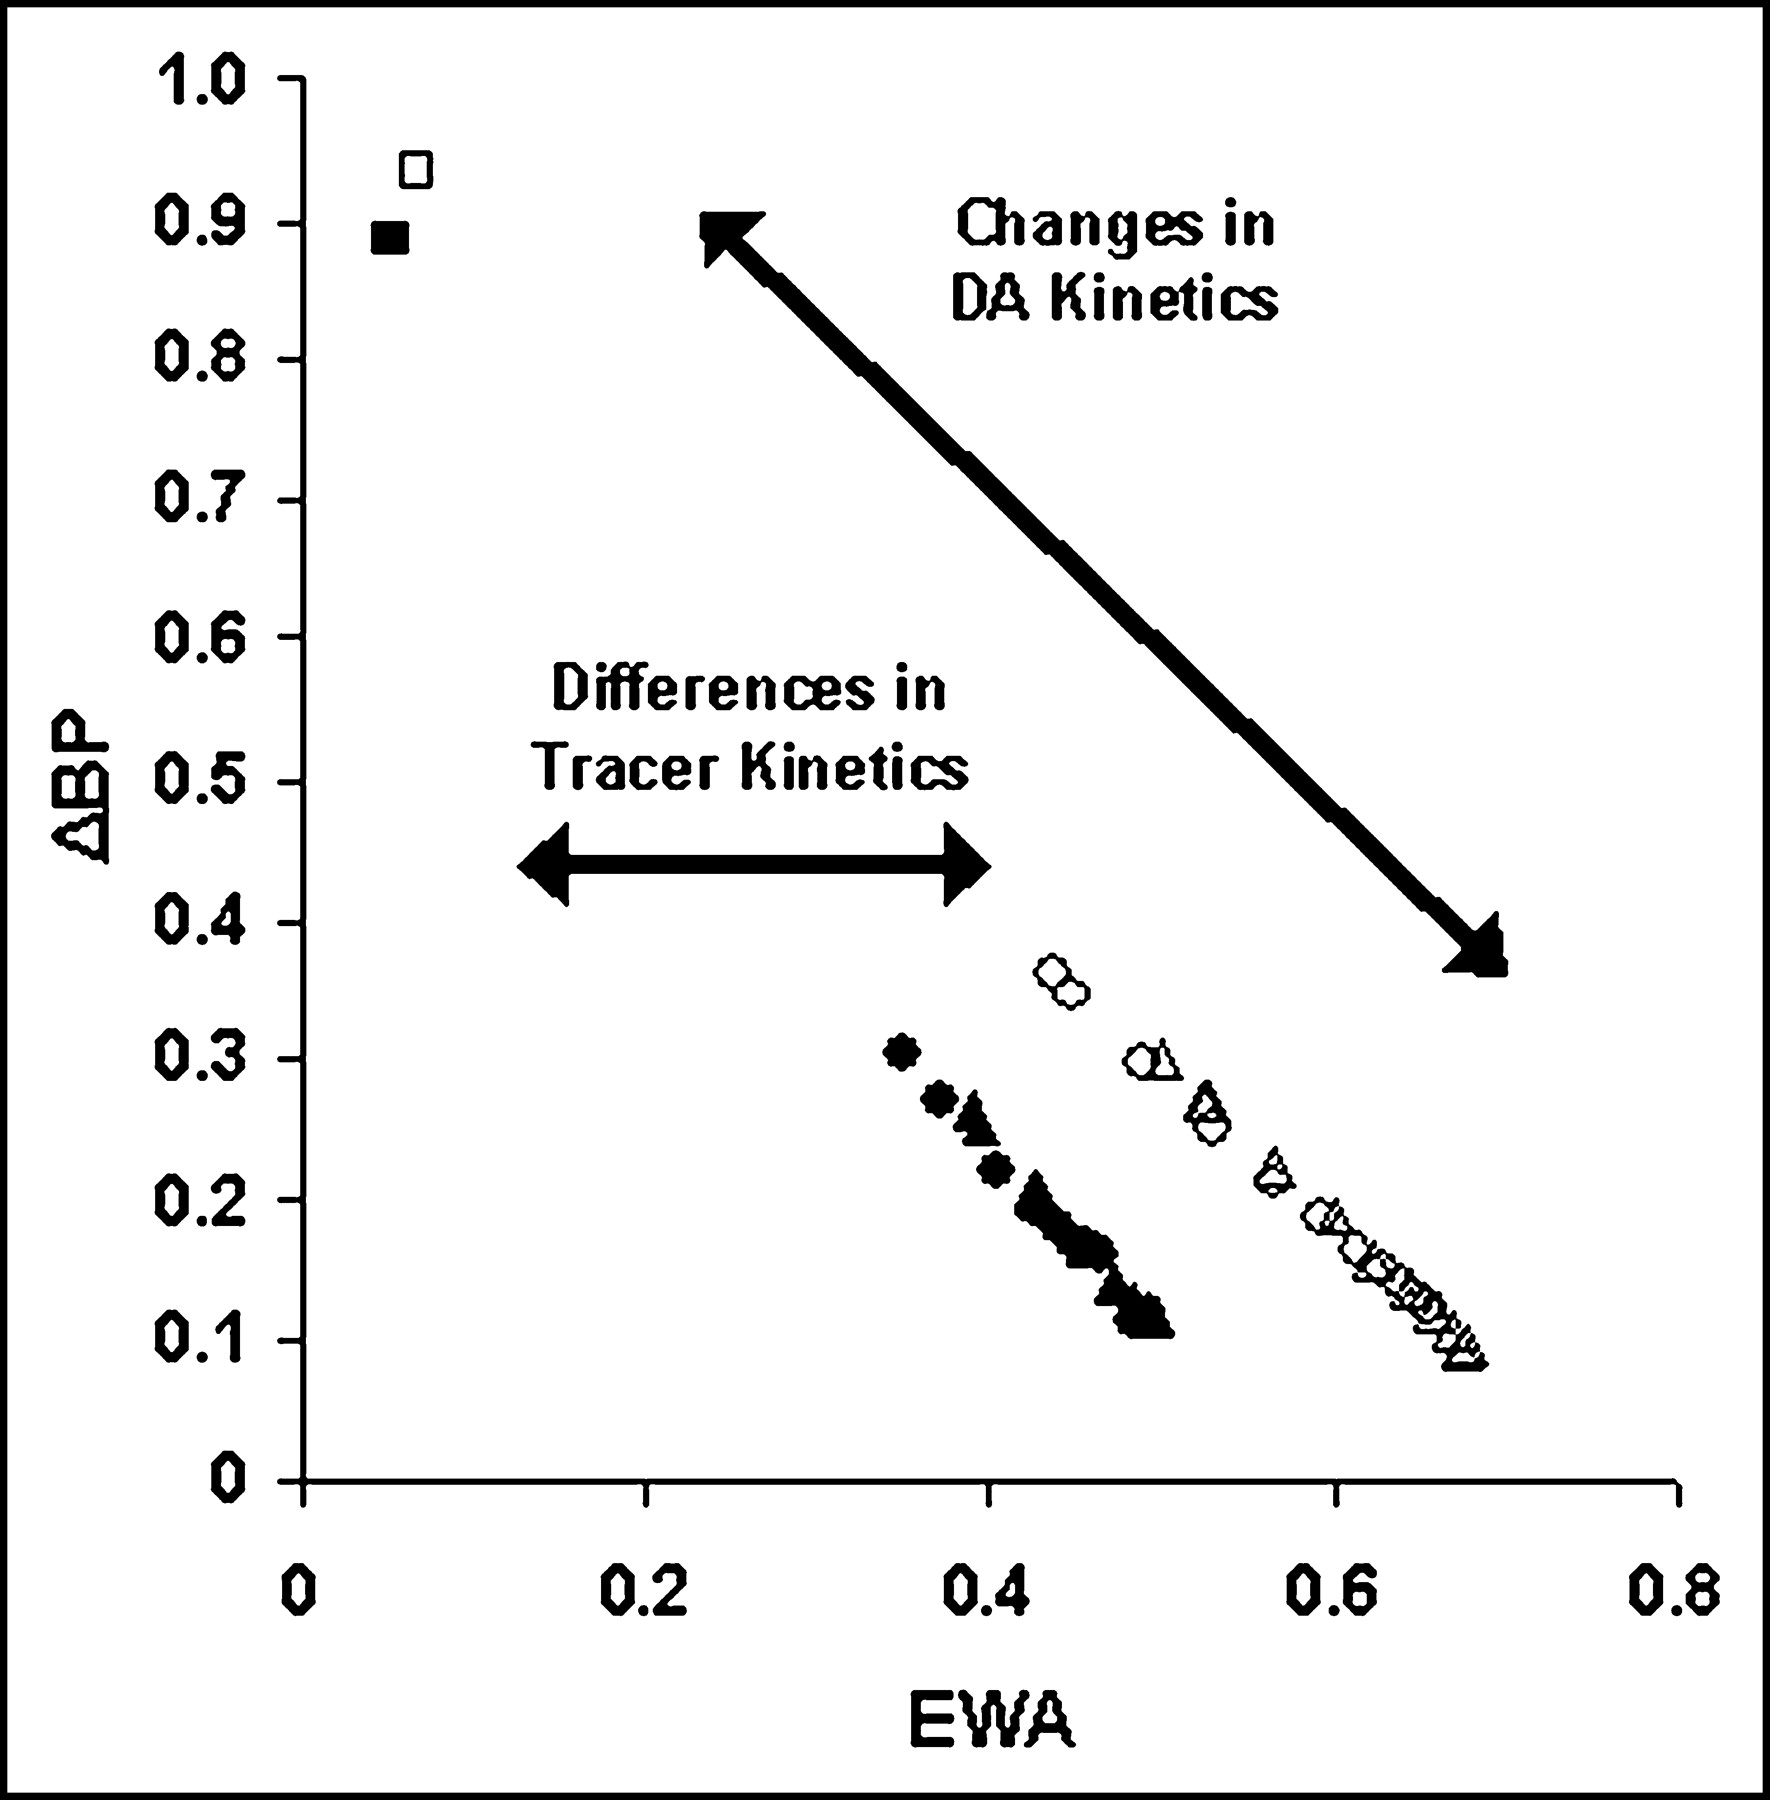
As a practical illustration of this concept, ΔBP as a function of EWA for 2 different tracers and many different DA responses are shown in Figure 6. The points on the plot of ΔBP versus EWA were calculated based on individual simulations as a means of verifying the linearity of the relationship in Equation 9. As with the integral of DA,
 FRAC(t) was approximated numerically by the integral from 0 to the end of the simulation. The curves of FRAC(t) for each simulation returned to 0 by the end of each study, so this approximation was deemed valid. The degree of interaction of FDA(t) and FRAC(t) determines the value of ΔBP for a given tracer and places it higher or lower along its respective contour line. As EWA increases, the calculated (or apparent) ΔBP declines linearly for a given tracer. Stated another way, anything that alters EWA will alter the measured change in BP from a baseline condition to a state with a neurotransmitter perturbation.

Correlation between ΔBP and EWA for multiple DA responses CDP I (sharp response; ▵, ▴) and CDP II (blunt response; ○, •) with 2 different versions of raclopride kinetics. Tracer A parameters are from Pappata et al. (35) (▴, •) and tracer B parameters were modified from Endres and Carson (21) (▵, ○). The 2 squares (▪, □) represent data points from simulations generated with a γ-variate DA perturbation with the following parameters: α = 1.5; β = 0.2; γ = 10,000; td = 1. This corresponds to a huge and physiologically implausible release of DA.
Relevance of EWA to Interpretation of Experimental Results
Results of our simulations suggest possible ambiguities in interpretation of experimental data, involving, for example, nonpharmacological stimulation of DA release. Consider a PET experiment in which subjects perform a cognitive task that is initiated simultaneously with a bolus administration of 11C-raclopride. Group 1 is the control sample, and group 2 is selected from a diagnostic population known to have a cognitive processing deficit, thought to be related to alterations (presumably decreases) in dopaminergic neurotransmission. The research hypothesis is that group 2 will have a significantly lower amount of DA released in a given area in response to the cognitive task, as measured by ΔBP. In practice, we would not be aware of the exact shapes of the DA release over time for either group; however, for purposes of illustration, suppose that the sharp curve in Figure 7 (td = 2 min; Fig. 5A) represents the DA response of group 1 to the cognitive task and that the blunt curve (td = 1 min; Fig. 5B) indicates the DA response of group 2. As shown in Figure 7C, if ΔBP is the only piece of information available about these relative DA responses between groups, then the incorrect conclusion would be that group 2 releases more DA than group 1 in response to the cognitive task. For this simulation, ΔBP for group 2 was 20% higher than ΔBP for group 1, even though group 1 released 20% more DA than group 2 (Fig. 7B). Differences in curve shape and timing led to greater EWA for the sharp DA response and, hence, as expected, ΔBP was smaller than the ΔBP calculated for the blunt DA response. In fact, if we posit that the DA takeoff in group 1 occurs 1 min earlier than that which is displayed in Figure 7A, the ΔBP for both groups would be equivalent (Fig. 5C, onset at 1 min). This confluence of circumstances would result in a type II error.

Simulation results from hypothetical experiment comparing plausible DA perturbations. (A) CDP I (sharp curve, solid line) and CDP II (blunt curve, dashed line) were used as DA perturbations. CDP I (sharp), DA takeoff t = 2 min; CDP II (blunt), DA takeoff t = 1 min after simulated bolus 11C-raclopride injection. (B) Corresponding DA release (left y-axis) and ΔBP (right y-axis) for curves in A. CDP I, ▴; CDP II, ○.
The measurement of altered BP in response to stimuli as an indication of change in neurotransmitter concentration is an advance in quantitative PET, although the simulation studies presented here demonstrate the degree to which ΔBP is sensitive to the combined timing effects of tracer and endogenous ligand as well as to the total amount of endogenous ligand released. The exact effect of these kinetic combinations on ΔBP can be predicted by what we call EWA, which follows from the thorough work of Endres and Carson (21). BP is only an average index of binding over time, so it is not surprising that ΔBP cannot distinguish between kinetically different neurotransmitter perturbations and merely relatively different amounts of neurotransmitter released. Given that neurochemical communication involves the convergence of multiple processes to generate patterns of quantal transmitter release, developing a method to capture the temporal patterns of these events presents a daunting challenge. Limitations of quantitative analyses such as ΔBP must be understood and considered when they are used to define or explain transient phenomena that occur in inherently complex systems.
CONCLUSION
Our simulations suggest that, in cases where the timing of ligand or tracer cannot be completely controlled from study to study, conclusions about amounts of endogenous neurotransmitter released as measured by ΔBP will be qualitative at best, and possibly worse. Implicit in these results is a caution for comparing ΔBPs resulting from pharmacological (or other) stimuli that exhibit different pharmacodynamic or pharmacokinetic profiles.
Acknowledgments
The authors thank the Whitaker Foundation for supporting this work (grant RG-02-0126).
Footnotes
Received Jul. 16, 2003; revision accepted Dec. 16, 2003.
For correspondence contact: Karmen K. Yoder, PhD, Research Institute 2, Room E 124, 950 W. Walnut St., Indianapolis, IN 46202.
E-mail: kkyoder{at}iupui.edu
REFERENCES
In this issue


Jump to section
Related Articles
Cited By...
- Reply to "The Value of Functional PET in Quantifying Neurotransmitter Dynamics"
- Modeling PET Data Acquired During Nonsteady Conditions: What If Brain Conditions Change During the Scan?
- Kinetic models for PET displacement studies
- Detection of transient neurotransmitter response using personalized neural networks
- Sex Differences in the Brain's Dopamine Signature of Cigarette Smoking
- Optimized In Vivo Detection of Dopamine Release Using 18F-Fallypride PET