


Abstract
The high-resolution research tomograph (HRRT) is a dedicated human brain PET scanner. The purpose of this study was to compare the quantitative accuracy of the HRRT with that of the clinical HR+ PET scanner and to assess effects of differences in spatial resolution between both scanners (∼2.7 mm and ∼7.0 mm for HRRT and HR+, respectively). Methods: Paired 11C-flumazenil scans of 7 healthy volunteers were assessed. For each volunteer, dynamic scans (including arterial sampling) were acquired on both scanners on the same day, thereby minimizing intersubject variability. Volume of distribution was generated using Logan plot analysis with plasma input. In addition, other plasma input, reference tissue (with pons as the reference tissue input), and parametric methods were included in the interscanner comparison. Results: Logan volume-of-distribution analysis of HRRT data showed higher values than that of HR+ data (slope with the intercept fixed at the origin of 1.14 ± 0.10 to 1.19 ± 0.10, depending on the HRRT reconstruction method used). Smoothing HRRT reconstructions with a 6-mm full width at half maximum gaussian kernel reduced this slope toward the line of identity (1.04 ± 0.11 to 1.07 ± 0.11), retaining good correlation between HR+ and HRRT data (r, ∼0.98). Similar trends were observed for other plasma input, reference tissue, and parametric methods. However, after reference matching the reference tissue models showed lower HRRT kinetic parameter values than HR+ values (slope with fixed intercept, 0.90 ± 0.10 to 0.94 ± 0.13). Conclusion: Higher values of pharmacokinetic parameter values, obtained from HRRT versus HR+ PET studies, indicate improved HRRT PET quantification primarily due to a reduction in partial-volume effects.
The availability of lutetium oxyorthosilicate/lutetium-yttrium oxyorthosilicate (LSO/LYSO) crystals has generated interest in new PET scanners that have higher spatial image resolution. The ECAT High-Resolution Research Tomograph (HRRT) (CTI/Siemens) is a dedicated human brain scanner with design features that enable high spatial image resolution combined with high sensitivity (1). The HRRT is the first commercially available PET scanner that uses a double layer of LSO/LYSO crystals to achieve photon detection with depth-of-interaction information.
To date, only a limited number of human brain studies have been performed using the HRRT (2–7). Most human brain studies have been acquired with clinical (whole-body) PET scanners, such as the ECAT EXACT HR+ (CTI/Siemens). Therefore, it is worthwhile to compare the accuracy of quantitative human HRRT studies with that of HR+ studies. The HR+ scanner has a single layer of bismuth germinate crystals. Over the years, its quantitative accuracy has been studied extensively (8–10).
A direct quantitative comparison between HRRT and HR+ has been performed in a limited way, using only phantoms (11). Recently, Leroy et al. (3) performed a comparative study between similar patient groups, matched in age, acquired on either an HR+ or an HRRT. Although this study showed good agreement between studies performed on HRRT and HR+ scanners, results may have suffered from intersubject variability, as no paired scans in the same subjects were performed. Moreover, as suggested in the study of Leroy et al. (3), further studies for a variety of other PET tracers would be needed to fully validate the quantitative potential of the HRRT.
The purpose of the present study was to compare the quantitative accuracy of the HRRT scanner with that of the HR+ scanner and to assess the effects of differences in spatial resolution between both scanners. Paired 11C-flumazenil brain scans in 7 healthy volunteers were assessed; that is, for each volunteer, images were acquired on both scanners on the same day, enabling a direct comparison between both PET scanners.
MATERIALS AND METHODS
Scanner Descriptions
The commercial HRRT, a dedicated high-resolution 3-dimensional (3D) human brain PET scanner, consists of 8 panel detectors (detector heads), which are arranged in an octagon (2). A detector head comprises 117 detector blocks, each cut into 8 × 8 crystal elements. Each block consists of 2 LSO/LYSO crystal layers to achieve photon detection with depth-of-interaction information. The spatial resolution is between 2.3- and 3.4-mm full width at half maximum (FWHM). The National Electrical Manufacturers Association NU 2-2001 sensitivity equals 39.8 kcps·kBq−1·mL−1 (12). The field of view measures 312 mm in diameter and 250 mm in the axial direction. For attenuation and scatter correction, transmission scans were acquired using a 740-MBq 2-dimensional (2D) fan-collimated 137Cs (662 keV) moving point source (13). A detailed description of the scanner, its reconstruction software, and its performance has been reported previously (1).
The HR+ consists of 4 rings of 72 bismuth germinate block detectors, arranged in a circle, and each detector block (as for the HRRT) is cut into 8 × 8 elements. The axial field of view measures 155 mm, with a patient port of 562 mm. The spatial resolution is between 4.3- and 8.3-mm FWHM, depending on the position in the scanner. The National Electrical Manufacturers Association NU 2-2001 sensitivity equals 21.9 kcps·kBq−1·mL−1 (14). For attenuation and scatter correction, transmission scans were acquired using three 220-MBq 68Ge rod (511 keV) sources. A detailed description of the scanner and its performance can be found elsewhere (9).
Test–Retest Study
Two 60-min dynamic scans (one on each scanner, in random order) were acquired for 7 healthy volunteers (age ± SD, 53 ± 16 y) immediately after administration of 11C-flumazenil (365 ± 34 MBq) with a specific activity of 54 ± 24 GBq mL−1. Administered doses and specific activities were not statistically significantly different between both scans (2-sided paired t test, P = 0.45 and P = 0.46, respectively). For the HRRT scanner, each emission scan was acquired in list mode and subsequently histogrammed into 16 time frames, with variable frame lengths (4 × 15, 4 × 60, 2 × 150, 2 × 300, and 4 × 600 s). For the HR+ scanner, emission scans were acquired in 3D mode and histogrammed online into 16 time frames according to the same scheme as for the HRRT. Before each emission scan (and tracer administration), a transmission scan was acquired for attenuation and scatter correction. In general, the attenuation-correction maps corresponded visually between the HR+ and the HRRT. However, as previously reported (15) the attenuation correction of the HRRT is reasonably accurate and corresponds well to that of the HR+. During the emission scan, continuous online arterial blood was sampled, using an automated blood-sampling device (16). At set times (5, 10, 15, 20, 30, 40, and 60 min after injection), continuous sampling was interrupted briefly to collect manual blood samples. After each sample was collected, the arterial line was flushed with heparinized sterile and isotonic saline. These manual sample data were used for calibrating the (online) blood sampler, measuring plasma and whole-blood ratios, and determining metabolite fractions (17,18). The fractions of metabolized and unchanged 11C-flumazenil corresponded with a previous report (19), and deviations between metabolite fractions on the HR+ and HRRT scanners were not statistically different (2-sided paired t test, P > 0.1). The metabolite-corrected arterial plasma time–activity curve was used as the input function for analyzing kinetic data. A head-immobilization device was used to limit head movement. To ensure that head positions were the same during each scan and keep head motion to a minimum, several points were marked with ink on each subject's skin and the alignment of each point was checked with projected laser lines every 5–10 min. In addition to the PET scan, a structural T1-weighted MRI scan for each subject, used to define regions of interest (ROIs), was acquired on a 1.5-T scanner (SONATA; Siemens Medical Solutions). The study was approved by the medical ethics committee of the VU University medical center, and all subjects gave written informed consent before scanning started.
Reconstructions
All reconstructed data were normalized and corrected for scatter, randoms, attenuation, decay, and dead time. For the HRRT scanner, all studies were reconstructed using both the newly implemented analytic 3D filtered backprojection (3D-FBP) algorithm, specifically customized and optimized for the HRRT (20), and the iterative 3D ordered-subsets weighted least-squares (3D-OSWLS) method, with 7 iterations and 16 subsets (21). 3D-FBP reconstructions are linear and therefore preferred for dynamic studies because these algorithms show no bias in frames with low noise-equivalent counts (NEC) (21–23). At present, this bias is still observed in some iteratively reconstructed HRRT images and depends on the methods and settings being used (11,21,23,24). However, as 3D-FBP reconstructions are noisier, 3D-OSWLS was also used in this study. 3D-OSWLS showed accuracy in patient studies similar to that of 3D-FBP (21) but resulted in a much lower pixel variance. For all HRRT reconstructions, randoms were estimated by the variance reduction on randoms algorithm (23,25). All HRRT-reconstructed images were also postsmoothed with a 6-mm FWHM gaussian kernel to match image resolution with that of the HR+ scanner.
For the HR+ scanner, 3D emission scans were rebinned using Fourier rebinning (FORE) and reconstructed using 2D-FBP. Again, 2D-FBP reconstructions are linear and are, therefore, preferred for quantitative dynamic PET studies (26).
Data Analysis
ROI Definition.
ROIs were defined using gray-matter (GM) and white-matter (WM) segmentation of the coregistered structural MRI scan to derive GM and WM subregions of 15 different manually defined ROIs, namely the pons (used only as a reference region) and the left and right regions of the thalamus; frontal, temporal, parietal, and occipital lobes; caudate; and putamen (Supplemental Figure 1; supplemental materials are available online only at http://jnm.snmjournals.org). GM data were used for all regions except the pons, in which total (GM plus WM) data were used. MRI scans were coregistered using the software package VINCI (Max Planck Institute for Neurologic Research). In addition, the VINCI software was used to coregister the HR+ scan onto the HRRT scan, using the HRRT image matrix dimensions to minimize loss in resolution. In this way, exactly the same ROIs can be projected on both scans. GM and WM segmentation was performed using Statistical Parametric Mapping (SPM5; Wellcome Department of Cognitive Neurology, University College London). Other ROIs were drawn by hand using DISPLAY software (Montreal Neurologic Institute). ROIs were then projected either onto parametric images to derive regional pharmacokinetic parameters or onto reconstructed images to derive time–activity curves for the various regions, which subsequently were used for pharmacokinetic modeling.
Pharmacokinetic Parameter Analysis.
Pharmacokinetic parameters were generated either from the various time–activity curves obtained using the ROI approach mentioned above or from parametric images generated using a parametric method. Parametric volume-of-distribution (VT) images were generated using Logan plot analysis with plasma input (27). In addition, VT images were generated using a basis function method (BFM) of a single-tissue-compartment model (28). Furthermore, reference tissue parametric distribution volume ratio (DVR) images were generated using Logan plot analysis (RLogan) with the reference tissue input function (pons) (29), and parametric binding potential (BPND) images were generated with receptor parametric mapping (RPM), again with the pons as the reference tissue. RPM (30) is a basis-function implementation of the simplified reference tissue model (31). The same kinetic methods were used on various time–activity curves obtained using the ROI approach mentioned earlier. All parametric images and kinetic data from time–activity curves were generated using the software package PPET (32).
Quantitative Accuracy Assessment.
HRRT-reconstructed images using various 3D reconstruction algorithms were compared with corresponding HR+ images reconstructed with 2D-FBP + FORE. From these images, regional and parametric pharmacokinetic parameters were derived and compared. The Pearson correlation coefficient (r), intercept (indicates possible bias), slope (indicates interscanner differences in quantification), slope with the intercept fixed at the origin, and r with the intercept fixed at the origin, calculated per subject, are reported as mean ± SD. In addition, the standardized uptake value (SUV) was calculated as the measured activity concentration divided by injected activity divided by body weight of the subject.
Interscanner Test–Retest Study Overview
HR+ and HRRT scanners were compared. HRRT data were reconstructed using both 3D-FBP and 3D-OSWLS. For the HRRT scanner, data were used as without and with (6-mm FWHM gaussian kernel) resolution matching. HR+ data were reconstructed using FORE + 2D-FBP. All reconstructed data were analyzed using the following kinetic modeling methods (either based on time–activity curves or based on pixel-by-pixel [parametric] images): Logan VT, BFM VT, RLogan DVR, and RPM BPND. In addition, SUV curves, metabolite fractions, and subject motion were analyzed to provide quality control.
RESULTS
Outliers
One subject showed poor correspondence between HR+ and HRRT data in all analyses. One of this subject's carotid arteries was not visible on the HRRT scans, and this subject showed motion (at least 5 mm) on the HR+ scans. Therefore, this subject was excluded from comparisons. For another subject, no metabolite data were available and therefore no metabolite-corrected plasma input function could be generated. This subject was used only for comparison of data obtained with reference tissue models.
Plasma Input Models
Time–Activity Curve Analysis.
Figure 1 shows the correlation between Logan-derived VT obtained with various HRRT reconstruction methods and the corresponding Logan-derived VT obtained with the HR+ for analyses based on time–activity curves. Table 1 shows mean Logan-derived VT values and absolute variability for each brain region and illustrates that the application of resolution matching improves test–retest values. Figure 1 and Table 2 illustrate that smoothing HRRT reconstructions with a 6-mm FWHM gaussian kernel improved slopes (with the intercept fixed at the origin) from 1.19 ± 0.10 to 1.07 ± 0.11 (3D-FBP) and from 1.14 ± 0.10 to 1.04 ± 0.11 (3D-OSWLS), retaining a high correlation between HR+ and HRRT (r, ∼0.98). Table 2 illustrates this effect for BFM-derived VT, in which slopes with the intercept fixed at the origin improved from 1.29 ± 0.23 to 1.04 ± 0.22 (3D-FBP) and from 1.11 ± 0.22 to 1.00 ± 0.21 (3D-OSWLS), with r values between 0.88 ± 0.05 and 0.98 ± 0.01.
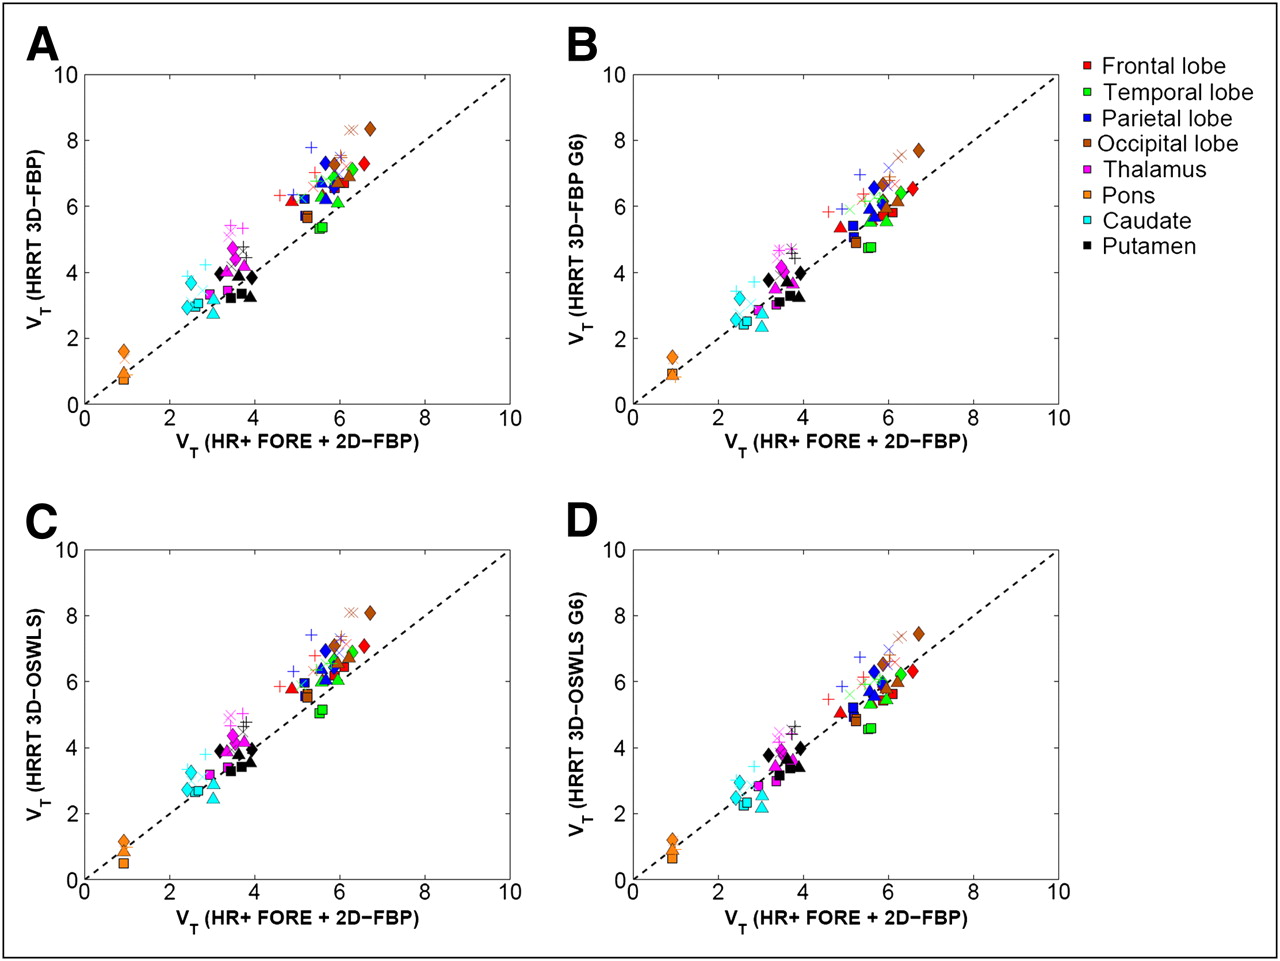
Correlation between Logan-derived VT obtained with various HRRT reconstruction methods and corresponding Logan-derived VT obtained with HR+ 2D-FBP + FORE: (A) 3D-FBP, (B) 3D-FBP G6, (C) 3D-OSWLS, and (D) 3D-OSWLS G6. Every symbol represents single subject; same symbol per subject represents different anatomic regions, each with different color (dashed line is line of identity). G6 = 6-mm FWHM gaussian kernel.
Plasma Input and Reference Tissue Kinetic Data Using Time–Activity Curve Analysis
Plasma Input Kinetic Data Using Time–Activity Curve Analysis
Parametric Image Analysis.
Correlation analyses of VT obtained with HRRT and corresponding HR+ Logan-derived parametric images are shown in Table 3. Smoothing HRRT data to approximate HR+ resolution improved the r from 0.91 ± 0.08 to 0.98 ± 0.01 (3D-FBP) and from 0.97 ± 0.01 to 0.98 ± 0.00 (3D-OSWLS). For parametric data, the slope with fixed intercept changed from 0.99 ± 0.12 to 1.07 ± 0.11 for 3D-FBP and from 1.07 ± 0.11 to 1.01 ± 0.10 for 3D-OSWLS when smoothing was applied. For BFM-derived VT, correlations improved in a way similar to those obtained with analyses based on time–activity curves. For 3D-FBP, the slope with the intercept fixed at the origin changed from 1.29 ± 0.20 to 1.09 ± 0.15, and r improved from 0.89 ± 0.12 to 0.98 ± 0.01. For 3D-OSWLS, a change from 1.16 ± 0.14 to 1.00 ± 0.10 was observed (r, ∼0.97).
Plasma Input Parametric Image Data
Reference Tissue Models
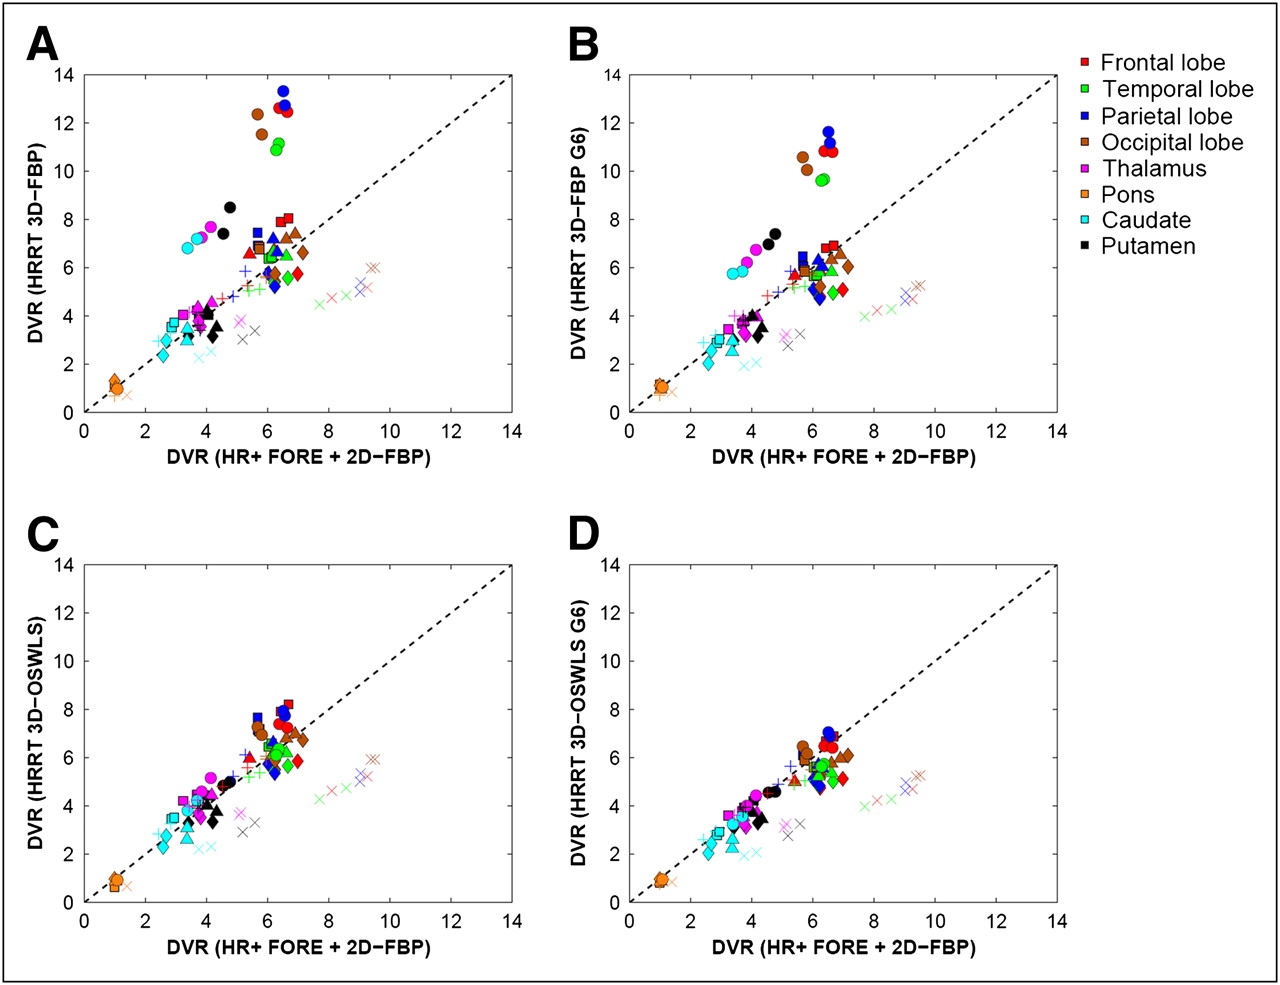
In Figure 2, correlations are shown for time–activity curve–based, RLogan-derived DVR between various HRRT reconstructions and the corresponding HR+ data. One subject (indicated by the symbol × in Fig. 2) showed poor performance for all reference tissue methods (using analyses based either on time–activity curves or on parametric images), and another subject (indicated by symbol ○ in Fig. 2) showed poor correspondence between HRRT 3D-FBP only (again for analyses based either on time–activity curves or on parametric images). These outliers resulted in high SD on slopes with a fixed intercept (0.18–0.54, Table 4), especially for 3D-FBP (0.37–0.54). The same trends were observed for RPM-derived BPND (Table 4) and for all results from the comparison of parametric reference tissue data (Table 5). However, trends similar to those observed in Tables 4 and 5 were observed for plasma input models (Tables 2 and 3), in which significant reductions in slopes with the intercept fixed at the origin were found by smoothing HRRT reconstructions with a 6-mm FWHM gaussian kernel (P < 0.05, 2-sided paired t test).

Correlation between RLogan-derived DVR obtained with various HRRT reconstruction methods and corresponding RLogan-derived DVR obtained with HR+ 2D-FBP + FORE: (A) 3D-FBP, (B) 3D-FBP G6, (C) 3D-OSWLS, and (D) 3D-OSWLS G6. Every symbol represents single subject; same symbol per subject represents different anatomic regions, each with different color (dashed line is line of identity). G6 = 6-mm FWHM gaussian kernel.
Reference Tissue Kinetic Data Using Time–Activity Curve Analysis (with Outliers)
Reference Tissue Parametric Image Data (with Outliers)
SUV Curve Analysis.
Figure 3 shows SUV curves of a typical subject with a standard dose (382 ± 28 MBq), subject × (with lower SUV and a lower dose of about 311 ± 13 MBq), and subject ○ (with a lower HRRT dose of 305 MBq) for reference tissue (pons) and a typical cortical region (temporal lobe). The first (typical) subject showed hardly any differences between HR+- and HRRT-reconstructed SUVs. Similar results were found for 3 other subjects; for another 2 subjects, the pons SUV curves deviated either for HRRT 3D-FBP (subject ○) or for both HRRT 3D-FBP and 3D-OSWLS (subject ×).

Reconstructed pons (A–C) and temporal lobe (D–F) SUV curves for HR+ and HRRT reconstruction methods for typical subject with a high dose (382 ± 28 MBq) (A, D), subject ○ with a low SUV and a low dose for HRRT (305 MBq) (B, E), and subject × with a low dose in general (311 ± 13 MBq) (C, F).
Time–Activity Curve Analysis.
After the outliers were removed (subject × for HR+ versus HRRT 3D-OSWLS and subjects × and ○ for HR+ versus HRRT 3D-FBP), reductions in slope with the intercept fixed at the origin were found for RLogan-derived DVR from time–activity curves (Table 6) by smoothing HRRT reconstructions with a 6-mm FWHM gaussian kernel, again retaining a lower SD on slopes with fixed intercept (0.10–0.15). Slopes with the intercept fixed at the origin lowered from 1.03 ± 0.12 to 0.94 ± 0.10 (3D-FBP) and from 1.04 ± 0.13 to 0.92 ± 0.10 (3D-OSWLS), with an r of 0.93 ± 0.02 to 0.96 ± 0.01. This effect was also observed for RPM-derived BPND, in which slopes with the intercept fixed at the origin decreased from 1.04 ± 0.14 to 0.92 ± 0.11 (3D-FBP) and from 1.04 ± 0.14 to 0.90 ± 0.10 (3D-OSWLS), with an r of 0.91 ± 0.10 to 0.96 ± 0.01. Table 1 also shows mean RPM-derived BPND values and absolute variability for each brain region. This table illustrates that, by applying resolution matching, test–retest values in general improve, except for in regions close to the skull (i.e., temporal and frontal lobes).
Reference Tissue Kinetic Data Using Time–Activity Curve Analysis (Without Outliers)
Parametric Image Analysis.
Table 7 shows RLogan data (excluding the outliers mentioned above) similar to those in Table 6, but with parametric data. Smoothing the HRRT data to approximate the HR+ resolution provided a good SD on slopes with a fixed intercept of 0.07–0.11. Slopes with the intercept fixed at the origin, however, were lower than those with analyses based on time–activity curves (parametric slopes changed from 0.89 ± 0.07 to 0.94 ± 0.10 for 3D-FBP and from 1.01 ± 0.11 to 0.93 ± 0.11 for 3D-OSWLS). For RPM-derived BPND, slopes and correlation always showed reduction (improvement) in slope. Slopes with the intercept fixed at the origin decreased from 1.04 ± 0.14 to 0.94 ± 0.13, with an r of 0.83 ± 0.15 to 0.96 ± 0.01 (3D-FBP), and from 1.08 ± 0.19 to 0.93 ± 0.15, with an r of 0.94 ± 0.03 to 0.97 ± 0.01 (3D-OSWLS).
Reference Tissue Parametric Image Data (Without Outliers)
DISCUSSION
Plasma Input Models
Smoothing HRRT-reconstructed images to obtain approximately the same resolution as that of the HR+ images resulted in quantitatively similar kinetic parameter values for both scanners, when using ROI-derived time–activity curve and plasma input (Fig. 1; Table 2), and an improvement in test–retest values (Table 1). This result is consistent with a previous phantom study (11) and a study by Leroy et al. (3). In the latter study, it was shown that the HRRT scanner, compared with the HR+ scanner, allowed for the recovery of higher kinetic parameter values (reference tissue BPND values) in the case of 11C-PE2I nortropane and an age-matched population. As suggested in that study, however, further studies for a variety of PET tracers would be needed to fully validate the quantitative potential of the HRRT. In the present study, an attempt was made to minimize intersubject variability by acquiring paired scans (i.e., using both the HR+ and the HRRT) in the same subjects. This study further substantiates the findings of Leroy et al. (3), validating the HRRT for a different radiotracer using a different tracer kinetic plasma input model.
When using parametric image data, Logan VT values obtained with the HRRT were lower than those obtained with the HR+ (Table 3). This was due to noise-induced bias when using the graphical Logan VT method (33). BFM does not suffer from noise-induced bias and, therefore, showed the same VT pattern for both ROI and parametric data.
The data presented in Table 1 showed poorer absolute-variability values than did data described in a previous report (19) (6.8%−19.1% instead of 4.6%−8.4%). This might be caused by the smaller population used in this study.
Consistent with the study of Leroy et al. (3), the present study illustrates that, on the basis of the higher resolution, higher kinetic parameter values can be obtained with the HRRT. Because these differences disappear after resolution matching, they are primarily a result of different partial-volume effects.
Reference Tissue Models
The data presented in Table 1 showed only slightly poorer absolute-variability values than did data in a previous report (19) (7.6%−20.0% instead of 6.5%−17.0%). One subject (subject ○) with a low administered HRRT dose (305 MBq, Fig. 3B) showed a noisier pons time–activity curve for 3D-FBP than for 3D-OSWLS. This subject appeared to be an outlier for all HRRT 3D-FBP–related kinetic reference tissue analyses (Figs. 2A and 2B), with substantially higher parameter values than for the corresponding HR+ data, especially after resolution matching. For example, RLogan DVR values for this particular subject, when compared with average RLogan DVR values for the other 4 subjects, were higher for HRRT 3D-FBP (4.6 ± 1.6 vs. 4.0 ± 1.4, respectively). This effect is likely explained by the lower SUV (2.7 ± 0.3 in pons time–activity curve peak) for all reconstructions and all scanners for that 1 subject than that for the other subjects (4.2 ± 1.3 in pons time–activity curve peak). Iterative HRRT 3D-OSWLS, which is less sensitive to noise, provided better correspondence between HR+ and HRRT data than did HRRT 3D-FBP, indicating that noise may affect reference tissue curves (low uptake curves) and care should be taken to administer sufficient activity in clinical HRRT studies.
In addition to the 3D-FBP outlier above, there was another subject (subject ×) who showed consistently higher parameter values for reference tissue analyses applied to HR+ reconstructions. For example, RLogan DVR values for this particular subject were higher for HR+ (6.1 ± 2.5) than were normal values for either HR+ 2D-FBP + FORE (4.3 ± 1.6) or HRRT (4.0 ± 1.4). This subject showed a slightly lower SUV tail (last 3 time frames; 0.16) than did other subjects scanned on the HR+ (0.30 ± 0.09). However, noise-equivalent count rates were not lower for this particular subject (2.97·107) than for the other subjects (3.27·107 ± 0.5·107). In addition, random fractions were not higher for this particular subject (9.5% vs. 8.8% ± 1.6% for the others). Therefore, the reason for the abnormal reference tissue parameters remains unknown.
After resolution matching, the reference tissue models showed lower HRRT parameter values than HR+ values (Fig. 3; Tables 4 and 5). This might be due to some bias in the HRRT reconstructions. In particular, reference tissue tracer concentrations are low (no specific binding) and are, therefore, more prone to bias (e.g., because of imperfections in the attenuation correction (15), scatter correction (11,34), or reconstruction (11,20,21,23,24) algorithms). Attenuation and scatter correction might also explain the somewhat poorer test–retest values for structures close to the skull, such as the frontal and temporal lobes. In addition, 2D simulations have shown that gap-filling strategies for the HRRT could cause a small negative bias in WM regions (such as pons) for 3D-FBP reconstructions (20). Furthermore, bias in HRRT 3D-FBP reconstructions might occur in cold regions when the contrast between background and cold region becomes too large (21).
However, as can be seen in Figures 2C and 2D and Tables 6 and 7, for most subjects a good correlation of DVR and BPND values was observed. Thus, the present study illustrates that higher values of kinetic reference tissue modeling data can be obtained using the HRRT as a result of the higher resolution (Tables 6 and 7), which is consistent with the findings of Leroy et al. (3).
Additional Remarks
Future improvements in (small) residual differences between the HR+ and the HRRT scanners can be expected when systematic bias, currently observed in short-duration HRRT frames for 3D iterative reconstruction algorithms (11,21,23,24), can be removed (e.g., using iterative reconstruction algorithms that allow for negative image values, such as the NEG-ML algorithm) (35). In addition, new attenuation-correction strategies that show less overestimation of the size of the skull and a fully 3D iterative scatter-correction algorithm might improve the quantitative accuracy of reference tissue models for the HRRT, because reference regions generally have a lower uptake and are, therefore, more sensitive for (small) inaccuracies in scatter corrections.
CONCLUSION
Higher parameter values were obtained with the HRRT than with the HR+ scanner using either plasma input or reference tissue models. However, the outcome of reference tissue model analysis may be affected by low counts in the reference region causing bias in reconstruction methods of the HRRT or by inaccuracies in the attenuation and scatter corrections. The improvement of these methods is currently one of the primary goals of the HRRT community. However, the higher pharmacokinetic parameter values observed in most subjects are primarily a result of the higher resolution of the HRRT, as differences of the HRRT, compared with HR+, disappear after resolution matching. Therefore, this study provides further evidence that the HRRT can be used for quantitative studies with a higher spatial resolution in a clinical setting.
Acknowledgments
We thank Jurgen E.M. Mourik for his useful comments and suggestions; Nelleke Tolboom, Saskia P.A. Wolfensberger, and Jochem P. Bremmer for their assistance in acquiring subject data; the technology staff of the Department of Radiology for the acquisition of the MRI data; and the radiochemistry and technology staff of the Department of Nuclear Medicine & PET Research for the production of isotopes and acquisition of PET data. This work was financially supported by the Netherlands Organization for Scientific Research (NWO), VIDI grant 016.066.309.
Footnotes
-
COPYRIGHT © 2009 by the Society of Nuclear Medicine, Inc.
References
- Received for publication September 29, 2008.
- Accepted for publication January 15, 2009.
In this issue


Jump to section
Related Articles
Cited By...
- Impact of PET Reconstruction on Amyloid-{beta} Quantitation in Cross-Sectional and Longitudinal Analyses
- Quantification of [11C]ABP688 binding in human brain using cerebellum as reference region: biological interpretation and limitations
- Impact of PET reconstruction on A{beta}-amyloid quantitation in cross-sectional and longitudinal analyses
- High-Resolution Silicon Photomultiplier Time-of-Flight Dedicated Head PET System for Clinical Brain Studies
- Regional Neuronal Network Failure and Cognition in Late-Onset Sporadic Alzheimer Disease
- Cerebral Blood Flow and Glucose Metabolism Measured With Positron Emission Tomography Are Decreased in Human Type 1 Diabetes
- Altered GABAA Receptor Density and Unaltered Blood-Brain Barrier Transport in a Kainate Model of Epilepsy: An In Vivo Study Using 11C-Flumazenil and PET
- Observation of Glucose Metabolism in the Thalamic Nuclei by Fusion PET/MRI