


Abstract
(−)-N-11C-propyl-norapomorphine (11C-NPA) is a new dopamine agonist PET radiotracer that holds potential for imaging the high-affinity states of dopamine D2-like receptors in the living brain. The goal of this study was to develop and evaluate analytic strategies to derive in vivo 11C-NPA binding parameters. Methods: Two baboons were scanned 4 times after 11C-NPA injections. The metabolite-corrected arterial input functions were measured. Regional brain time-activity curves were analyzed with kinetic and graphical analyses, using the arterial time-activity curve as the input function. Data were also analyzed with the simplified reference-tissue model (SRTM) and graphical analysis with reference-region input. Results: 11C-NPA exhibited moderately fast metabolism, with 31% ± 5% of arterial plasma concentration corresponding to the parent compound at 40 min after injection. Plasma clearance was 29 ± 1 L/h, and plasma free fraction (f1) was 5% ± 1%. For kinetic analysis, a 1-tissue compartment model (1TCM) provided a good fit to the data and more robust derivations of the tissue distribution volumes (VT, in mL/g) than a 2-tissue compartment model (2TCM). Using 1TCM, VTs in the cerebellum and striatum were 3.4 ± 0.4 and 7.5 ± 2 mL/g, respectively, which led to estimates of striatal binding potential (BP) of 4.0 ± 1.1 mL/g and striatal equilibrium specific-to-nonspecific partition coefficient (V3″) of 1.2 ± 0.2. VT values derived with graphical analysis were well correlated with but slightly lower than VT values derived with kinetic analysis. V3″ values derived with SRTM were well correlated with but slightly higher than V3″ values derived with kinetic analysis. Using any method, a significant difference was detected in BP and V3″ values between the 2 animals. It was determined that 30 min of scanning data were sufficient to derive V3″ values using kinetic, graphical (arterial input and reference-region input), and SRTM analyses. Conclusion: This study indicates that 11C-NPA is a suitable PET tracer to quantify the agonist high-affinity sites of D2-like receptors.
The dopamine (DA) system plays an important role in the modulation of a large number of neuronal functions, including movement, drive, and reward. Alterations of DA transmissions are involved in numerous neuropsychiatric conditions, such as Parkinson’s disease, schizophrenia, and substance abuse. DA receptors belong to 2 families: D1-like (including D1 and D5 receptors) and D2-like (including D2, D3, and D4 receptors) (1,2). Like all G-protein-linked receptors, the affinity of D2-like receptors for agonists is affected by the coupling of the receptors with G proteins. The high-affinity sites (D2high) are G protein-coupled, whereas the low-affinity sites (D2low) are those uncoupled with G protein. In vitro, approximately 50% of D2 receptors are configured in the D2high state (3–7).
Over the years, a large number of antagonists, such as N-11C-methylspiperone and 11C-raclopride, have been developed as radiotracers for imaging DA D2-like receptors with PET. Being antagonists, these radiotracers bind with equal affinity to both the high- and the low-affinity configurations of the D2 receptors. Therefore, these tracers do not provide information about in vivo affinity states of D2 receptors for agonists.
The development of a D2 receptor agonist PET radiotracer is desirable for several reasons. First, the binding of such a radiotracer would provide information about in vivo affinity of D2 receptors for agonists in normal and disease states. Second, the in vivo binding of such a radiotracer is expected to be highly sensitive to endogenous competition and might therefore provide a superior imaging tool for probing fluctuations in endogenous DA (8).
Hwang et al. (9) recently reported a procedure to radiolabel the potent DA D2 agonist (−)-N-propyl-norapomorphine (NPA) with 11C, as well as on initial experiments in baboons using 11C-NPA. NPA is a potent agonist at D2 and D3 receptors. It displays affinities of 0.27 nmol/L for D2high and 26 nmol/L for D2low (3). In baboons, 11C-NPA demonstrated a rapid brain uptake with selective accumulation in the striatum, as evidenced by a striatal-to-cerebellar activities ratio of 2.86 ± 0.15 at 45 min after injection. Striatal uptake was decreased to the level of cerebellar uptake after pretreatment with the D2 receptor antagonist haloperidol, indicating that the striatal uptake of 11C-NPA was saturable and selective for D2-like receptors. Thus, 11C-NPA appeared to be a promising agonist radiotracer to label D2high sites. Furthermore, experiments in rodents indicate that the in vivo binding of 3H-NPA is more vulnerable to endogenous competition by DA than is 11C-raclopride (10).
The goal of the present study was to develop and evaluate analytic strategies to derive in vivo 11C-NPA binding parameters. A set of 8 PET experiments was performed on 2 baboons; both the metabolite-corrected arterial input function and the regional brain time-activity curves were measured. Data were first analyzed with compartmental kinetic analysis using the metabolite-corrected arterial time-activity curve as the input function. Both 1- (1TCM) and 2-tissue compartment models (2TCM) were evaluated. Data also were analyzed with graphical analysis, using the arterial input function. Finally, data were analyzed with graphical analysis, using a reference-region input and the simplified reference-tissue model (SRTM), both of which permit the derivation of binding parameters without measurement of arterial input function.
MATERIALS AND METHODS
Radiolabeling
The radiosynthesis of 11C-NPA was performed according to our previously published procedure (9), with minor modifications in the purification procedure. Briefly, the crude reaction mixture was diluted with aqueous HCl and passed through a C18 Sep-Pak (Waters). The Sep-Pak was washed with diluted HCl (0.1 mol/L, 10 mL), and the tracer was recovered from the Sep-Pak using 1.5 mL ethanol. The ethanol solution was purified by semipreparative high-pressure liquid chromatography (HPLC) using an ODS-prep column (10 μm, 250 × 10 mm; Phenomenex) and a solvent mixture of 20% acetonitrile and 80% 0.1 mol/L ammonium formate with 0.5% acetic acid as previously described (9). The HPLC product fraction was collected, added to a diluted HCl solution (30 μmol/L, 100 mL) and passed through a C-18 Sep-Pak. The Sep-Pak was washed with 5 mL 0.1 mol/L HCl and 5 mL water. The product was recovered from Sep-Pak with ethanol (1 mL) into a sample vial containing 100 μL 3 mol/L HCl. A small portion of the solution was analyzed by analytic HPLC to determine the radiochemical purity and specific activity. The remainder of the solution was diluted with saline and filtered through a sterile 0.22 μm filter, and collected in a sterile vial.
PET Imaging Protocol
Two adult male baboons (weights: A = 30 kg, B = 20 kg) were imaged 4 times on different days with 11C-NPA. Experiments were performed according to protocols approved by the Columbia-Presbyterian Medical Center Institutional Animal Care and Use Committee. Fasted animals were immobilized with ketamine (10 mg/kg intramuscularly) and anesthetized with 1.8% isoflurane through an endotracheal tube. Vital signs were monitored every 10 min, and the animals’ temperatures were kept constant at 37°C with heated water blankets. An intravenous perfusion line was used for hydration and injection of radiotracers and nonradioactive drugs. A catheter was inserted in a femoral artery for arterial blood sampling. The head was positioned at the center of the field of view (FOV) as defined by imbedded laser lines. PET imaging was performed with an ECAT EXACT HR+ scanner (Siemens/CTI). In 3-dimensional mode, this camera provides an in-plane resolution of 4.3, 4.5, 5.4, and 8.0 mm in full width at half maximum at distances of 0, 1, 10, and 20 cm from the center of the FOV, respectively (11). A 10-min transmission scan was obtained before radiotracer injection for attenuation correction. Activity was injected intravenously over a 30-s period. Emission data were collected in 3-dimensional mode for 91 min as 21 successive frames of increasing duration (6 × 10 s and 2 × 1, 4 × 2, 2 × 5, and 7 × 10 min).
Input Function Measurements
Arterial samples were collected with an automated blood sampling system every 10 s for the first 2 min, every 20 s for the next 2 min, and manually thereafter at various intervals. A total of 29 samples was collected. After centrifugation (10 min at 1,100g), plasma was collected and plasma activity was measured in 0.2-mL aliquots using a γ-counter (Wallac 1480 Wizard 3M Automatic γ-counter; Perkin-Elmer).
Selected samples (n = 5 per study, collected at 1, 4, 12, 40, and 80 min after radiotracer administration) were processed by HPLC to determine the fraction of activity associated with the unmetabolized parent compound. Ascorbic acid (0.01 g/mL blood) was added to these blood samples to stabilize 11C-NPA. After centrifugation, plasma (0.5 mL) was pipetted into 1 mL methanol in a small centrifuge tube. The content of the tube was mixed vigorously and centrifuged (14,000g for 4 min). The liquid phase was separated from the precipitates. Activity in 0.1 mL of the liquid phase was counted, and the rest was analyzed by HPLC. The HPLC eluate was fraction collected in 12 counting tubes (2.0 mL each). The HPLC system consisted of a model 510 isocratic pump (Waters), a Rheodyne injector equipped with a 2-mL sample loop (Perkin-Elmer), a C18 analytic column (ODS-prep, 10 μmol/L, 4.6 × 250 mm; Phenomenex), a Flow Cell γ-detector (Bioscan), and a Spectra/Chrom CF-1 fraction collector (Fisher Scientific). The column was eluted with a mixture of 18% acetonitrile in aqueous 0.1 mol/L ammonium formate with 0.5% acetic acid at a flow rate of 2 mL/min. Before plasma sample analysis, the retention time of the parent tracer was established by injection of a small amount of the tracer into the HPLC system.
The parent fraction was calculated as the ratio of the activity in the fractions containing the parent to the total activity collected in all the fractions. A biexponential function was fitted to the 5 measured parent fractions and used to interpolate the values between and after the measurements. The smallest exponential of the fraction of the parent curve (λpar) was constrained to the difference between the λcer, the terminal rate of washout of the cerebellar activity, and the λtot, the smallest elimination rate constant of the total plasma (12). The input function was then calculated as the product of the total counts and the interpolated fraction parent at each time point. The measured input function values were fitted to a sum of 3 exponentials, and the fitted values were used as inputs for kinetic analyses. The clearance of the parent compound (CL, in L/h) was calculated as the ratio of the injected dose to the area under the curve of the input function extrapolated to infinity (13,14). The initial plasma distribution volume (Vbol, in L) was calculated as the ratio of the injected dose to peak plasma concentration.
For the determination of the plasma free fraction (the fraction of unmetabolized radioligand that is not protein bound [f1, unitless]), 0.2-mL aliquots of plasma (collected before tracer injection and spiked with the radiotracer) in triplicates were pipetted into ultrafiltration units (Amicon Centrifree; Millipore) and centrifuged at room temperature for 20 min at 1,100g (15). The radioactivities of the plasma, the ultrafiltrate, and the filtration unit were counted, and f1 was calculated as the ratio of the ultrafiltrate activity concentration (in μCi/μL) to the plasma activity concentration (in μCi/μL).
Image Analysis
An MR image of each baboon’s brain was obtained for the purpose of identifying the regions of interest (ROIs) (T1-weighted axial MRI sequence, acquired parallel to the anterior-posterior commissure; repetition time = 34 msec; echo time = 5 msec; flip angle of 45°; slice thickness = 1.5 mm; 0 gap; matrix = 1.5 × 1.0 × 1.0 mm voxels).
Two regions were delineated on the MR image: the cerebellum (CER), a region with negligible density of D2-like receptors, and the striatum (STR), the region with the highest density of D2-like receptors. Previous haloperidol blocking experiments with 11C-NPA failed to detect any significant displaceable 11C-NPA binding in extrastriatal regions in baboons (9). Thus, the striatum was the only ROI analyzed.
PET emission data were attenuation corrected using the transmission scan, and frames were reconstructed using a Shepp filter (cutoff, 0.5 cycle per projection ray). Reconstructed image files were then processed using the image analysis software MEDx (Sensor Systems, Inc.). An image was created by summing all the frames, and this summed image was used to define the registration parameters for use with the MR image, using a between-modality automated image registration (AIR) algorithm (16). Registration parameters were then applied to the individual frames for registration to the MRI dataset. Regional boundaries were transferred to the individual registered PET frames, and the time-activity curves were measured and decay corrected. Right and left regions were averaged. For a given animal, the same regions were used for all experiments. The contribution of plasma total activity to the regional activity was calculated assuming a 5% blood volume in the ROI and subtracted from the regional activity before analysis (17).
Quantitative Analysis
Outcome Measures.
The regional tissue distribution volume (VT, in mL/g) was defined as the ratio of the ligand concentration in a region (CT, in μCi/g) to the concentration of the unmetabolized ligand in the arterial plasma (CA, in μCi/mL) at equilibrium and expressed as:
 Eq. 1
Eq. 1
In the cerebellum, a region with negligible D2-like receptors, only the free and nonspecifically bound 11C-NPA contributed to the VT (i.e., in the cerebellum, VT was equal to the nondisplaceable distribution volume of 11C-NPA). In the striatum, free, nonspecifically bound and specifically bound 11C-NPA contributed to the VT. The nondisplaceable distribution volumes were assumed to be identical in the cerebellum and the striatum.
The binding potential (BP) was derived as the difference between striatal and cerebellar VT. BP is related to receptor parameters by:
 Eq. 2 where Bmax is the concentration of available sites (in nmol/g tissue) and KD is the in vivo equilibrium dissociation constant of the radiotracer (in nmol/mL brain water) (18).
The other outcome measure of interest was the equilibrium specific-to-nonspecific partition coefficient (V3″). V3″ was calculated as the ratio of BP to VT CER and is related to receptor parameters by:
 Eq. 3 where f2 is the free fraction in the nonspecific distribution volume of the brain (f2 = f1/VT CER) (18).
Parameter Estimation.
Four methods were used for parameter estimations. The first 2 methods (kinetic and graphical analysis) used the arterial time-activity curve as the input function. The third and fourth methods (SRTM and graphical analysis with reference-region input) derived the input function information from the cerebellar time-activity curve.
Kinetic Analysis.
Regional VT was derived by kinetic analysis of the regional time-activity curves using the metabolite-corrected arterial plasma concentrations as the input function, according to a 1TCM or a 2TCM. Kinetic parameters (K1 and k2 for 1TCM; K1–k4 for 2TCM) were derived by nonlinear regression using a Levenberg-Marquardt least-squares minimization procedure implemented in MATLAB (The Math Works, Inc.) as described elsewhere (19). In the 1TCM, K1 (in mL/[g · min]) and k2 (in 1/min) are the rate constants governing the transfer of the ligands in and out of the brain, respectively. In the 2TCM, K1 and k2 are the rate constants governing the transfer of the ligands in and out of the nondisplaceable compartment, whereas k3 (in 1/min) and k4 (in 1/min) describe the rate of association and dissociation to and from the receptors, respectively.
In the 1TCM, VT was derived from kinetic parameters as:
 Eq. 4
Eq. 4
In the 2TCM, VT was derived from kinetic parameters as:
 Eq. 5
Eq. 5
In both cases, BP and V3″ were derived using Equations 2 and 3. Using an unconstrained 2TCM, the Levenberg-Marquardt algorithm failed for both the striatum and cerebellum in all 8 datasets, because some kinetic parameters assumed negative values. Therefore, a constrained (k > 0) sequential quadratic programming algorithm (a quasi-Newton method, implemented as the function “constr.m” in MATLAB) was used. Given the unequal sampling over time (increasing frame acquisition time from the beginning to the end of the study), the least-squares minimization procedures were weighted by frame duration.
Graphical Analysis.
Regional time-activity curves were graphically analyzed using the method of Logan et al. (20). This method allows the determination of the regional VT of reversible ligands without assuming a specific compartmental configuration, because the operational equation is the same whether a 1TCM or 2TCM model is assumed. BP and V3″ were derived using Equations 2 and 3.
Simplified Reference Tissue Method (SRTM).
To test the feasibility of quantification of 11C-NPA V3″ without collecting arterial plasma samples, SRTM was implemented (21). In this approach, the arterial input function is not explicitly measured but appears implicitly through its effect on a reference region. The estimated parameters are R1 (equal to the ratio of K1 in STR to K1 in CER) and k2 and V3″, with the same definitions as in previous models. SRTM was implemented after vascular correction, to facilitate comparison with results from kinetic analysis using the arterial input function. R1, k2, and V3″ were determined by nonlinear least-squares minimization as in kinetic methods using the arterial input functions. The least-squares fits were weighted by frame duration.
Graphical Analysis with Reference-Region Input.
Regional time-activity curves were also analyzed using the reference region as input, as described by Logan et al. (22) to derive V3″. This approach utilizes an implicit representation of the input function through its relationship to the reference-region time-activity curve and is the graphical analysis analog of the reference-region approach described previously.
Determination of Minimal Scanning Time
Experimental data were collected for 91 min. For all 4 methods of analysis the minimal scanning time required to achieve time-independent derivation of striatal V3″ was evaluated by fitting the time-activity curves to shorter datasets, representing total scanning times of 81, 71, 61, 51, and 41 min. The resulting estimates of V3″ were normalized to the V3″ derived with the 91-min dataset. For each scan duration, the average and SD of the 8 normalized V3″ values were calculated. Time independence was considered achieved when 2 criteria were fulfilled (23): the average normalized V3″ was between 95% and 105% of the reference V3″ (small bias), and the SD of the normalized V3″ was <10% (small error). For the kinetic and graphical analyses, the minimal scanning times required to reach the time-independent derivation of VT in the cerebellum and striatum were derived using the same criteria.
Statistical Analysis
Goodness of fit of models with different levels of complexity were compared using the Akaike Information Criterion (AIC) (23) and the F test (25). The SEs of the rate constants were given by the square roots of the diagonal of the covariance matrix C (26) and expressed as percentages of the parameters (coefficient of variation [%CV]). The SE of VT was calculated as the square root of ▿kVT′C▿kVT, where ▿kVT is the gradient of VT with respect to the rate constants (25). Relationships between outcome measures derived with different methods were evaluated by linear regressions. The significance of differences between estimates derived by various methods was evaluated using paired t tests. Differences between baboons were estimated by paired t tests. Effects of differences in baboons’ sizes were calculated as the absolute difference between the means divided by the average SDs. A 2-tailed probability of 0.05 was selected as the significance level.
RESULTS
Injected Doses
Mean ± SD and ranges of injected doses, specific activities at time of injections, and injected masses were 211 ± 74 MBq (range, 126–363 MBq), 52 ± 62 GBq/μmol (range, 8–193 GBq/mmol), and 0.13 ± 0.14 μg/kg (range, 0.01–0.43 μg/kg).
Plasma Analysis
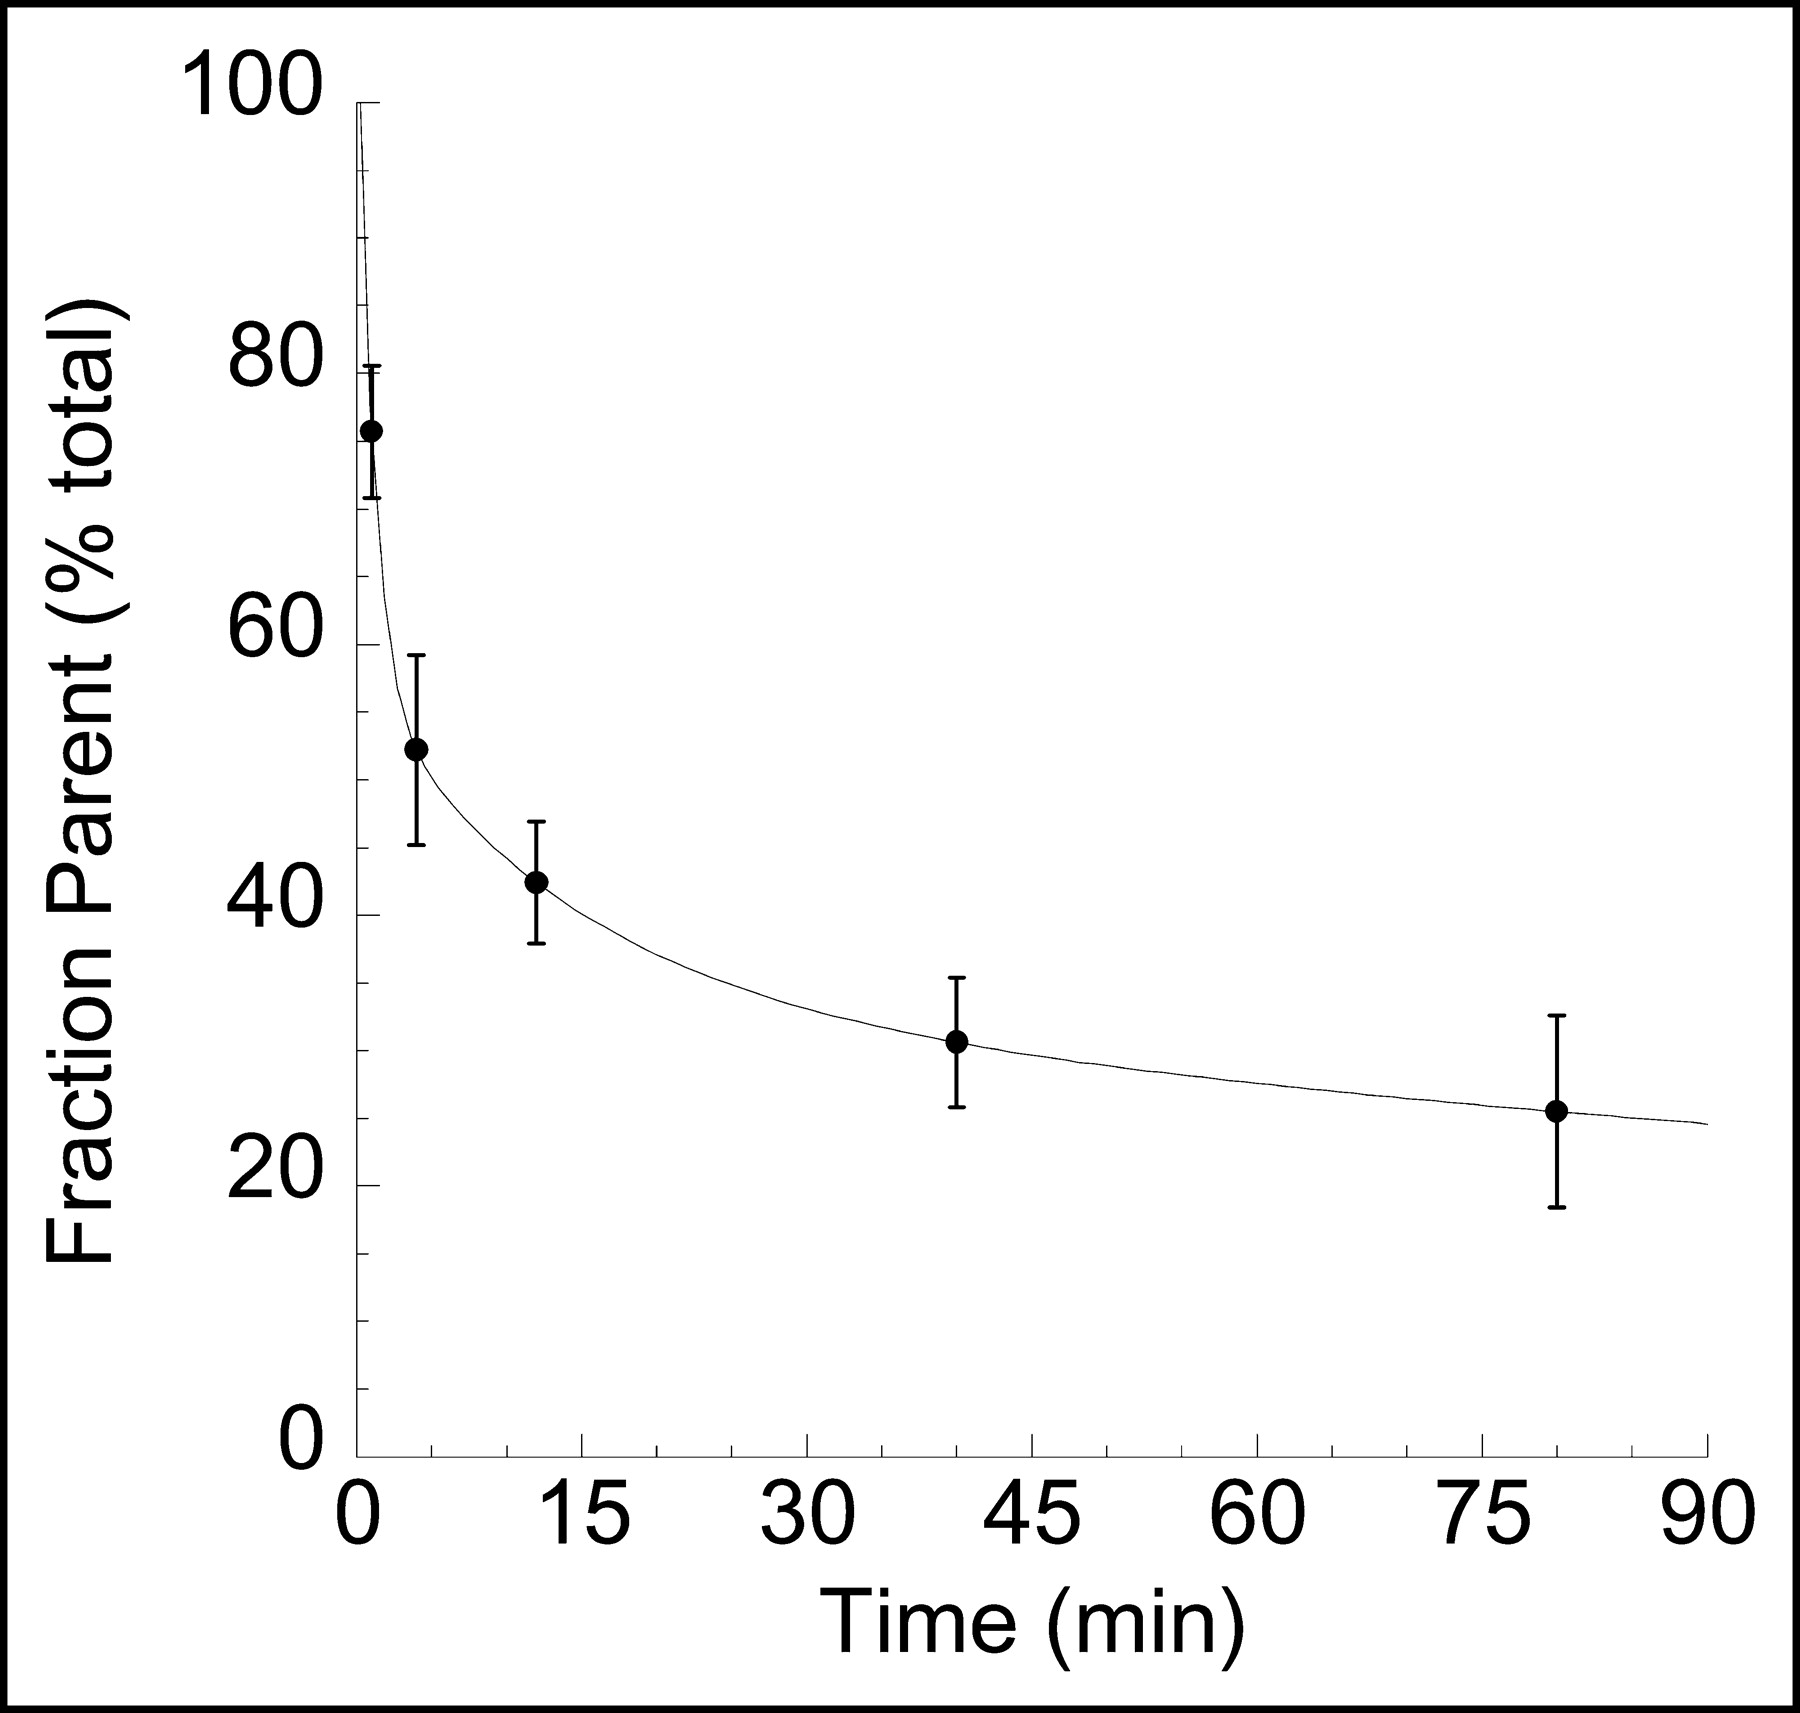
Plasma metabolite analysis after injection of 11C-NPA revealed no lipophilic metabolites. Figure 1 shows the percentage of parent compound over time. At 40 min, the parent compound contributed to 31% ± 5% of the total activity. By both AIC and F test, a sum of 3 exponentials was selected to fit the arterial parent time-activity curves (Fig. 2). Values of f1, Vbol, and CL, are provided in Table 1.

Mean ± SD fraction of plasma activity corresponding to the parent compound over time, after injection of 11C-NPA in baboons (n = 8).

Plasma 11C-NPA measurements in a typical experiment. ○ = total plasma activities; • = activities corresponding to unmetabolized 11C-NPA. Lines are values fitted to a sum of 3 exponentials.
11C-NPA Peripheral Parameters*
Brain Analysis
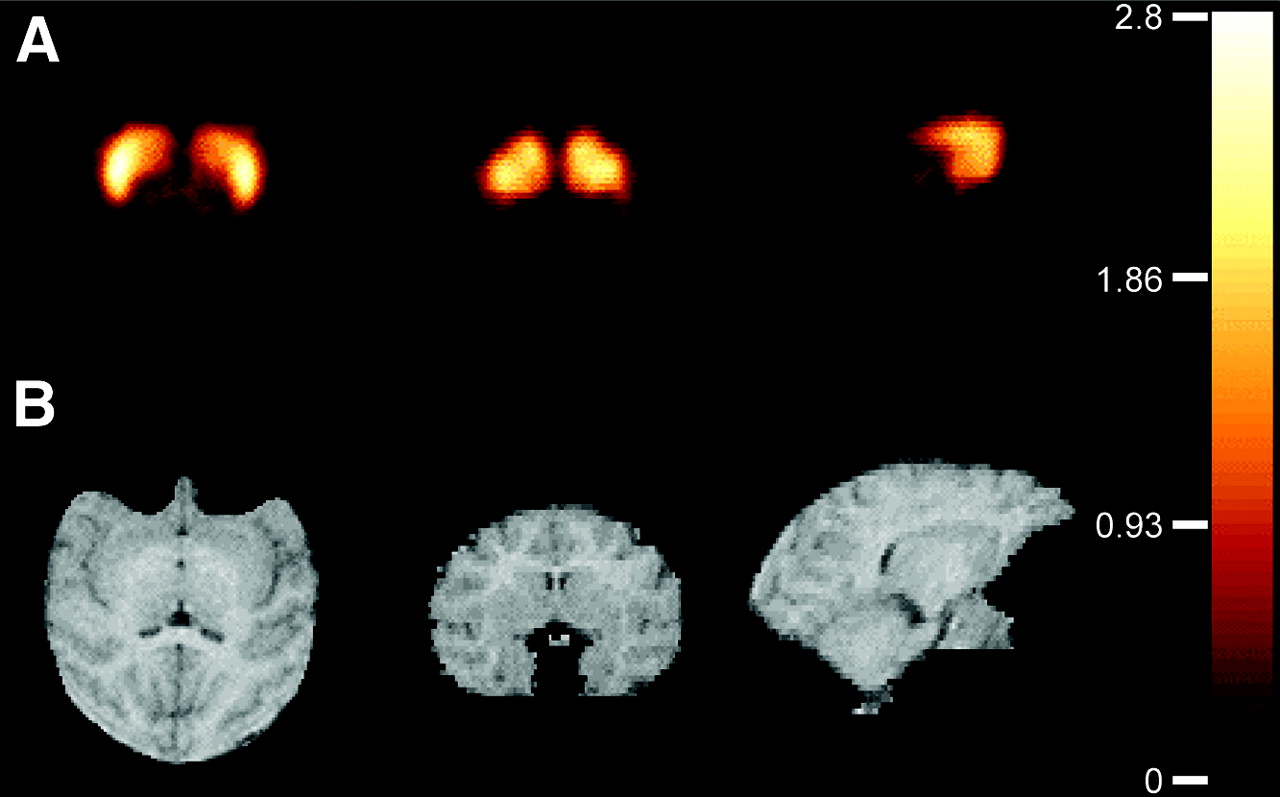
Representative V3″ images using a 1TCM with arterial input and a basis function approach (27) are shown in Figure 3. Activities in the cerebellum and striatum displayed early peaks (at 2 ± 1 and 8 ± 2 min, respectively), followed by a rapid washout (Fig. 4).

Voxelwise V3″ map from a study (A) with coregistered MRI (B) of corresponding slices. Transaxial, coronal, and sagittal views are shown (left to right), all at the level of the striatum. These images were created by deriving VT in each voxel with kinetic analysis (1TCM) and applying Equation 3 on each voxel. Colors were scaled to V3″ values (0–2.8). Kinetic analysis was performed using a basis function approach (27) in the MATLAB environment on a 1.2-GHz personal computer running the Linux operating system and completed in approximately 15 min per brain.
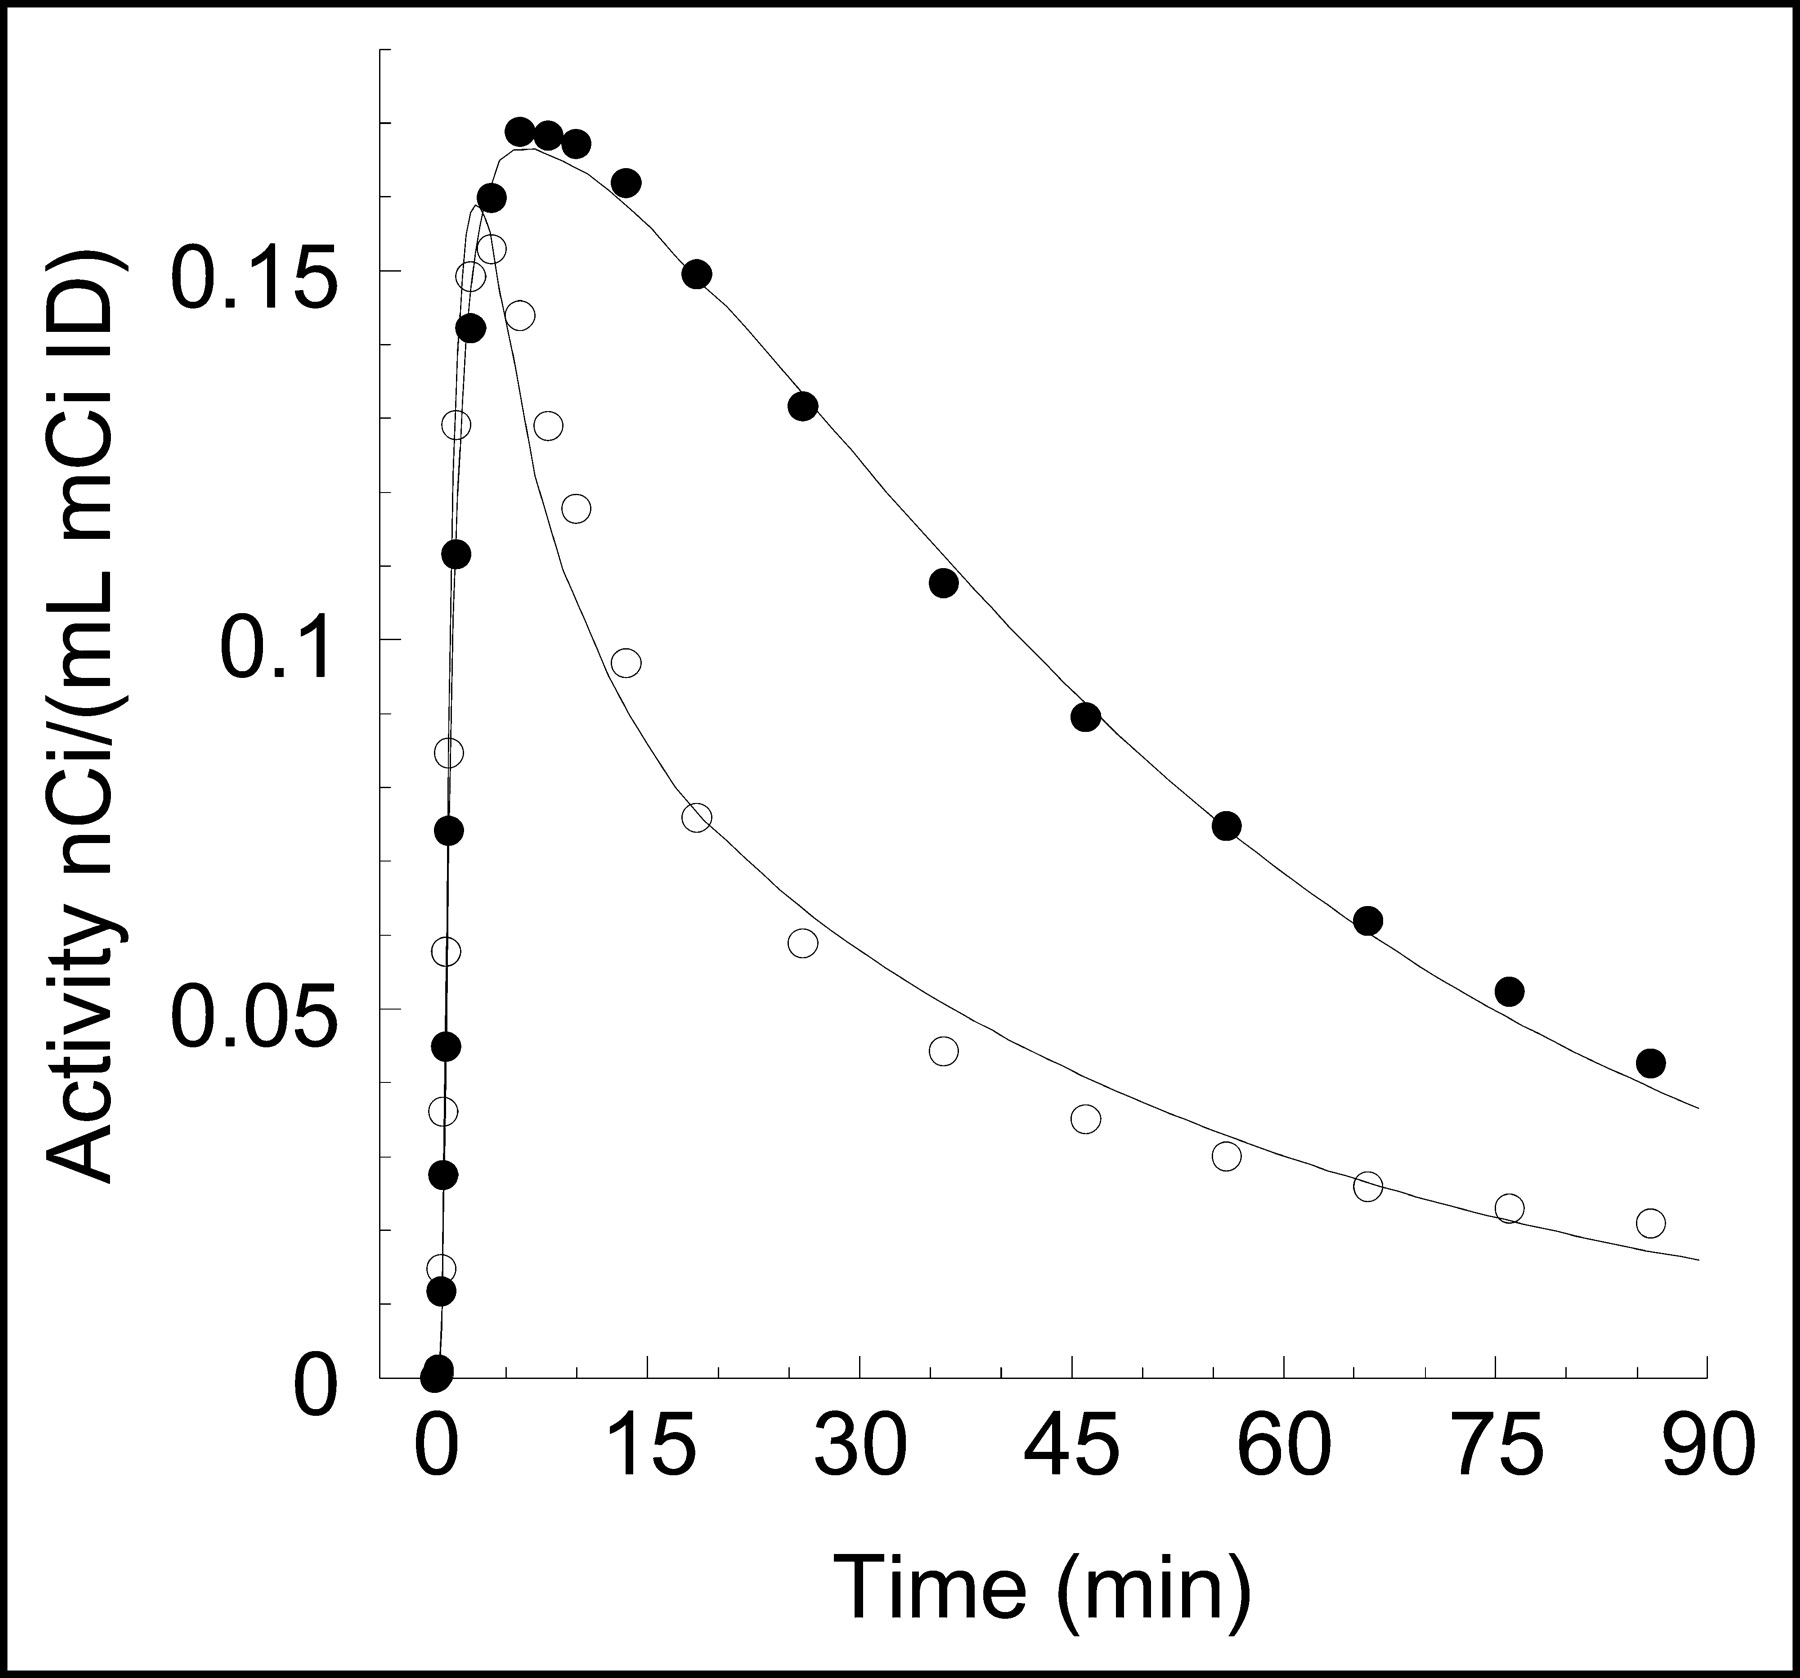
Time-activity curves in cerebellum (○) and striatum (•) after injection of 11C-NPA. Points are measured values. Lines are values fitted to a 1TCM.
Kinetic Analysis.
Cerebellum VT values calculated with the 1TCM and 2TCM models are provided in Table 2. Cerebellum VT was slightly but significantly (P < 0.001) larger when calculated with 1TCM than with 2TCM. The SE (%CV) of cerebellum VT derived with 1TCM was significantly lower than that of 2TCM (P = 0.02; Table 2). Both 1TCM and 2TCM resulted in comparable fits to the data, with no significant difference in the AIC (paired t test, P = 0.18; Table 2). The F test for model order was not significant in any study. Therefore, the 1TCM was selected for the kinetic analysis of the cerebellum. Mean values of cerebellar K1, k2, and VT derived with 1TCM for each animal are provided in Table 3. Cerebellar K1 was significantly higher in baboon A than in baboon B (P = 0.03). No significant differences between baboons were observed in cerebellum VT.
Comparison of Compartment Models for 11C-NPA Kinetic Analysis*
Fractional Rate Constants and Total Distribution Volumes of 11C-NPA in Baboons*
Striatal VT values calculated with the 1TCM and 2TCM models are provided in Table 2. The striatal VT was larger when calculated with the 1TCM than with the 2TCM (P < 0.001; Table 2). The SE of 1TCM striatal VT was significantly lower than that of 2TCM striatal VT (P = 0.002; Table 2). Both 1TCM and 2TCM resulted in comparable fits to the data, with no significant difference in the AIC (P = 0.37; Table 2). The F test was not significant in any study. Therefore, the 1TCM model was selected for the kinetic analysis of the striatum. Mean values of striatal K1, k2, and VT derived with 1TCM for each animal are provided in Table 3. Striatal K1 and VT were significantly higher in baboon A than in baboon B (P = 0.01 and P = 0.04, respectively).
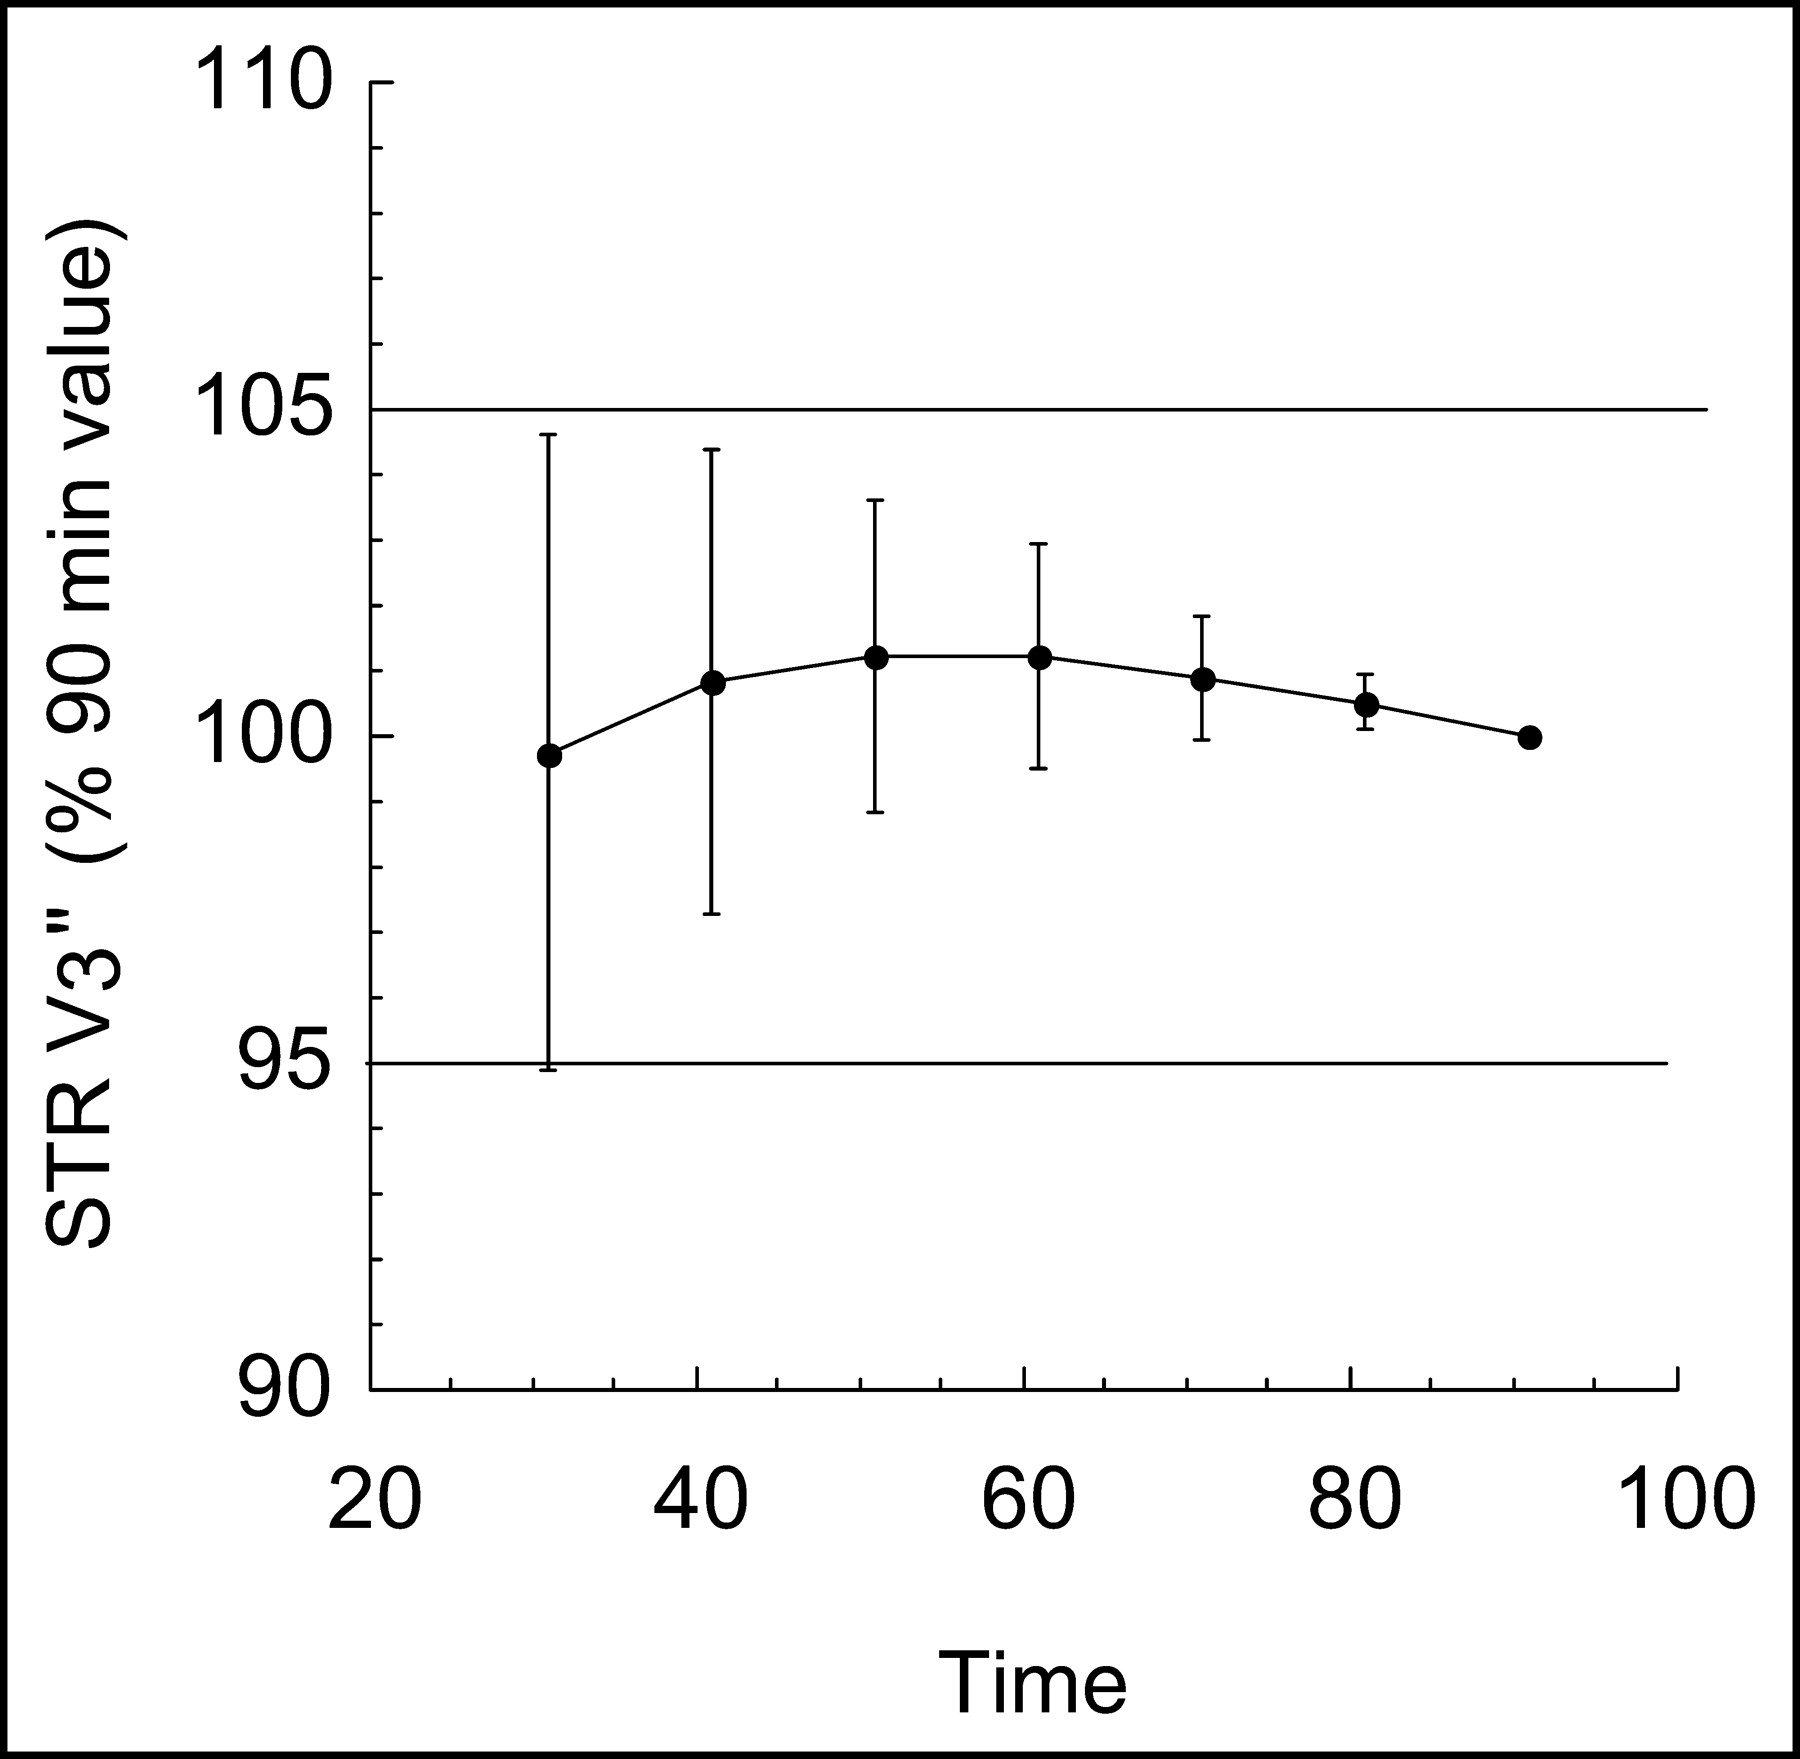
A minimal scanning time of 30 min was required to reach time invariance criteria in the derivation of V3″ in the striatum. Figure 5 shows the small bias and error associated with progressively shorter scanning time (30–90 min). The times taken to reach time invariance criteria for the derivation of VT in the cerebellum and striatum were 40 and 50 min, respectively.

Relationship between scan duration and estimates of striatum V3″ by kinetic analysis. For each scan duration, estimated V3″ values were expressed in percentages of the value derived with the complete dataset (90 min). Each point is the average and SD of the 8 datasets. Decreasing the duration of scanning time from 90 to 30 min would induce only small biases and errors (<10%) on the estimates of V3″.
Striatal BP and V3″ values as derived with 1TCM are presented in Table 4. Significant (P = 0.02) differences between baboons were noted for both parameters (effect sizes of 1.76 and 1.86 for BP and V3″, respectively).
Binding Parameters of 11C-NPA in Baboons*
Graphical Analysis with Arterial Input Function.
Distribution volumes and binding parameter values derived by graphical analysis are presented in Tables 3 and 4, respectively. The time at which the regression was started (t*) was determined by visual inspection. The average t* used for analysis of the cerebellum was 42 ± 22 min and for the striatum was 62 ± 22 min. Overall, the results of graphical analysis were well correlated with kinetic analysis (Table 5). Cerebellar and striatal VT values derived by graphical analysis were significantly lower than corresponding values derived with kinetic analysis (P < 0.01 for both regions). Graphical BP values were also significantly lower than kinetic BP values (P = 0.04). Because the graphical estimate of cerebellar VT was lower relative to kinetic analysis (−9.4% ± 4.7%) than was the striatal VT (−6.2% ± 3.7%), graphical V3″ values were higher than kinetic V3″ values (P = 0.01). Graphical analysis was as effective as kinetic analysis at detecting the higher site availability in baboon A compared with baboon B (with effect sizes of 1.98 and 1.93, respectively).
Comparison of Outcome Measures Derived with Kinetic, Graphical, and SRTM Analysis
As observed with kinetic analysis, the minimal scanning time required to reach time invariance criteria in the derivation of striatal V3″ (30 min) was shorter than the minimum time to reach time invariance criteria in the derivation of VT in both the cerebellum (50 min) and striatum (60 min) with graphical analysis.
Graphical Analysis with Reference-Region Input.
V3″ values estimated with graphical analysis (Table 4) with reference-region input function were highly correlated with kinetic V3″ values (Table 5). The average t* used for this analysis was 57 ± 11 min, determined by visual inspection. V3″ values derived with the graphical analysis reference-region method were significantly higher than kinetic V3″ values (P < 0.018). Graphical analysis V3″ values measured in baboon A were higher than in baboon B (P = 0.01, effect size of 1.92). A minimal scanning time of 30 min was required to reach time invariance criteria in the derivation of striatal V3″ with this method.
SRTM Analysis.
The mean value of R1 was 0.91 ± 0.11, estimated with %CV of 4.6% ± 1.0%. SRTM V3″ values (Table 4) were highly correlated with kinetic V3″ values (Table 5). SRTM V3″ values were significantly higher than kinetic V3″ values (P < 0.0001). SRTM V3″ measured in baboon A was higher than that in baboon B (P = 0.01, effect size = 1.77). A minimal scanning time of 30 min was required to reach time invariance criteria in the derivation of striatal V3″ by SRTM.
DISCUSSION
The aim of this study was to develop a suitable analytic method to derive the parameters of 11C-NPA in vivo binding (BP and V3″) to agonist binding sites of the D2 receptors. The most comprehensive strategy involved kinetic modeling based on specified compartmental configurations and using the arterial time-activity curve as input function. Three simpler approaches were also evaluated: graphical analysis (arterial input), which does not require the specification of a compartmental configuration; SRTM analysis, which makes it possible to derive V3″ (1 of the 2 binding parameters) without measurement of the arterial input function; and graphical analysis with reference-region input, which incorporates both simplifications.
11C-NPA was found to have a moderate rate of metabolism in plasma, and the percentage of parent compound at 30 min after injection was still about 30%. The mean peripheral clearance of 11C-NPA was similar to that of 11C-raclopride in the same 2 animals (27 ± 3 L/h) (unpublished data, 2003). The 11C-NPA input function could be modeled as a sum of 3 exponentials. The plasma free fraction of 11C-NPA was determined to be around 5%, which is about half that of 11C-raclopride (10%) in the same baboons.
Two compartmental models were evaluated using this dataset. Given the presence of receptors in the striatum but not in the cerebellum, it was expected that a 2TCM would be required to model the striatal time-activity curve, whereas a 1TCM would be adequate for the cerebellum. In fact, the 1TCM was appropriate for both regions. In the striatum, the 2TCM converged only if the kinetic parameters were constrained to positive values, and, when it did, it was associated with a larger error in VT than was the 1TCM. Furthermore, the 2TCM failed to improve significantly the goodness of fit compared with the 1TCM, taking into account the penalties associated with the larger number of parameters. Thus, the 1TCM emerged as an appropriate model to fit 11C-NPA striatal uptake.
It has been suggested that the reliability of kinetic parameter estimation for the 2TCM model can be estimated from the impulse response fraction (IRF) (28). The IRF is defined as the fraction of the area under the curve attributable to the term associated with the larger of the 2 eigenvalues of the state matrix in the 2TCM solution. Small IRFs are associated with difficulty in identifying the 2 distinct kinetic behaviors associated with 2TCM (28,29). Using the kinetic parameters from the striatal 11C-NPA 2TCM model, the mean IRF for the striatum was indeed found to be small (0.8%) and similar to that for the cerebellum (0.7%). This computation supported the choice of the 1TCM. The situation in which the brain uptake in a region with significant target density is adequately modeled with a 1TCM is not infrequent. For example, a similar situation was reported for the benzodiazepine receptor antagonist 11C-flumazenil (30) and the serotonin transporter ligands 11C-McN 5652 and 11C-DASB (23,31).
The value of 11C-NPA VT in the cerebellum was 3.44 ± 0.39 mL/g. This value is higher than the cerebellar VT of 11C-raclopride, measured as 0.93 ± 0.13 mL/g (n = 12; unpublished data, 2003) in the same animals. Given plasma free fractions of 5% and 10% for 11C-NPA and 11C-raclopride, respectively, these cerebellar VT values indicate that the free fractions in the nondisplaceable compartment (f2) are about 1% and 11% for 11C-NPA and 11C-raclopride, respectively. Thus, the nonspecific binding of 11C-NPA is higher than that of 11C-raclopride. Nonetheless, this value is still in the low range of nondisplaceable distribution volumes. For example, the cerebellum VT of the serotonin transporter radiotracer 11C-DASB is 17.3 ± 0.5 mL/g in baboons (n = 4) (23).
The striatal BP of 11C-NPA was 4.04 ± 1.05 mL/g. In theory, 11C-NPA BP is the sum of the BP at the high (BPhigh) and low (BPlow) agonist affinity states of D2 receptors, as expressed by expanding Equation 2 into:
 Eq. 6 where KD high and KD low are the affinities of 11C-NPA for high- and low-affinity states, respectively, and Rhigh and Rlow are the concentration of sites configured in high- and low-affinity states, respectively. In vitro, the affinities of 11C-NPA for the high- and low-agonist-affinity sites differ by a factor of at least 50, as suggested by numerous in vitro studies (3,32–35). Under the assumptions that the affinity difference is 50 and that 50% of the receptors are configured in the high-affinity state, Equation 6 indicates that the contribution of BPlow to the total BP of 11C-NPA is negligible (2%). Thus, under these assumptions, Equation 6 simplifies to:
 Eq. 7
Eq. 7
Saturation experiments will be required to confirm these assumptions (i.e., to measure the in vivo values of Khigh, Klow, Rhigh, and Rlow).
The binding parameters obtained from other model-based methods (graphical and SRTM analyses) were comparable and correlated well with those obtained from kinetic analysis. Each method was equally effective at detecting the higher site availability in baboon A compared with baboon B. The observed result that VT from graphical analysis was lower than VT from kinetic modeling was consistent with previous studies showing a tendency of the graphical approach to underestimate VT in the presence of statistical noise (36). The observation that V3″ from SRTM was higher than that from kinetic modeling was also consistent with simulation studies showing a tendency of this method to overestimate V3″ when the reference-region curve was well represented by 1 tissue compartment (37). Determination of the magnitude of these effects in humans will be required before adopting these simpler methods in clinical studies.
The striatum peak 11C-NPA uptake occurred early, at 6–8 min after injection, after which a rapid washout followed. This fast kinetic of uptake is an advantage, because it permits the derivation of outcome measures with short scan duration. It was found that 50 and 60 min of data were required to derive VT with kinetic analysis and graphical analysis, respectively. The derivation of V3″ with all methods required only 30 min of data. Thus, 11C-NPA binding parameters can be measured reliably in a relatively short scanning session, at least in baboons.
The other advantage of fast uptake kinetics is that this property will facilitate the implementation of a bolus-plus-constant-infusion protocol for 11C-NPA. The bolus-plus-constant-infusion method that has been successfully developed for 11C-raclopride leads to the establishment of a steady-state concentration of the parent compound in plasma and brain, which creates a state of sustained binding equilibrium at the level of the receptors (38,39). The measurement of regional radioactivities at equilibrium allows a direct determination of the distribution volumes. When applicable, the constant infusion has several advantages (40). For example, the scanning time can be reduced, and the parent plasma concentration can be measured using venous blood samples.
CONCLUSION
These results demonstrate that model-based methods can be used successfully in the quantification of in vivo binding of 11C-NPA to D2 receptors. Future studies need to establish the contribution of the D2high and D2low sites to the BP of 11C-NPA as well as assess the potential of 11C-NPA as an imaging tool to study fluctuations of endogenous DA concentration in vivo.
Acknowledgments
This work was supported in part by the National Alliance for Research on Schizophrenia and Depression Young Investigator Award from the National Institute of Mental Health (1RO1MH62089) and the Lieber Center for Schizophrenia Research at Columbia University. The authors acknowledge the superb assistance of Dr. Mohamed Ali, Dr. Osama Mawlawi, Kimchung Ngo, Jennifer Bae, Van Phan, and Rano Chatterjee.
Footnotes
Received Jul. 14, 2003; revision accepted Oct. 23, 2003.
For correspondence or reprints contact: Dah-Ren Hwang, PhD, New York State Psychiatric Institute, 1051 Riverside Dr., Box 31, New York, NY 10032.
E-mail: hd72{at}columbia.edu
REFERENCES
In this issue


Jump to section
Related Articles
Cited By...
- 18F-MCL-524, an 18F-Labeled Dopamine D2 and D3 Receptor Agonist Sensitive to Dopamine: A Preliminary PET Study
- Human Biodistribution and Dosimetry of the D2/3 Agonist 11C-N-Propylnorapomorphine (11C-NPA) Determined from PET
- Measurement of the Proportion of D2 Receptors Configured in State of High Affinity for Agonists in Vivo: A Positron Emission Tomography Study Using [11C]N-Propyl-norapomorphine and [11C]Raclopride in Baboons