


Abstract
8-cyclopentyl-3-(3-18F-fluoropropyl)-1-propylxanthine (18F-CPFPX) is a novel PET ligand for in vivo quantification of cerebral A1 adenosine receptors. The present study investigated the applicability of voxelwise graphical analysis to the generation of parametric images of the total volume of distribution (DVt) of 18F-CPFPX as a prerequisite for voxel-by-voxel statistical analysis. The benefit of spatial smoothing for reduction of noise-dependent negative bias in graphical analysis was examined. Additionally, the effect of scan duration on the accuracy of analyses based on volumes of interest (VOIs) and individual voxels was explored. Methods: Ten healthy male volunteers underwent bolus-injection 18F-CPFPX PET (90 min). The data were analyzed using a 2-tissue-compartment model and graphical analysis. Voxelwise graphical analysis was performed with and without preceding spatial gaussian smoothing. Results: Voxelwise graphical analysis yielded high-quality parametric images. However, voxelwise graphical analysis suffered from a negative bias (mean bias in cortical regions, −9.6% to −7.5%), which could be attenuated considerably by spatial smoothing (using a kernel of 5 mm in full width at half maximum, bias of −4.0% to −1.9%). Shortening the total scan duration to 60 min had minor effects on the accuracy of VOI-based analysis (15 VOIs × 10 subjects); the resulting error only occasionally exceeded ±5% in individual regions (n = 6 for 2-tissue-compartment model, n = 10 for VOI-based graphical analysis, always within ±7.5%). Quantification accuracy was acceptable with scan durations of 60 and 75 min in voxelwise graphical analysis with spatial smoothing (mean bias in cortical regions, −8.4% to −5.9%) and without spatial smoothing (bias, −9.2% to −11.6%), respectively. Conclusion: High-quality DVt parametric images of 18F-CPFPX can be generated by voxelwise graphical analysis. The noise-dependent negative bias of voxelwise graphical analysis is greatly reduced by spatial smoothing. A shortened scan of 60 min will enhance the clinical applicability of 18F-CPFPX PET.
The xanthine derivate 8-cyclopentyl-3-(3-18F-fluoropropyl)-1-propylxanthine (18F-CPFPX) has recently been proposed as a ligand for PET imaging of cerebral A1 adenosine receptors (1,2). Effects promoted by the neuromodulator adenosine through Gi/o-protein–coupled cerebral A1 adenosine receptors are assumed to play a crucial role in various neurologic and psychiatric diseases (e.g., Alzheimer's disease, stroke, epilepsy, and anxiety disorders) and under physiologic conditions (e.g., regulation of alertness or sleep-wakefulness) (3,4). The equilibrium total distribution volume (DVt) of 18F-CPFPX provided by 2-tissue-compartment model analysis (2TCM) (5) and Logan's graphical analysis (6) of bolus-injection studies (7) or equilibrium analysis of bolus-infusion studies (8) serves as an outcome parameter directly related to cerebral A1 adenosine receptor density.
So far, all analyses have been performed on regional time–activity curves provided by volume-of-interest (VOI) analysis. VOI analysis suffers from the drawback that possible intraregional variations in ligand binding go unnoticed because of intraregional VOI averaging. Parametric images in turn provide voxelwise DVt estimates allowing voxel-by-voxel statistical analysis, such as between different subject populations or before and after pharmacologic intervention. Although a voxelwise 2TCM analysis is precluded by the noise level of a single-voxel time–activity curve, equilibrium analysis and graphical analysis can be used voxelwise to generate DVt parametric images. The parametric image quality yielded by equilibrium analysis is compromised because of the delay between the start of tracer application and achievement of equilibrium and concomitant radioactive decay, whereas bolus studies analyzed by graphical analysis result in high-quality parametric images. However, conventional graphical analysis is well known to show a noise-dependent negative bias, particularly in voxelwise analysis (9–13).
Another question related to 18F-CPFPX PET that has not been answered so far is the effect of total scan duration on the accuracy of image quantification. Bolus-injection studies currently use a scan duration of 90 min, which is hardly tolerable in clinical routine. A shorter scan would clearly improve the clinical use of 18F-CPFPX PET.
The present study had 3 aims: The first was to investigate the applicability of graphical analysis to the generation of parametric images. The second was to examine the benefit of a simple approach for noise reduction based on spatial gaussian smoothing on voxelwise DVt estimation. The third was to explore the effect of reducing total scan duration on the accuracy of DVt estimation for VOI- and voxel-based analyses.
MATERIALS AND METHODS
Subjects
Ten healthy male volunteers (mean age ± SD, 43.5 ± 17.7 y) were examined by bolus-injection 18F-CPFPX PET after having given written informed consent. Six of these subjects were also included in an earlier study (7). All procedures were approved by the Ethics Committee of the Medical Faculty of the University of Düsseldorf and the German Federal Office for Radiation Protection. Volunteers were screened for a history of neurologic and psychiatric diseases, head injury, and alcohol or substance abuse. A review of current medications excluded the intake of substances interfering with adenosine receptors (e.g., theophylline). Caffeine intake was not allowed for at least 24 h before PET. To exclude structural brain abnormalities and to define VOIs, individual high-resolution MRI datasets were acquired (Magnetom VISION, 1.5 T; Siemens) using a 3-dimensional T1-weighted magnetization-prepared rapid-acquisition gradient-echo sequence (voxel size, 1 × 1 × 1 mm).
PET Acquisition, Blood Sampling, and Metabolite Analysis
PET measurements were performed in 3-dimensional mode as list-mode acquisitions on a ECAT EXACT HR+ scanner (Siemens-CTI) as previously described (7). Scanning took place while the patients were supine and in a quiet ambience. Head position (canthomeatal orientation) was permanently monitored using a video system and reference skin marks and was manually corrected if necessary. Sixty-three slices 2.425 mm thick (pixel size, 2 × 2 mm) were reconstructed per time frame by filtered backprojection (Shepp filter, cutoff of 2.5 mm) after Fourier rebinning into 2-dimensional sinograms (6 × 10-s, 3 × 20-s, 3 × 30-s, 4 × 60-s, 3 × 150-s, and 15 × 300-s frames). Datasets were fully corrected for random coincidences, scatter radiation, and attenuation (10-min 68Ge/68Ga transmission scan). The spatial resolution of the reconstructed images was approximately 5 mm in full width at half maximum (FWHM).
18F-CPFPX was radiosynthesized and formulated as previously described (1). At the time of injection, mean specific radioactivity was 64.5 ± 49.1 GBq/μmol (range, 15.0–159.8 GBq/μmol). The 90-min PET acquisition began with the start of 18F-CPFPX injection as a bolus over 20 s. Mean injected radioactivity was 279.9 ± 19.5 MBq (251.6–325.6 MBq) in a volume of 10 mL of sterile saline. The mass of injected CPFPX was 2.3 ± 1.7 μg (0.5–5.7 μg).
An arterial catheter was inserted into the left distal radial artery under local anesthesia and used for arterial blood sampling. During the first 90 s after 18F-CPFPX injection, heparinized arterial blood samples (∼4 mL) were withdrawn every 6 s. Thereafter, blood samples were collected at 1 min 45 s and at 2, 3, 4, 6, 8, 10, 15, 20, 30, 45, 60, 75, and 90 min. An additional venous blood sample was taken before 18F-CPFPX administration to assess the fraction of free 18F-CPFPX in plasma (i.e., unbound to plasma proteins), the extraction of pure 18F-CPFPX, and the plasma caffeine level (high-performance liquid chromatography was used to exclude relevant plasma caffeine levels). Radioactivity in whole-blood and plasma samples (500 μL) was measured in an automated γ-counter (1480 WIZARD; Wallac-ADL GmbH) that was cross-calibrated weekly with the PET scanner. Whole-blood and plasma time–activity curves were decay corrected to the start of the scan. Metabolite analysis was done by thin-layer chromatography as previously described (7).
Data Analysis
The individual MRI datasets were realigned to the anterior commissure/posterior commissure line using interactive 3-dimensional image registration software (MPI-Tool, version 3.35; ATV) (14). In each subject, a summed PET image (5.5–60 min after injection) was manually coregistered to the realigned MR image. Registration parameters were subsequently applied to each PET frame. Coregistered dynamic PET data were stored in a voxel size of 2 × 2 × 2 mm. VOIs were defined on MR images by freehand drawing and subsequently superimposed onto the dynamic PET sequence (PMOD, version 2.6; PMOD Group) (15). Side-averaged, decay-corrected time–activity curves were generated for the following cerebral regions: dorsal frontal cortex, orbitofrontal cortex, lateral temporal cortex, mesial temporal lobe (including amygdala, hippocampus, and mesial temporal cortex), parietal cortex, occipital cortex, precentral gyrus, postcentral gyrus, cingulate gyrus, insula, thalamus, putamen, caudate nucleus, cerebellum, pons, and whole brain (for initial parameter estimation only). The blood volume of each regional time–activity curve was corrected by assuming a fractional blood-volume component of 5% using the arterial whole-blood time–activity curve.
A standard 2TCM (5) and the graphical analysis of Logan et al. (6) were used for VOI-based analysis as previously described (7). Using weighted nonlinear regression (Levenberg-Marquardt least-squares minimization, implemented in PMOD), the 2TCM was fitted to the individual regional time–activity curve corrected for blood volume. The DVt was calculated from the estimated rate constants as (K1/k2) × (1 + k3/k4). K1 and k2 are equal to the rate constants for the transfer of the ligand from plasma to the free and nonspecifically bound tracer compartment and back. Likewise, k3 and k4 are the rate constants for the transport from the free and nonspecifically bound tracer compartment to the specifically bound tracer compartment and back. The parameter estimates from the individual whole-brain time–activity curve analyses were used as initial parameters in all subsequent individual regional fits. In graphical analysis, the DVt was calculated from the slope of the linear part of the graphical analysis plot. The slope was calculated from 30 min (time of linearization, referred to as t*) onward. VOI-based graphical analysis was also done without blood-volume correction.
Parametric images of the DVt of 18F-CPFPX were generated by voxelwise graphical analysis of the coregistered PET datasets with t* = 30 min. In a second analysis, run to explore the effect of noise reduction on voxelwise graphical analysis, 3-dimensional gaussian smoothing was applied to all datasets before graphical analysis. The DVt acceptance range was set from 0 to 3 mL/mL to exclude artificially low or high DVt estimates. Voxels exceeding this range were set to zero. The same VOI sets as those used in the VOI-based analysis were used to read out mean DVt values (side-averaged) for regional parametric images. Because blood-volume correction of single-voxel time–activity curves requires knowledge of the fractional blood volume of each voxel, which may vary considerably (e.g., between gray matter and sinuses), blood volume was not corrected in voxelwise analysis. Therefore, the results from voxelwise graphical analysis were compared with the results from VOI-based graphical analysis without blood-volume correction.
To test the effect of total scan duration on the accuracy of VOI- and voxel-based analyses, all analyses were repeated with shortened total scan durations of 45, 60, and 75 min (i.e., the last 3 PET frames were iteratively omitted in each subsequent run).
A correction for the free fraction of ligand in plasma was not performed because this fraction does not affect the following comparisons. All analyses were run on PMOD.
RESULTS
Generation of Parametric Images
VOI-based graphical analysis without blood-volume correction was used as a reference for evaluation of voxelwise analysis because blood-volume correction could not be performed voxelwise. The regional DVt estimates given by VOI-based graphical analysis without blood-volume correction and 2TCM with blood-volume correction showed an excellent correlation (10 × 15 regions, r2 = 0.995 [linear regression with 2TCM as independent parameter]; slope, 0.93; ordinate intercept, 0.12 [all results in this paragraph refer to a 90-min scan]). The positive bias of the VOI-based graphical analysis without blood-volume correction was caused by the included blood-volume component. VOI-based graphical analysis itself shows only negligible bias as demonstrated by the comparison of VOI-based graphical analysis with blood-volume correction and 2TCM (r2 = 0.998; slope, 0.98; intercept, 0.01).
Figure 1A depicts a representative parametric image generated by voxelwise graphical analysis. The regional DVt estimates given by voxelwise graphical analysis and VOI-based graphical analysis without blood-volume correction correlated strongly (r2 = 0.991). However, voxelwise graphical analysis showed a considerable negative bias (slope = 0.969, intercept = −0.056; Fig. 2A). The mean relative deviation of the voxelwise graphical analysis from its VOI-based counterpart was maximal in the pons (−17.9% ± 2.8%). In cortical areas, the mean relative deviation ranged from −9.6% to −7.5%, whereas the mesial temporal lobe showed a slightly higher mean relative deviation (−12% ± 4.6%) and the subcortical structures showed a slightly lower mean relative deviation (−7.9% to −6.3%), depending on the regional DVt.

Representative parametric images of 18F-CPFPX DVt in healthy 46-y-old male volunteer. A through D and E through H were generated by voxelwise graphical analysis without preceding spatial gaussian smoothing and with preceding spatial gaussian smoothing (filter kernel of 5 mm FWHM), respectively. Total scan durations were 90 min (A and E), 75 min (B and F), 60 min (C and G), and 45 min (D and H).
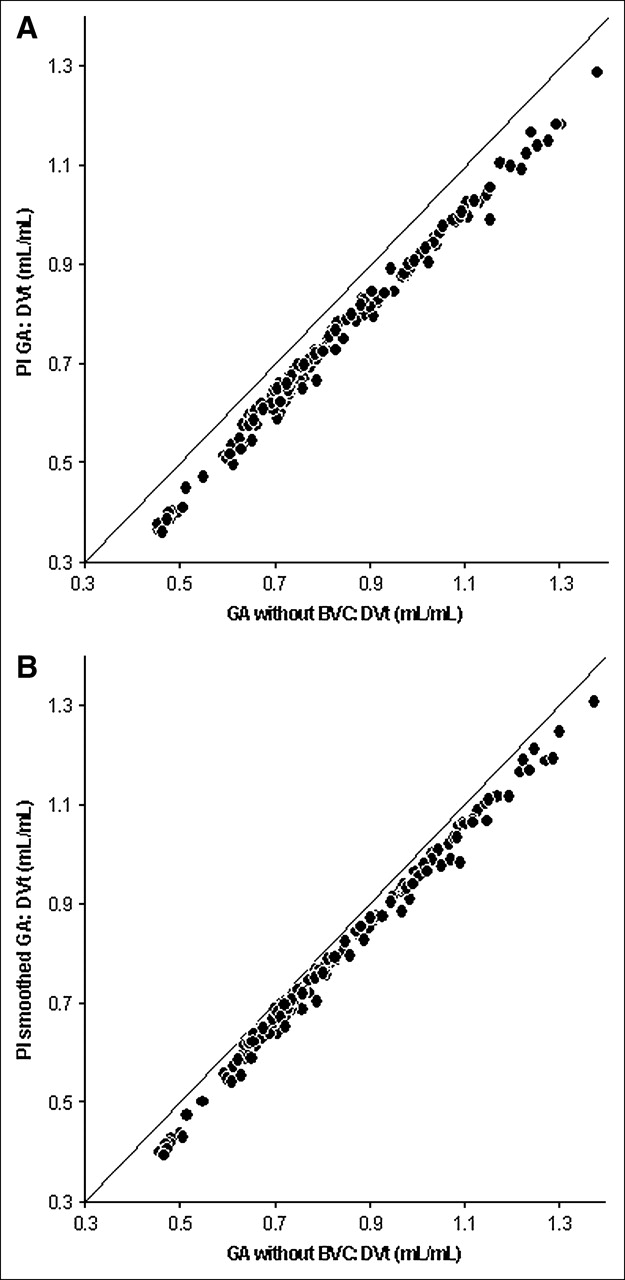
Correlations between regional DVt estimates by voxelwise graphical analysis and VOI-based graphical analysis without blood-volume correction (reference method). BVC = blood-volume correction; GA = graphical analysis; PI GA and PI smoothed GA = parametric images generated by voxelwise graphical analysis without spatial gaussian smoothing and with spatial gaussian smoothing (filter kernel of 5 mm FWHM), respectively; solid line is line of identity.
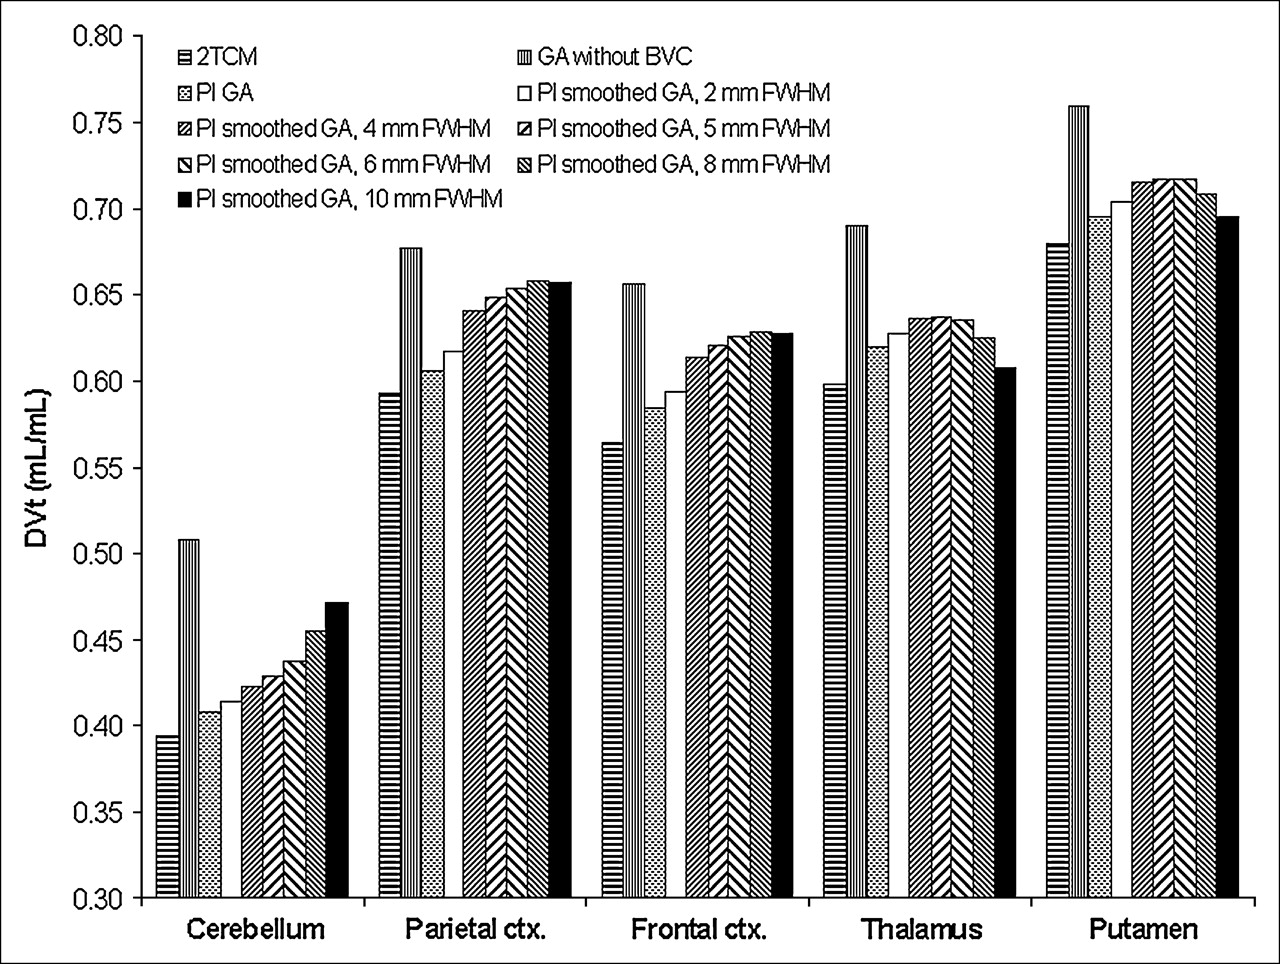
Three-dimensional gaussian smoothing of the PET datasets before graphical analysis was used in an attempt to reduce this bias. Figure 3 illustrates the effect of spatial smoothing on the DVt estimates given by voxelwise graphical analysis in comparison to the 2TCM analysis and the VOI-based graphical analysis without blood-volume correction. Applying spatial smoothing reduced the bias between voxelwise graphical analysis and its VOI-based analog in all regions. Bias reduction was optimized with a filter kernel of approximately 5 mm FWHM. Using a larger kernel led to a smaller bias reduction in the subcortical nuclei, presumable because of partial-volume effects in the opposite direction. The same effect was seen in cortical regions for filter kernels larger than 8−10 mm FWHM. In contrast, the apparent bias in the cerebellum continuously decreased for larger kernels. However, this apparent increase in DVt was most likely caused by spillover activity from the occipital cortex and venous sinuses. A filter kernel of 5 mm FWHM was used in subsequent analyses.

Effect of spatial gaussian smoothing on regional DVt estimates given by voxelwise graphical analysis. 2TCM = VOI-based 2TCM with blood-volume correction; BVC = blood-volume correction; ctx. = cortex; GA = graphical analysis; PI GA and PI smoothed GA = parametric images generated by voxelwise graphical analysis without spatial gaussian smoothing and with spatial gaussian smoothing (filter kernel of 5 mm FWHM), respectively.
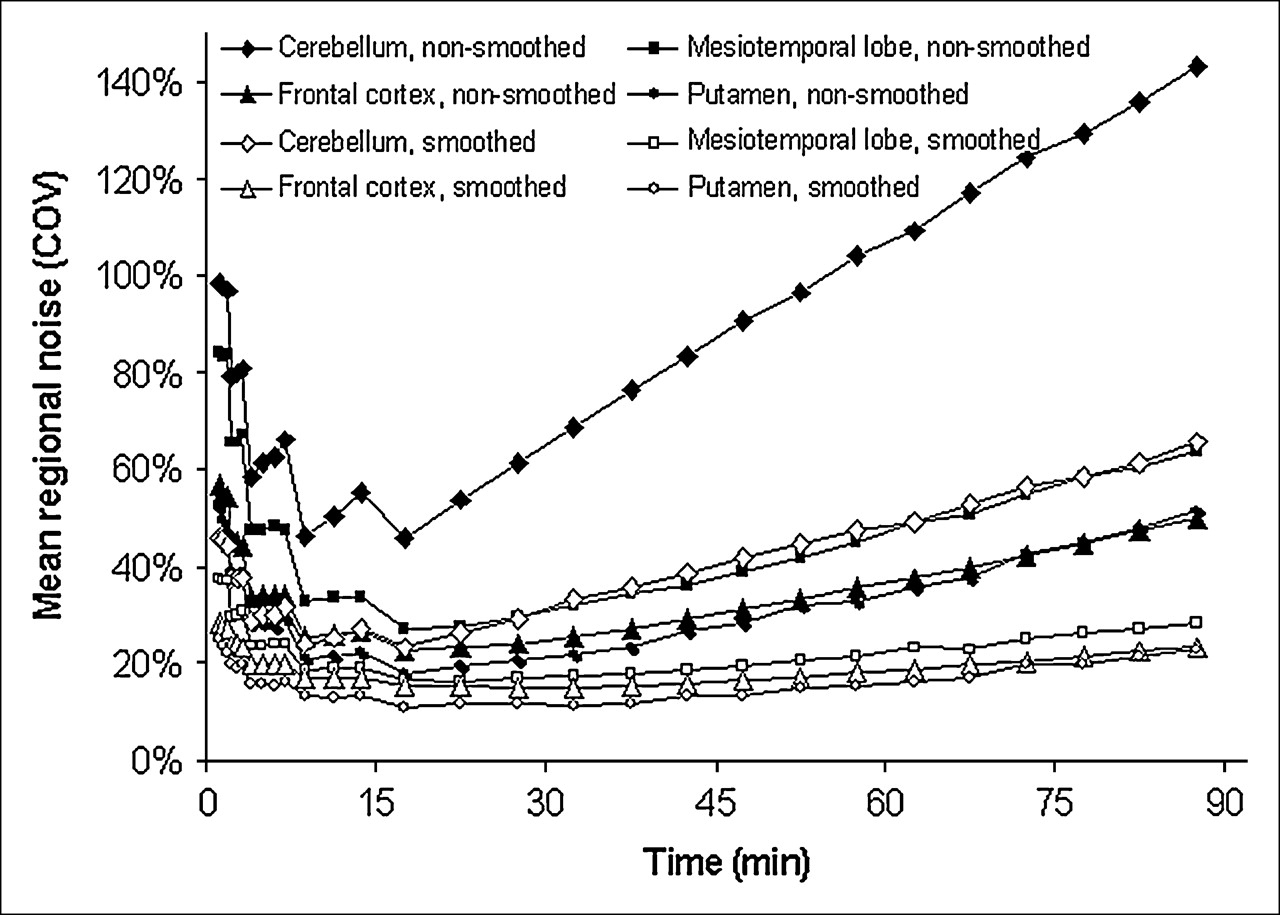
The magnitude of regional noise was estimated by calculating the coefficient of variation (COV) of the voxel values of a specific region as a function of time. After 18F-CPFPX bolus injection, the regional COV decreased with increasing brain uptake and frame duration, reaching a minimum at 17.5 min. Afterward, the regional noise level increased again because of decreasing regional radioactivity (ligand washout and radioactive decay). Nonsmoothed data were affected by substantial noise, which varied considerably among regions (Fig. 4): The cerebellum and pons showed the highest COV, increasing from 46% ± 8% (cerebellum) and 45% ± 5% (pons) at 17.5 min to 143% ± 41% and 123% ± 29%, respectively, at 87.5 min. In contrast, the COV was considerably lower in subcortical regions (e.g., putamen, 18% ± 1% and 51% ± 12% at 17.5 and 87.5 min, respectively) and cortical regions (e.g., frontal cortex, 23% ± 1% and 50% ± 7%, respectively). The mesiotemporal lobe showed an intermediate noise level (27% ± 3% and 64% ± 16%, respectively). To correlate the regional noise level with the regional bias in voxelwise graphical analysis, we calculated the average regional COV from 1 to 90 min (COV1–90; the first minute was ignored to exclude the highly variable COV immediately after ligand injection). Furthermore, we used the relative bias (normalized to regional DVt) rather than the absolute bias because the extent of bias is proportional to both the magnitude of noise and the regional DVt (9–12). We found a highly significant (P < 0.0001) association between the regional COV1–90 and the relative regional bias (r2 = 0.74). The regional COV was greatly reduced by gaussian spatial smoothing of 5 mm FWHM (on average by −48% ± 3%; Fig. 4). After smoothing, the regional COVs were 23% ± 3% and 66% ± 17% for the cerebellum, 17% ± 1% and 29% ± 6% for the mesiotemporal lobe, 15% ± 1% and 24% ± 3% for the frontal cortex, and 11% ± 1% and 23% ± 6% for the putamen at 17.5 and 87.5 min, respectively.

Effect of spatial smoothing on regional noise. Regional noise was calculated as COV of voxel values of specific VOI for each time point. Mean COV of all subjects is plotted as function of time for representative anatomic regions. Three-dimensional gaussian filter (5 mm FWHM) was used for spatial smoothing.
A representative parametric image calculated by voxelwise graphical analysis of spatially smoothed PET data (referred to as “smoothed voxelwise graphical analysis”) is shown in Figure 1E. Albeit the image resolution of the smoothed parametric images (approximate resolution: [PET resolution2 + filter kernel2]1/2 = 7.1 mm FWHM) is lower than that of the nonsmoothed parametric images (Fig. 1A), the image quality is high and anatomic structures can be delineated. Figure 2B illustrates the excellent correlation between the regional DVt estimates given by smoothed voxelwise graphical analysis and VOI-based graphical analysis without blood-volume correction (r2 = 0.993; slope, 0.98; intercept, −0.03). The mean relative deviation of the smoothed voxelwise graphical analysis from its VOI-based counterpart (pons, −11.7% ± 2.1%; cortical areas, −4.0% to −1.9%; mesial temporal lobe, −5.2% ± 4.4%; subcortical structures, −6.8% to −4.9%) was considerably less than that of the nonsmoothed voxelwise graphical analysis (Fig. 5D). The slightly less beneficial effect of smoothing on the mean relative deviation of small subcortical structures, compared with other anatomic structures, may be explained by partial-volume effects (Fig. 3).

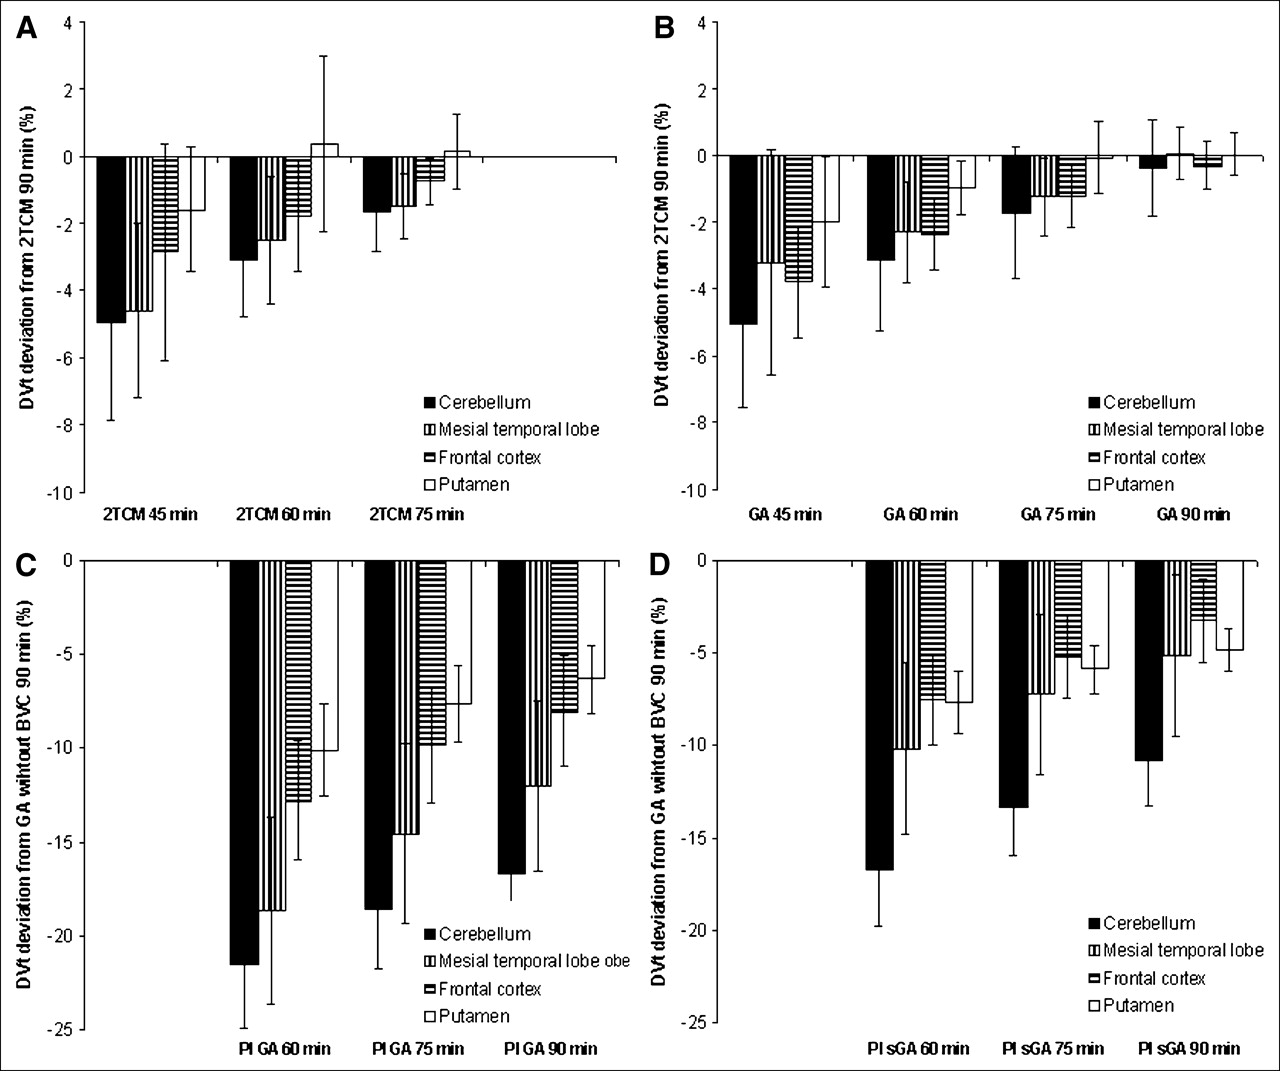
Effect of scan duration on quantification accuracy of VOI-based analysis (A and B) and voxelwise graphical analysis (C and D). Illustrated are mean relative deviations of DVt estimates (ordinate) provided by the respective analyses with specified scan durations (abscissa), compared with reference analyses (i.e., 90-min VOI-based 2TCM analysis in A and B, 90-min VOI-based graphical analysis without blood-volume correction in C and D). Mean values (±SD) are given for representative anatomic regions. Times in minutes refer to total scan duration of the respective analyses. BVC = blood-volume correction; GA = graphical analysis; PI GA = parametric image generated by voxelwise graphical analysis without spatial smoothing; PI sGA = parametric image generated by voxelwise graphical analysis after spatial gaussian smoothing (filter kernel of 5 mm FWHM).
Effect of Scan Duration
Compared with the full 90-min 2TCM analysis, the relative deviations of the 2TCM analyses with shorter scans in all 150 individual regions ranged from −3.9% to 4.8%, from −6.0% to 6.5%, and from −12.1% to 9.3% for 75-, 60-, and 45-min scans, respectively. The relative deviation only occasionally exceeded ±5% (never exceeding 6.5%) for a total scan duration of 60 min (2 deviations > +5%, 4 deviations < −5%; 150 VOIs in total). The mean relative deviations of representative regions are shown in Figure 4A. As expected, the coefficient of variation (COV; as an inverse measure of estimate precision) of individual DVt estimates increased with shorter scans. The COV did not exceed 10% in any case for a 90-min scan. For 75- and 60-min scans, the COV exceeded 10% (always <25%) in 3 and 15 regions, respectively. The 2TCM failed to converge (COV > 50%) in 11 regions (typically small regions such as the pons and caudate) for 45-min scans (50% > COV > 25% in 9 regions, 25% > COV > 10% in 14 regions). These nonconverging regions were subsequently fitted, with k4 (=koff) being restrained to the k4 estimate of the whole-brain VOI.
The VOI-based graphical analysis was also found to be stable for shorter scans (Fig. 4B). The deviation from the 2TCM (90 min) in individual regions ranged from −4.6% to 3.1%, from −6.9% to 2.4%, from −7.5% to 1.3%, and from −10.9% to 4.6% for 90-, 75-, 60-, and 45-min scans, respectively. The relative deviation only occasionally fell below −5% (never <−7.5%) if the scan was shortened to 75 min (n = 2) or 60 min (n = 10). Representative mean regional results are shown in Figure 4B.
Figures 1A–1D and 1E–1H demonstrate the effect of scan shortening on nonsmoothed voxelwise graphical analysis and smoothed voxelwise graphical analysis, respectively. Scans of 60–90 min resulted in parametric images of good quality using both approaches. Only few voxels attained implausibly high (hot spots) or low (cold spots) values (set to zero if outside the permitted range of 0–3 mL/mL), which tend to occur more often in nonsmoothed voxelwise graphical analysis. In contrast, neither approach allowed calculation of reasonable parametric images relying on only 45-min scans. The resulting parametric images contained numerous hot spots and cold spots (Figs. 1D and 1H).
The mean relative deviations of regional DVt estimates provided by voxelwise analysis in comparison to VOI-based graphical analysis without blood-volume correction (90 min; reference analysis) are summarized in Figures 4C and 4D. The change in the deviation of the voxelwise graphical analysis (nonsmoothed and smoothed) from the reference method in response to shortened scans was about the same for both approaches. The mean regional bias in the cerebellum (Figs. 4C and 4D) and pons was always larger than 10% (i.e., mean relative deviation < −10%) using both voxelwise approaches. The relative bias of the smoothed voxelwise graphical analysis did not exceed 10% in any cortical region for 60-min scans (cortical regions, −8.4% to −5.9%; mesial temporal lobe, −10.2% ± 4.6%; subcortical regions, −10.5% to −7.3%). In contrast, the bias did exceed 10% in the case of the nonsmoothed voxelwise graphical analysis at a 75-min scan duration (cortical regions, −11.6% to −9.2%; mesial temporal lobe, −14.6% ± 5.0%; subcortical structures, −9.6% to −7.6%).
DISCUSSION
The primary aim of the present work was to investigate the applicability of voxelwise graphical analysis to the generation of parametric images of the DVt of 18F-CPFPX. VOI-based graphical analysis without blood-volume correction was chosen as a reference because a direct comparison of voxelwise graphical analysis and VOI-based 2TCM was compromised by the fact that blood-volume correction was not applied to voxelwise graphical analysis. Theoretically, a voxelwise blood-volume correction can be performed by an additional blood-volume PET scan with 15O- or 11C-labeled carbon monoxide. Attempting a voxelwise blood-volume correction by using a constant, nonzero fractional blood volume (e.g., 5%) would be inappropriate because of the considerable variability of the fractional blood-volume component among voxels (e.g., 100% in a voxel covering a vessel lumen and approximately 4% in a pure gray-matter voxel). The resulting error would be particularly strong in ligands with relatively low brain uptake and substantial blood-pool activity, such as 18F-CPFPX (superior sagittal sinus in Fig. 1). Although this approach to blood-volume correction would allow a direct comparison of mean regional DVt values gained from VOI analysis of parametric images and VOI-based analysis with blood-volume correction, it does not solve the issue of performing a voxelwise blood-volume correction. VOI-based graphical analysis without blood-volume correction and 2TCM were strongly linearly correlated (r2 = 0.995), with a positive bias of the VOI-based graphical analysis without blood-volume correction. This bias can be assumed to almost solely reflect the included blood-volume component because VOI-based graphical analysis with blood-volume correction and 2TCM gave virtually identical results (r2 = 0.998; mean deviation across all regions, −0.4% ± 1.2%). Therefore, VOI-based graphical analysis without blood-volume correction appears to be the most suited reference analysis for voxelwise graphical analysis.
Our results showed that nonsmoothed voxelwise graphical analysis provided high-quality parametric images, with regional DVt values strongly correlating with the VOI-based graphical analysis without blood-volume correction (r2 = 0.991). However, as expected, the voxelwise DVt estimates showed a considerable negative bias (mean bias of cortical regions, approximately −9.6% to −7.5%). This bias was due to inclusion of the noisy tissue radioactivity measurement into the independent variable, which is assumed to be noise free in ordinary least-squares regression (9–13). One strategy to reduce this noise-dependent bias is to use alternative computational strategies. They include generalized linear least-squares estimation (10,16), total least-squares estimation (also called perpendicular linear regression model) (11), multilinear analyses 1 and 2 (12), and likelihood estimation in graphical analysis (13). Whereas the implementation of generalized linear least-squares estimation and likelihood estimation in graphical analysis is more sophisticated, the application of total least-squares estimation and multilinear analyses 1 and 2 is straightforward but has the drawback of reducing bias at the expense of higher variability (11,12).
An alternative strategy for bias reduction is to smooth the noisy tissue radioactivity measurements. VOI data have been smoothed by a combination of generalized linear least-squares estimation and graphical analysis (10). For voxelwise analyses (graphical analysis and others), a straightforward approach is to average neighboring voxels (e.g., by reducing the image matrix (17) or by grouping neighboring voxels with similar uptake (18)) or to apply spatial gaussian smoothing. More sophisticated approaches are temporal (19) or spatial (20) wavelet filtering and analyses relying on general ridge regression with spatial constraint (21). We chose spatial gaussian smoothing as a simple, fast, and robust method. Applying a filter kernel of 5 mm FWHM reduced the mean bias of voxelwise graphical analysis in cortical regions to only −4.0% to −1.9%, compared with −9.6% to −7.5% in nonsmoothed analysis. This bias reduction is at the expense of a lower image resolution. Assuming a gaussian-shaped PET scanner point-spread function, the resulting image resolution can be estimated to be 7.1 mm, which is still sufficient to delineate anatomic structures (Fig. 1). Unlike all other methods, wavelet filtering in the time domain does not lead to a loss of spatial resolution. However, preliminary analyses showed that this approach was less effective than the present method in reducing the voxelwise graphical analysis bias. Spatial smoothing may also be a valuable preprocessing step to further improve the results gained by the alternative computational strategies. Simulation studies investigating the optimal combination of data preprocessing and computational strategy for a broad range of DVt values and noise levels (covering the characteristics of common radioligands) would be useful.
The major impetus for generating parametric images is to be able to perform voxel-by-voxel statistical analyses such as statistical parametric mapping (22). Such analyses include spatial smoothing to reduce the remaining cortical variability after spatial normalization, to condition the data, and to increase the signal-to-noise ratio. The present results show that PET data should be smoothed before generation of parametric images to gain the least biased parametric images. Performing graphical analysis on smoothed data should not affect the ability to discriminate among groups of different subjects because the mean regional DVt estimates generated by nonsmoothed and smoothed voxelwise graphical analyses showed an excellent linear correlation (smoothed graphical analysis = 1.01 × nonsmoothed graphical analysis + 0.30; r2 = 0.993). Furthermore, the variability of regional DVt estimates was not noticeably affected (mean COV across all subjects and regions, 21.8% for nonsmoothed graphical analysis and 21.4% for smoothed graphical analysis). If larger filter kernels are used (e.g., 10 mm, typically used in statistical parametric mapping analysis), partial-volume effects in the opposite direction (due to a net spillover of signal from gray matter to neighboring white matter and cerebrospinal fluid) will decrease the apparent bias reduction (Fig. 3). This limitation, however, applies to all aforementioned approaches. For the purpose of performing voxel-by-voxel analysis, the moderate loss in resolution should be no drawback of the present method.
The secondary aim of the present study was to investigate the effect of total scan duration on the accuracy of 18F-CPFPX PET quantification. The percentage deviation between the 90-min 2TCM (reference analysis) and the 2TCM and VOI-based graphical analysis with blood-volume correction only occasionally exceeded ±5% (never exceeding ±7.5%) when the scan was shortened to 60 min. This finding indicates that a total scan duration of only 60 min is not compromised by a noteworthy loss of quantification accuracy. However, although the mean regional deviation reached merely −5% in the case of a 45-min scan (Figs. 4A and 4B), this examination length cannot be recommended: Whereas the 2TCM suffers from a loss in DVt estimate precision, the graphical analysis would rely on only a 15-min interval (t* = 30 min) for linear regression (i.e., 3 frames in the current setting). Thus, minor head movements or an increased noise level due to lower uptake or a smaller VOI may considerably affect the accuracy of graphical analysis. This effect is clearly seen in the voxelwise graphical analyses with and without smoothing. Neither analysis can provide reasonable DVt parametric images with only a 45-min scan duration. Similarly, regardless of scan duration, neither voxelwise approach was able to quantify the voxelwise DVt in cerebellum and pons (regions with the lowest density of cerebral A1 adenosine receptors) with a mean regional bias of less than 10% (i.e., mean relative deviation > −10%), compared with the 90-min VOI-based graphical analysis without blood-volume correction (reference analysis). The mean bias between voxelwise graphical analysis and the reference analysis in cortical and subcortical structures stayed in an acceptable range (mean relative deviation ≥ approximately −10%) for scan durations of 75 and 60 min for nonsmoothed and smoothed voxelwise graphical analysis, respectively.
CONCLUSION
High-quality DVt parametric images of 18F-CPFPX can be generated by voxelwise graphical analysis. The noise-dependent bias inherent in voxelwise graphical analysis is greatly reduced by preceding spatial smoothing of the PET datasets. The accompanying moderate loss of resolution does not affect the ability to conduct voxel-by-voxel statistical analysis. For VOI-based analysis, a scan duration of 60 min leads to a minimal loss of quantification accuracy, compared with the 90-min scan duration used so far. Quantification accuracy is acceptable with 60- and 75-min scan durations in voxelwise graphical analysis with and without spatial smoothing, respectively. A scan duration of only 60 min will enhance the clinical applicability of 18F-CPFPX PET.
Acknowledgments
The authors gratefully acknowledge the technical assistance and support of Lutz Tellmann, Elisabeth Theelen, Suzanne Schaden, and Hans Herzog, Institute of Medicine, Research Center Juelich, and Markus Lang, Dirk Bier, Marcus H. Holschbach, and Heinz H. Coenen, Institute of Nuclear Chemistry, Research Center Juelich. This work was supported by grants from the Deutsche Forschungsgemeinschaft and the Bundesministerium für Bildung und Forschung (Brain Imaging Center West). Philipp Meyer thanks the Center of Molecular Medicine Cologne, University of Cologne, Germany, for supporting his PhD thesis, of which this work is a part.
References
- Received for publication August 23, 2005.
- Accepted for publication October 31, 2005.


Jump to section
Related Articles
Cited By...
- No citing articles found.