


Abstract
It is widely recognized that radiopharmaceuticals are generally distributed nonuniformly in tissues. Such nonuniformities are observed over the entire range of spatial levels, ranging from organ to subcellular levels. The implications of nonuniform distributions of radioactivity for dosimetry, and ultimately for the biologic response of tissues containing radioactivity, have been investigated extensively. However, there is a paucity of experimental data on the distribution of cellular activity within a population of cells. In the present study, the distribution of activity per cell is experimentally determined and its implications for predicting biologic response are examined. Methods: Chinese hamster V79 cells were exposed to different concentrations of 210Po-citrate. The radiolabeled cells were washed, seeded into culture dishes or glass slides, covered with photographic emulsion, and stored in an opaque container. Subsequently, the emulsion was developed, thereby resulting in observable α-particle tracks that were scored. Results: The distribution of activity per cell was found to be well described by a log normal distribution function. Theoretic modeling of cell survival as a function of mean activity per cell showed that survival curves differed substantially when the activity per cell was log normally distributed versus when it was assumed conventionally that every cell in the population contained the mean activity. Conclusion: The present study provides experimental evidence of log normal cellular uptake of radioactivity. Theoretic calculations show that a log normal distribution of cellular activity can have a substantial impact on modeling the biologic response of cell populations.
It is widely recognized that radiopharmaceuticals are generally distributed nonuniformly in tissues. Such nonuniformities are observed over the entire range of spatial levels, including organ, suborgan, multicellular, cellular, and subcellular levels (1,2). Their implications for dosimetry, and ultimately for the biologic response of tissues containing radioactivity, have been investigated extensively. Nonuniform distributions of radioactivity have the greatest impact on dose distributions produced by radionuclides that emit short-range radiations, such as α-particles and Auger electrons (3). Accordingly, considerable effort has been devoted to the dosimetric consequences of microscopic nonuniformities of these radionuclides.
A generalized microdosimetry framework was developed for internal sources that has served as the starting point for many subsequent investigations (4). For lack of available experimental data, it was assumed that radionuclides were distributed randomly with a Poisson distribution and elegant microdosimetric spectra were calculated for nonuniform distributions of radioactivity (4). Tisljar-Lentulis et al. calculated specific energies deposited by 239Pu and 131I using a theoretic model consisting of spheric cells in closely packed geometry (5). The dependence of the distribution of specific energy on specific activity (e.g., activity per cell) was examined. These, and other, studies (6) paved the way for a variety of analyses that examined the impact of microdosimetry on cell survival curves. These studies were prompted in part by the observation of nonlinear survival curves (7). Humm and Chin found that if the radioactivity was distributed uniformly among all of the cells, a monoexponential survival curve resulted (8). However, when the radioactivity was restricted to a fraction of the cell population, 2-component exponential survival curves emerged. This type of survival curve was also observed by others when cells were targeted with α-emitters (9,10). Their results suggest that not all cells were labeled uniformly with radioactivity. Roeske and Stinchcomb used analytic approaches to calculate microdosimetry spectra for cellularly localized α-particle emitters to evaluate cell survival fractions (11). They found good agreement between theory and experimental monoexponential survival curves. Charlton and Turner examined the impact of α-particle chord lengths on cell survival (12). Akabani and Zalutsky used histologic images to measure chord-length frequency distributions between source and target points for 211At in bone marrow (13). When applied to the survival of red bone marrow cells, their approach predicted monoexponential survival curves (13).
These microdosimetry studies generally assumed that radioactivity was distributed nonuniformly; however, it was assumed that the activity per labeled cell was the same. Cellular and multicellular approaches have made this assumption as well (14,15). In the present study, the distribution of activity per cell is experimentally determined in a culture of cells labeled with the radiochemical 210Po-citrate. These data are then used to examine the effect of activity distribution on cell survival.
MATERIALS AND METHODS
Overview
The distribution of radioactivity in tissues has been measured extensively using autoradiography. α-Particles produce straight, dense tracks that are readily observed (16). Autoradiography has been used to quantify activity distributions (13,17–20). In the present study, autoradiography is used to measure the distribution of activity among a population of cultured cells that were labeled with 210Po-citrate. It is important to note that the cells in this study were radiolabeled while in suspension culture so that each cell was uniformly exposed to the radiochemical—that is, measured differences in cellular uptake of radioactivity within a given population could not be attributed to differences in extracellular activity concentration.
Cell Line
Chinese hamster V79 lung fibroblasts were used in the present study. The different minimum essential media (MEMA, MEMB, and wash MEMA) and culturing conditions were described in detail in a previous publication (21). The plating efficiency was typically about 60%. All media and supplements used in this study were from Life Technologies. Cells were maintained in Falcon (Becton-Dickinson) 225-cm2 sterile tissue culture flasks at 37°C in a humidified atmosphere with 5% CO2 and 95% air and subcultured twice weekly or as required on reaching 80%–90% confluence. The cell line was tested to be free of Mycoplasma.
Radiochemical
PoCl4 in 2 mol/L HCl was obtained at a concentration of 74 MBq/mL from Isotope Products. 210Po-citrate was prepared by mixing PoCl4 solution with 1 mol/L sodium citrate in the ratio of 1:7 (final pH 5.8). This was diluted with MEMB in the ratio of 1:19 (final pH 6.9).
Radiolabeling with 210Po-Citrate
V79 cells were grown as monolayers in 225-cm2 Falcon flasks, washed with 20 mL of phosphate-buffered saline, trypsinized with 0.05% trypsin/0.53 mmol/L ethylenediaminetetraacetic acid, and suspended at 4 × 10⁶ cells per mL in MEMB. Aliquots of 1 mL were placed in sterile 17 × 100 mm Falcon polypropylene round-bottom culture tubes and placed on a rocker-roller (Fisher Scientific) for 3−4 h at 37°C in an atmosphere of 95% air and 5% CO2. After this conditioning period, 1 mL of MEMB containing 210Po-citrate was added to arrive at a final concentration of 0−67 kBq/mL (pH 6.9−7.0). The tubes were returned to a rocker-roller at 37°C in 95% air and 5% CO2. After 30 min, the cells were washed 3 times with wash MEMA, resuspended in 5 mL of MEMA, and passed 5 times through a 21-gauge needle. The cell concentration in each tube was determined with a calibrated Coulter model ZM (Coulter Electronics). Aliquots (500 μL) of the cell suspension were transferred to vials containing 5 mL Ecolume liquid scintillation cocktail (MP Biomedicals) and counted in a Beckman LS5000 liquid scintillation counter for 210Po activity, and the mean activity per cell <ao> was determined (counting efficiency, 50%). Aliquots of labeled cell suspension were also mixed 1:1 with 4% trypan blue solution (Fluka Chemie). These cells were loaded into a hemocytometer and viewed at 100× magnification, and the number of live (trypan blue negative) and dead (trypan blue positive) cells was scored in about 3,000 cells. The percentage of dead cells in the populations labeled at 0−67 kBq/mL ranged from 3.0% to 3.1%.
Autoradiography
After washing the cells, 20,000 cells were seeded in triplicate into Falcon 35 mm × 10 mm culture dishes (Becton-Dickinson) containing 2 mL MEMA and then incubated. Three culture dishes were seeded with unlabeled control cells. Twenty-four hours after seeding, the dishes were washed 3 times with normal saline, fixed with 100% ethanol, and allowed to air dry (experiment A). Alternatively, 20,000 washed cells were immediately and gently smeared on a clean microscope slide that was then briefly passed over the flame of a Bunsen burner. These cells were not subjected to ethanol fixation (experiments B and C). The dishes were taken into a dark room, and a small volume of Kodak NTB emulsion that was sufficient to cover the bottom of the dish was applied. The dish was then tipped upside down at an angle and allowed to drain and dry. Slides were dipped in GE Amersham Hypercoat EM-1 emulsion, stood upright, and allowed to drain and dry for 10 min. The dishes or slides were then placed in black boxes containing predried Dry-Rite crystals (W.A. Hammond DRIERITE Co. Ltd.) to minimize the humidity, sealed with opaque tape, and maintained at 4°C to allow for accumulation of 210Po decays. Each box also contained one control dish or slide. The exposure times were varied depending on the desired track density. The emulsion was developed in Kodak D19 developer for 10 min. The dishes or slides were quickly rinsed with deionized water, and then a fixer solution was added for 5 min and removed. Upon drying, the resulting α-particle tracks were observed under phase-contrast with an Olympus IX70 inverted microscope with 400× magnification equipped with a digital camera. The number of tracks per cell was scored in the cells in each dish or slide. Only clearly visible tracks with a length greater than 2−3 μm were scored. Cells with up to 9 tracks per cell were scored according to their specific number of tracks. Because of the uncertainties associated with counting large numbers of overlying tracks, cells with >9 tracks per cell were recorded as >9. The subcellular location of the decays (cytoplasm or nucleus) was scored accordingly for experiment A. No background tracks were visible in controls. The tracks were scored in 500−1,200 cells for each 210Po-citrate concentration and emulsion exposure time.
Analysis of Track Data
Only datum where >20 cells were scored in a given category (e.g., 20 cells with 9 tracks/cell) were used in the analysis. This approach ensured that each datum was scored to within an uncertainty ( ) of <20%. Because of this statistical constraint, and because cells with >9 tracks per cell could not be scored, any given dish or slide could provide the track distribution within only a limited range of tracks per cell. Therefore, datasets with different exposure times were convolved to obtain a complete distribution of tracks per cell. This was done by decay correcting the data for each time point to the latest time point in the set and then normalizing the data using overlapping regions of the data. To shed more light on this process, consider the following example taken from our data where the cells were treated with 0.52 kBq/mL. After 7 d of decay accumulation, a maximum of 6 tracks was found in any given cell and many of the cells had no tracks. The remaining dishes or slides were maintained for a longer time (26 and 52 d) to accumulate additional decays with the aim of reducing the percentage of cells with zero tracks and increasing the number of cells with >6 tracks per cell. As expected, the number of zero-track cells was greatly reduced; however, the number of cells with an unscoreable number of tracks per cell (>9) was substantial. The numbers of tracks per cell from the 7-d exposure data were decay corrected to 52 d (i.e.,
  and then normalized so that the percentage of cells from the 7-d decay-corrected data with >9 tracks was equal to the number of cells with >9 tracks in the 52-d data. The same approach was also used for the 26-d data. In this manner, a complete convolved track distribution for a 52-d exposure was obtained, with the 52-d data providing the distribution for the lower multiplicity of convolved tracks (0 ≤ convolved tracks ≤ 9), the 7-d data providing the distribution of the higher multiplicity (11 ≤ convolved tracks ≤ 32), and the 26-d data providing the distribution in the overlapping region (4 ≤ convolved tracks ≤ 15).
Determination of Activity Distribution Among the Cell Population
After exposing the emulsion for a time τ, the number of tracks observed in a given cell at time τ is N(τ), which is directly proportional to the cumulated activity in that cell ã(τ) according to: Eq. 1where η is the track detection efficiency. The cumulated activity may be expressed as:
 Eq. 2where ao is the initial activity in that cell at t = 0 and Tp is the physical half-life of the radionuclide (Tp = 138 d for 210Po). Thus, the track data can be used to obtain the initial activity in a given cell, ao, by solving Equation 2 for ao and substituting in ã(τ) from Equation 1:
 Eq. 3
Eq. 3
The track detection efficiency η can be obtained from the experimentally determined mean cellular activity <ao> and the mean number of tracks per cell <N(τ)> in the cell population. Note the difference in notation for the activity in a given cell, ao, and the mean activity in the cell population <ao>: Eq. 4As described above, <ao> was obtained experimentally by measuring activity in aliquots of labeled cell suspensions. The quantity <N(τ)> must be obtained from the track distribution data. One possibility is to obtain <N(τ)> from discrete raw track data at a single exposure time. In this case, the data would be expected to follow a Poisson distribution. However, the breadth of the track distribution data from a single exposure time does not fully describe the entire distribution (Results). Therefore, it is essential to use the convolution process described above to completely define the distribution. The convolution process results in noninteger track values. Hence, the convolved track data are continuous and should be represented with a continuous function. Supporting this line of reasoning is that the activity distribution, which will be obtained from the convolved track distribution, is continuous. For 210Po-citrate, the convolved track distribution data are well represented by a log normal function of the form (22):
 Eq. 5where N is the number of convolved tracks, μN is the scale parameter for the convolved track distribution, σ is the shape parameter, and g is a constant. Mathematically, this distribution function has 4 raw moments and 3 central moments. Integration of these moments gives a variety of statistical quantities, including the arithmetic mean, variance, skewness, kurtosis, and coefficient of variation (CV) (http://mathworld.wolfram.com/LogNormalDistribution.html). The expectation value <N> (also known as the arithmetic mean) is given by (22):
 Eq. 6The remaining statistical quantities are provided in Equation 7 (22):
 Eq. 7
Eq. 7
Because the cellular activity is directly proportional to the number of convolved tracks (Eq. 3), the distribution of activity per cell is also described by a log normal function. The mean initial cellular activity <ao> and the statistical quantities for the log normal activity distribution can be obtained from Equations 6 and 7 by substituting μa for μN, where μa is the scale parameter for the activity distribution. Accordingly, <ao> is given by: Eq. 8The normalized probability density function for the initial cellular activity ao can be written as:
 Eq. 9This function satisfies several conditions, including
  and
and  The cumulative distribution function
  for the log normal distribution is:
 Eq. 10where erf(x) is the error function. The erf function follows the symmetry relation erf(–x) = –erf(x). It should be noted that
  , which implies that the distribution is normalized.
The properties of the log normal function, coupled with Equation 3, dictate that the shape parameter σ for the activity distribution is the same as that for the convolved track distribution. However, the scale parameter μa will be determined by the experimentally measured value of <ao>. Solving Equation 8 for μa yields the scale parameter for the log normal distribution of activity per cell for a given <ao>: Eq. 11
It can be helpful to write the probability density function for the log normal distribution in terms of the experimentally determined <ao> and the shape parameter σ. Substituting μa from Equation 11 into Equation 9 yields: Eq. 12Thus, only the mean activity per cell <ao> and the shape parameter σ are needed to describe the probability density function. If <ao> is known experimentally, then only σ is required.
RESULTS
Mean Cellular Activity
As shown in Figure 1, measurements of activity in aliquots of radiolabeled cell suspensions revealed that <ao> was linearly dependent on the extracellular concentration C of 210Po-citrate over the range of concentrations studied (<ao> = k C, k = 0.027 ± 0.0012 (mBq/cell)/(kBq/mL)). This value is similar to our earlier measurements of cellular uptake of 210Po-citrate in this cell line (23). Measurements after radiolabeled cells were incubated for 24 h in culture medium revealed that <ao> decreased by ∼50% of the initial value when cells were labeled at low concentrations of 210Po-citrate (3−4 kBq/mL), whereas no change was observed when cells were labeled at high concentrations (31−38 kBq/mL). Ethanol fixation of the cells, immediately after radiolabeling or after culturing the radiolabeled cells for 24 h, also reduced <ao> by ∼50%.

Initial mean cellular activity <ao> as function of activity concentration C of 210Po-citrate in culture medium for representative experiment. Error bars represent SD of mean for 3 replicate measurements of <ao> and C. Solid line represents linear least-squares fit of the data.
α-Particle Tracks
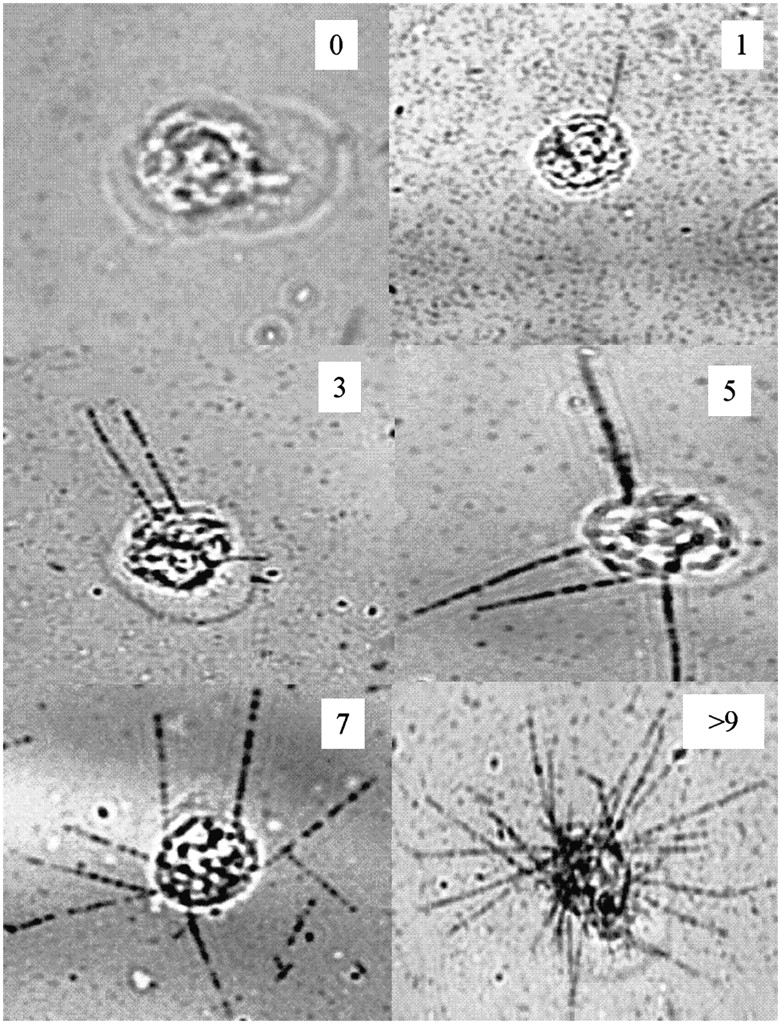
Figure 2 shows representative photographs of α-particle tracks in V79 cells that were labeled with 210Po-citrate. Cells with 0, 1, 3, 5, 7, and a large number of tracks (>9) are shown. The length of the track depends on its angle of trajectory. Given that the cell diameter of a V79 cell is about 10 μm, it is apparent that the length of the long tracks in Figure 2 roughly correlates with the range of the 210Po 5.3-MeV α-particles in Kodak NTB emulsion, which is 21.5 μm (24). This contrasts with their range of 40 μm in water (25). Given the stringent scoring requirement of only counting tracks with lengths >2−3 μm, solid angle arguments suggest that only about 10% of the decays will yield a scoreable track when the emulsion thickness is 1 μm.

Autoradiographs of cells within a population exposed to culture medium containing 67 kBq/mL of 210Po-citrate. These images show cells with 0, 1, 3, 5, 7, and >9 α-particle tracks, demonstrating wide variation in cellular uptake of 210Po-citrate.
Subcellular Distribution of Decay Sites
The subcellular compartment in which the radioactive decay took place (i.e., where the track was initiated) was scored for experiment A (7 d). About 35% of the intracellular radioactivity was in the cell nucleus and 65% in the cytoplasm when a single decay took place in the cell. When 2 decays occurred in the cell (2 in cytoplasm, or 2 in nucleus, or 1 in cytoplasm and 1 in nucleus), then 33% and 67% of them were in the cell nucleus and cytoplasm, respectively. These values correspond closely with earlier measurements (28% and 72%, respectively) that used a slightly different 210Po-citrate recipe (210Po dissolved in 3N nitric acid), no fixation with ethanol, and subcellular fractionation techniques to isolate the cell nuclei (23).
Distribution of α-Particle Tracks per Cell
Figure 3 shows the distribution of tracks per cell after cells were radiolabeled with 210Po-citrate. Figure 3A shows the data for experiment A. When the emulsion was developed after 7 d of exposure, a maximum of 6 tracks was counted in any given cell and many of the cells had no tracks (∼45%). When samples were developed 26 d after applying the emulsion, the number of zero tracks was ∼10%. The percentage of cells with zero tracks at 52 d (∼14%) was almost the same as for the 26-d data (Fig. 3A). Figures 3B and 3C show the track data for experiments B and C, respectively. The percentages of cells with zero tracks were somewhat lower in these datasets (3.4% and 3.3%, respectively). It is evident from the keys of Figures 3A–3C that the required exposure times shorten as <ao> increases.
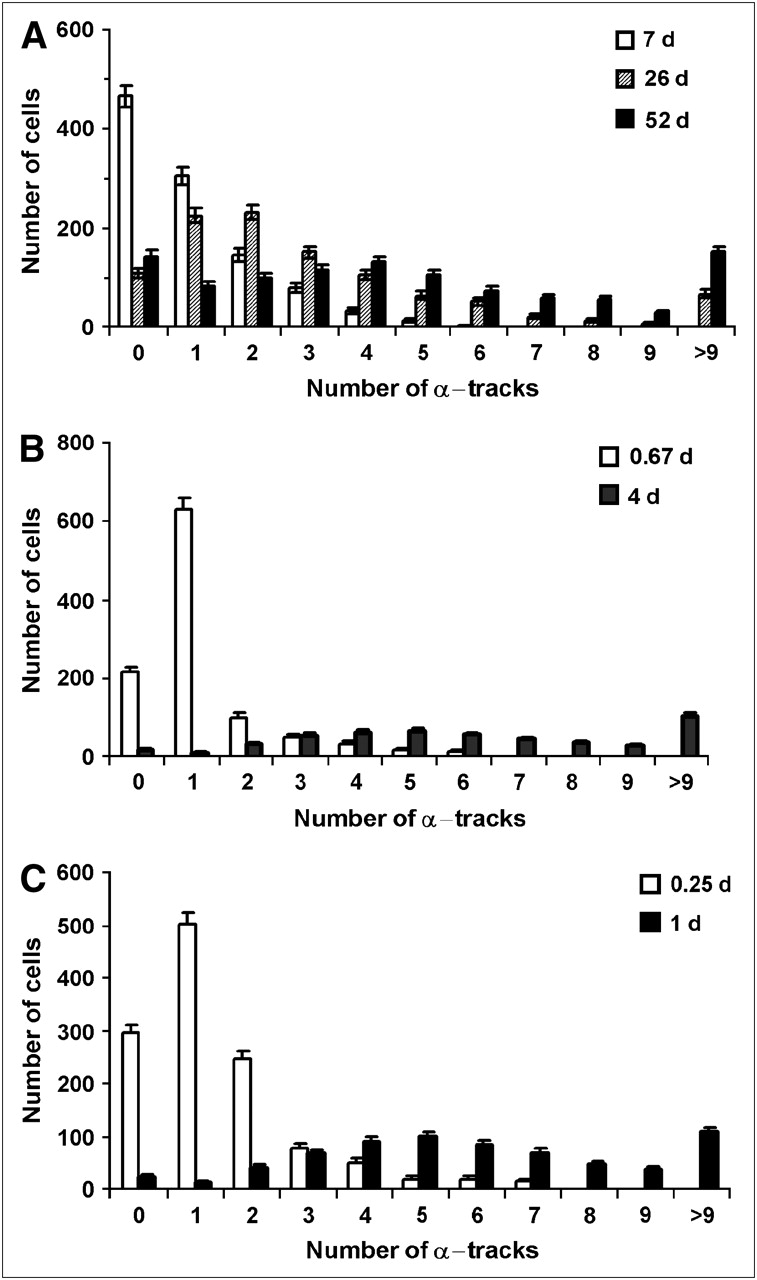
Distribution of α-particle tracks in cells that were incubated in culture medium containing 210Po-citrate: 0.52 kBq/mL (A), 3.8 kBq/mL (B), 67 kBq/mL (C). <ao> was 0.054, 0.12, and 1.8 mBq per cell in A, B, and C, respectively. Decays were allowed to accumulate for different times, as indicated in the keys in A–C.
As pointed out in the Materials and Methods, it is apparent from Figure 3 that any given set of discrete track data (e.g., 7, 26, or 52 d) can provide the distribution within only a limited region of tracks per cell. Accordingly, the data in Figures 3A–3C are convolved and presented in Figures 4A–4C. The zero track data were not included in the convolved data for the following reasons: (a) Many of the cells with zero tracks would eventually evolve into cells with tracks if the emulsions were exposed for longer periods of time, (b) the log normal distribution requires values > 0, and (c) trypan blue exclusion measurements indicate that about 3% of the cells—both control cells and labeled cells—were not viable, and these nonviable cells do not participate in the subsequent measurement of biologic endpoints such as colony-forming survival assays. These aspects are further discussed in both the Materials and Methods and the Discussion. A nonlinear least-squares fit to the data using the log normal function (Equation 5) was used. The fitted parameters (μN, σ) and other statistical quantities for the convolved track distribution are given in Table 1. The goodness of the fits is evident from the curves in Figures 4A–4C and the R2 values in Table 1. The mean number of convolved tracks per cell <N>, calculated using Equation 6, were 7.1, 6.9, and 6.7 for Figures 4A, 4B, and 4C, respectively. These values of <N>, along with the experimentally measured values of <ao> and the exposure time τ, were substituted into Equation 4 to obtain track detection efficiencies (η) of 3.3%, 16%, and 4.3% in each case, respectively. These are about the same as our rough estimates based on solid angle arguments. Finally, the initial activity per cell ao corresponding to a given number of convolved tracks was calculated using Equation 3. These ao data were used as the basis for defining the upper abscissae in Figures 4A–4C. As expected, least-squares fits to these activity data using Equation 5 (substituting N→ao and μN→μa) yielded the same shape parameters σ, but different values of the scale parameter. The fitted parameters μa and σ are given in Table 2 along with the statistical quantities related to the activity distribution. Finally, it is interesting to note that fixing cells with ethanol does not substantially alter the shape of the distribution as evidenced by a comparison of Figure 4A (fixed) with Figures 4B and 4C (not fixed).

Distribution of convolved α-particle tracks (lower abscissae) and initial cellular activity (upper abscissae) in cell populations having mean activity per cell <ao> of 0.054 mBq per cell (A), 0.12 mBq per cell (B), and 1.8 mBq per cell (C). α-Particle tracks are result of convolving the data shown in Figure 3. Data arising from different decay accumulation times are denoted with different symbols: (A) 52 d (•), 26 d (▪), 7 d (▴); (B) 4 d (•), 0.67 d (▴); and (C) 1 d (•), 0.25 d (▴). The close correspondence of convolved data from different time points supports the accuracy of the convolution approach. Error bars represent SE. Cellular activity was calculated from track data using Equation 3. Curve represents least-squares fit of Equation 5 to convolved track data. Details regarding fitted parameters and corresponding statistical quantities are given in Table 1. Parameters related to cellular activity are given in Table 2.
Fitted Parameters and Statistical Quantities for Log Normal Convolved Track Distributions
Fitted Parameters and Statistical Quantities for Log Normal Activity Distributions
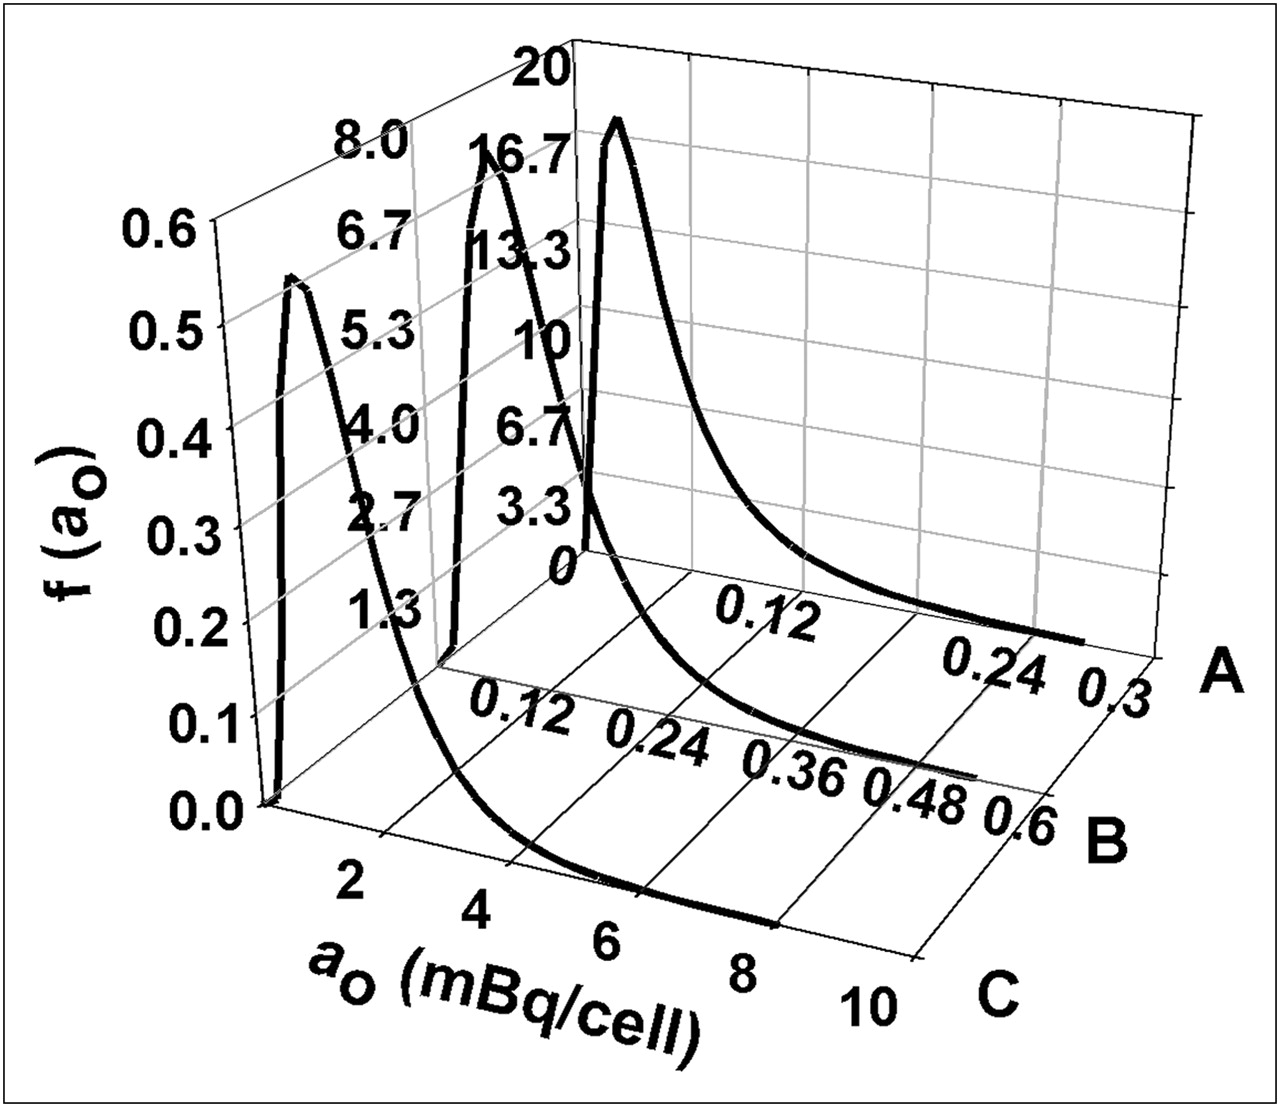
The log normal probability density functions for the initial cellular activity ao, defined by Equation 9 and the fitted parameters in Table 2, are depicted in Figure 5. Note that the normalization requirement inherently contained within Equation 9 results in a rescaling of the ordinate f(ao) as one moves from low <ao> (Fig. 5A) to high <ao> (Fig. 5C). This can be understood more fully with the cumulative distribution function F(ao) in Equation 10. In each case, the cumulative distribution function limits to a value of 1.

Log normal probability density function f(ao) vs. initial cellular activity ao for 3 different mean cellular activities <ao>: 0.054 mBq per cell (A), 0.12 mBq per cell (B), 1.8 mBq per cell (C). Probability density functions were obtained using Equation 9 and parameters μa and σ from Table 2.
DISCUSSION
Ultimately, it is desired to know the activity distribution at the cellular level among a large population of cells that have been labeled with a radiopharmaceutical. The number of tracks in a given cell is directly proportional to the cumulated activity, which, in turn, is directly proportional to cellular activity. Therefore, the distribution of tracks per cell can also be used to describe the distribution of activity per cell. The distribution of convolved tracks per cell represented by the data points shown in Figure 4 indicates that there is a wide variation in cellular uptake of 210Po-citrate despite the fact that these cells were suspended in the same extracellular concentration of the radiochemical. This variation in cellular activity can have a considerable impact on the biologic response of the cell population. Accordingly, it may be of considerable importance to quantify mathematically the distribution for subsequent use in predicting biologic response (26,27). In view of the trend of the data in Figure 4, a log normal function was selected to fit the data. No attempt was made to establish a biologic basis for this function and more complex distribution functions were not considered. Nevertheless, the log normal function provided a reasonable fit to the data with only 2 parameters—namely, the scale parameter μ and the shape parameter σ. It is evident that the log normal distribution exhibits the desired property of nonnegativity despite the large skewness of the distribution. The motivation for using the log normal distribution rather than the normal (Gaussian) distribution is apparent in the present case and has been discussed in detail for many other scientific applications (27). In fact, log normal distributions are so prolific in biology (27) that one might almost anticipate such a distribution for cellular uptake of radioactivity.
It is of interest to compare the percentage of cells with zero tracks as predicted by the log normal distribution (i.e., <1 track) with the measured percentages of cells with zero tracks. Using the fitted values for the parameters μN and σ, one can calculate the predicted number of cells with zero tracks at the maximum exposure time for any given dataset (i.e., 52 d, 4 d, and 1 d in Figs. 3A, 3B, and 3C, respectively) using the cumulative distribution function by substituting ao→N and μa→μN into Equation 10. Using this approach, the probability for the number of convolved tracks to be <1 is predicted to be 2.0%, 0.13%, and 0.053%, for experiments A, B, and C, respectively (Table 1, last row). The measured percentages of cells with zero tracks for the corresponding experiments were 14%, 3.4%, and 3.3% (Figs. 3A–3C, 0 tracks, filled bars). As mentioned in the Results, trypan blue exclusion measurements indicated that about 3% of the cells were nonviable and may not have taken up 210Po-citrate. Subtraction of the 3% that corresponds to nonviable cells from the measured percentages of zero tracks yields corrected values of 11%, 0.4%, and 0.3%. The differences between the corrected and predicted values are likely to be related to the fact that latent images that form early in the exposure period are liable to fade during long exposure times, particularly in the presence of oxidizing agents and moisture. In fact, our data for the 52-d exposure had slightly more cells with zero tracks (14%) than did the data for the 26-d exposure (11%) (Fig. 3A). Incidentally, this argument coincides with an observation of Yagoda and Kaplan (17), who showed that when development of the emulsion was delayed for 10 d, the track count was reduced by 9.2%. They attributed this to partial fading of the older tracks (17). With these considerations in mind, our predicted and experimental percentages of cells with zero tracks are in good agreement. However, this statement should be tempered by the fact that the dark background of the emulsion precluded correlating zero track cells with trypan blue−positive cells.
It is evident from Figure 5 that, for 210Po-citrate, the shape of the log normal probability density function is essentially the same regardless of the mean initial activity per cell <ao>. Furthermore, <ao> is linearly dependent on the concentration of 210Po-citrate to which the cells are exposed in the present study (Fig. 1). Therefore, it is important to recognize the impact that the magnitude of <ao> has on the log normal probability density function. Figure 5 shows how the probability density functions change when the mean activity per cell <ao> is increased (i.e., expose the cells to correspondingly higher concentrations of extracellular activity). The shape parameter is similar in each case (Table 2); however, the scale parameter μa depends on the mean cellular activity <ao> according to Equation 11. In fact, it can be shown that if the mean activity is increased by an order of magnitude, the corresponding values of f(ao) scale down by the same order of magnitude while the shape of the function remains the same.
Given that the activity per cell can vary widely even when a clonal population of cells is identically exposed to a radiochemical, then, depending on the geometry of the cell population, the cellular absorbed doses may also vary similarly. Numerous studies have been performed that examine the implications of nonuniform distributions of radioactivity from the perspectives of both cellular dosimetry and microdosimetry (8,11,14,28,29). Although specific consideration of both labeled and unlabeled cells was considered, the paucity of experimental data on distribution of activity per cell required the assumption that the activity per cell among the labeled cells is constant. Accordingly, little attention has been devoted to the implications of variations in cellular uptake of radioactivity within the labeled population of cells. The present data, which quantitatively describe the nonuniform distribution of activity among a clonal population of cells, can be used to study the impact of such a distribution on the biologic response of a cell population. To focus solely on the impact of activity distribution, the stochastic nature of energy deposition by individual intracellular decays will be ignored. With this assumption, and assuming that the cells are sufficiently far from one another for there to be no cross-irradiation, then the mean cellular absorbed dose in a given cell is directly proportional to its initial cellular activity. Therefore, for radionuclides that emit high-LET (linear energy transfer)−type radiations, the fraction of surviving cells SF can be expressed as: Eq. 13where a37 is the mean lethal cellular activity. When assessing the lethality of incorporated radioactivity in cultured cells, the surviving fraction is generally measured as a function of the experimentally determined mean cellular activity <ao> (30). Substitution of Equation 12 into Equation 13 gives the surviving fraction of the cell population SF containing a log normal distribution of activity with mean cellular activity <ao>:
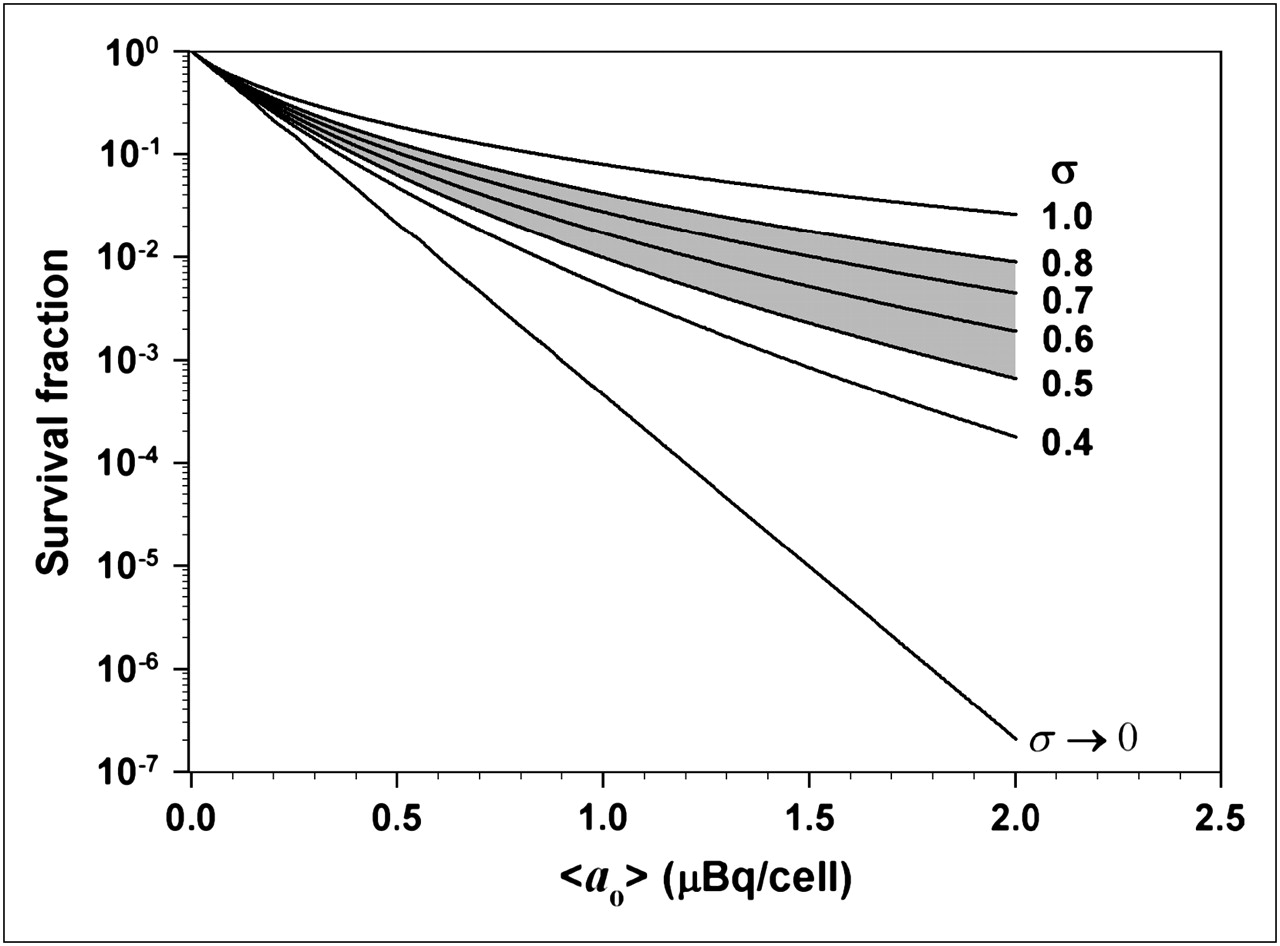
 Eq. 14To examine the consequence of a log normal activity distribution on cell survival, a numeric integration of Equation 14 was performed with a simple FORTRAN code, wherein it was assumed that a37 = 0.13 mBq per cell (23) and σ was varied from 0.4 to 1.0. For each value of σ, the survival fraction was calculated for numerous values of <ao> and plotted in Figure 6. These data were compared with survival fractions obtained when each cell in the population contains the same activity—namely, the mean cellular activity <ao> (i.e., σ→0 such that SF = exp(−<ao>/a37)). It is apparent that the impact of the log normal distribution on the response of the cell population is dependent on the shape parameter σ. The shaded portion of the graph highlights the data generated with σ values corresponding to the range of the fitted σ values given in Table 1. Interestingly, this type of tailing survival curve was not observed when V79 cells were exposed to 210Po-citrate (23); however, those experimental data included only 1 point below 10% survival. The log normal distribution does not have a profound effect on survival fractions above 10%. On the other hand, our recent studies with 210Po-citrate−labeled V79 cells in 3-dimensional cultures show significant tailing of survival curves (data not shown). Furthermore, 131I-iododeoxyuridine (131I-IdU)−labeled V79 cells in 3-dimensional culture also show a similar tailing of the survival curve (21). Modeling calculations, which took into account the percentage of labeled cells and assumed equal activity per labeled cell, gave good agreement with the experimental data when the survival fraction exceeded 1% (31). However, the model did not predict the tail in the survival curve. There it was suggested that the distribution of cellular uptake of radioactivity may play an important role in modeling the response to 131I-IdU (31). The findings in the present work support this premise.

Calculated cell survival fraction (SF) vs. mean activity per cell <ao> assuming a log normal distribution of activity per cell. Survival fractions were calculated for different values of σ according to Equation 14. Shaded region represents range of σ values that were observed for various 210Po activities used in the present studies. Condition σ → 0 represents the case where all cells in the population contain the same activity (i.e., SF = exp(−<ao>/a37). Note profound impact that shape parameter σ has on survival curve.
Although the present study highlights the importance of considering the distribution of cellular activity within a cell population when predicting biologic response, it should be pointed out that the mathematic nature of the distribution will determine its significance. For example, a very narrow distribution about the mean value might have little or no significant impact on the overall response of the population. Cellular uptake of Hoechst 33342, a flow cytometry dye for analyzing DNA content, often follows this pattern. However, log normal distributions are more likely the norm (27). Interestingly, most fluorescence cytometry reagents are best visualized under logarithmic amplification, thereby supporting this premise. Perhaps of more significance to nuclear medicine is the log normal uptake of PET radiopharmaceuticals in tumors (32). Nevertheless, the mathematic nature of the distribution will have to be determined experimentally for each radiopharmaceutical of interest. This will be important for radiopharmaceutical therapies in which targeting of single cells is necessary (33) as well as for micrometastases and larger tumors (34).
Though differences in cellular uptake of radioactivity within a population are indeed important, as pointed out by others, there are numerous other factors that must be considered when predicting the response to incorporated radionuclides. Among them are the types of radiations emitted, dependence of relative biological effectiveness (RBE) on LET, differences in RBE for self- and cross-dose, presence of cells that do not take up any radioactivity at all, stochastic nature of the decay process, dose rate, and subcellular distribution of the radioactivity (14,15,31,35–38). In addition, care must be exercised if there is saturation in the uptake of radioactivity by tissues. Under these circumstances, it is possible that the probability distribution for cellular activity may be altered. This list is by no mean exhaustive, thereby highlighting the complexity of the problem.
CONCLUSION
The present study provides experimental evidence for a log normal distribution of cellular radioactivity within a cell population. The shape characteristics of the distribution remain the same as the mean activity is increased. Theoretic calculations show that the presence of a log normal activity distribution can have a profound impact on modeling the biologic response of cell populations.
Acknowledgments
This work was supported in part by U.S. Public Health Service grant R01CA83838. We are grateful to Drs. Edouard I. Azzam, Sonia de Toledo, Massimo Pinto, and Manuela Buonanno for their assistance.
References
- Received for publication October 3, 2005.
- Accepted for publication March 6, 2006.


Jump to section
Related Articles
Cited By...
- The Emission of Internal Conversion Electrons Rather Than Auger Electrons Increased the Nucleus-Absorbed Dose for 161Tb Compared with 177Lu with a Higher Dose Response for [161Tb]Tb-DOTA-LM3 Than for [161Tb]Tb-DOTATATE
- Radium-223-Induced Bystander Effects Cause DNA Damage and Apoptosis in Disseminated Tumor Cells in Bone Marrow
- The Advantage of Antibody Cocktails for Targeted Alpha Therapy Depends on Specific Activity
- Ex Vivo Activity Quantification in Micrometastases at the Cellular Scale Using the {alpha}-Camera Technique
- Lognormal Distribution of Cellular Uptake of Radioactivity: Monte Carlo Simulation of Irradiation and Cell Killing in 3-Dimensional Populations in Carbon Scaffolds
- Cell-Level Dosimetry and Biologic Response Modeling of Heterogeneously Distributed Radionuclides: A Step Forward
- Changes in Lognormal Shape Parameter Guide Design of Patient-Specific Radiochemotherapy Cocktails
- Lognormal Distribution of Cellular Uptake of Radiopharmaceuticals: Implications for Biologic Response in Cancer Treatment
- The {alpha}-Camera: A Quantitative Digital Autoradiography Technique Using a Charge-Coupled Device for Ex Vivo High-Resolution Bioimaging of {alpha}-Particles
- MIRD Pamphlet No. 22 (Abridged): Radiobiology and Dosimetry of {alpha}-Particle Emitters for Targeted Radionuclide Therapy
- Lognormal Distribution of Cellular Uptake of Radioactivity: Statistical Analysis of {alpha}-Particle Track Autoradiography
- Further Explorations of Cellular Uptake of Radioactivity
- Log Normal Distribution of Cellular Uptake of Radioactivity
- Reply: Log Normal Distribution of Cellular Uptake of Radioactivity