


Abstract
Radiopharmaceuticals are generally distributed nonuniformly in tissue. At the microscopic level, only a fraction of the cells in tissue are labeled. Consequently, the labeled cells receive an absorbed dose from radioactivity within the cell (self-dose) as well as an absorbed dose from radioactivity in surrounding cells (cross-dose). On the other hand, unlabeled cells only receive a cross-dose. This work uses a novel approach to examine the lethal effects of microscopic nonuniformities of 131I individually on the labeled and unlabeled cells. Methods: A multicellular tissue model was used to investigate the lethality of microscopic nonuniform distributions of 131I. Mammalian cells (V79) were dyed with CFDA-SE (carboxy fluorescein diacetate succinimidyl ester) and labeled with 131I-iododeoxyuridine (131IdU). The dyed labeled cells were then mixed with equal numbers of unlabeled cells, and 3-dimensional tissue constructs (4 × 10⁶ cells) were formed by centrifugation in a small tube. This resulted in a uniform distribution of 131I at the macroscopic level but nonuniform distribution at the multicellular level, wherein 50% of the cells were labeled. The multicellular clusters were maintained at 10.5°C for 72 h to allow 131I decays to accumulate. The clusters were then dismantled and the labeled (dyed) and unlabeled (undyed) cells were separately seeded for colony formation using a fluorescence-activated cell sorter. Results: The unlabeled cells, which received only a cross-dose, exhibited a mean lethal dose D37 of 4.0 ± 0.3 Gy. In contrast, the labeled cells received both a self-dose and a cross-dose. Isolating the effects of the self-dose resulted in a D37 of 1.2 ± 0.3 Gy, which was about 3.3 times more toxic per unit dose than the cross-dose. The reason for these differences appears to be primarily related to the higher relative biological effectiveness of the self-dose delivered by 131IdU compared with the cross-dose. Theoretical modeling of the killing of labeled and unlabeled cells was achieved by considering the cellular self-doses and cross-doses. Conclusion: Cellular self-doses and cross-doses play an important role in determining the biological response of tissue to microscopic nonuniform distributions of 131I. Prediction of the biological response requires that both self-doses and cross-doses be considered along with their relative lethality per unit dose.
- 131I
- iodine-131
- iododeoxyuridine
- cellular dosimetry
- multicellular cluster
- V79 cells
- survival
- ionizing radiation
- β-particles
- radiation effects
- adverse effects
- therapeutic use
- fluorescence-activated cell sorting
The success of diagnostic and therapeutic nuclear medicine has depended on the capacity of radiopharmaceuticals to localize in different tissues of the body. The most striking example of this is perhaps the uptake of radioiodine by the thyroid. The exquisite specificity of Na131I in the thyroid has made this radiopharmaceutical a highly successful approach to diagnosing and treating thyroid disorders. Radiopharmaceuticals also distribute nonuniformly within organs, even down to the cellular level (1,2). This can often have a profound impact on the biological response of the tissue because the absorbed dose delivered by the emitted radiations can be similarly nonuniform, particularly for radiations having short ranges in tissue. Accordingly, correlation of biological response with absorbed dose delivered by radiopharmaceuticals has indeed been a challenge. It is apparent that the mean absorbed dose even to tissue elements, defined as a small region of tissue perhaps as small as 1 mm3, is often not an adequate variable for predicting biological response (2). Accordingly, efforts have been directed toward examining the absorbed dose at increasing levels of spatial detail even down to the cellular level (3–7). In fact, when the relative biological effectiveness (RBE) of the emitted radiations is accounted for, cellular dosimetry can be quite successful at correlating the biological response of isolated cells that contain radioactivity (8). The usefulness of cellular dosimetry at the tissue element level, often referred to as multicellular dosimetry, has yet to be validated. The problem is complex for a variety of reasons. For some radionuclides—particularly, Auger electron emitters such as 125I and very-low-energy β-emitters such as 3H—the RBE of the emitted radiations can depend on the subcellular distribution of the radionuclide (9–12). In these instances, the dose–response arising from decays within the same cell (self-dose) may be very different than the dose–response from decays in neighboring cells (cross-dose). Furthermore, radiopharmaceuticals generally distribute nonuniformly at the multicellular level so that the cells containing radioactivity (labeled) will receive a self-dose and a cross-dose, whereas the cells that do not contain radioactivity (unlabeled) will receive only a cross-dose (5). These nuances must be accounted for in order for multicellular dosimetry to be useful for predicting biological response.
Validation of the usefulness of multicellular dosimetry for predicting biological response of tissues containing nonuniform distributions of radioactivity has been hampered by the difficulty in measuring the response of each population of cells—namely, the labeled and unlabeled cells. With the advent of high-speed fluorescence-activated cell sorting (FACS), it is now possible to sort the 2 populations for independent analysis. In this work, we have exploited FACS, in conjunction with a well-established experimental model (13–16), to separately delineate the dose–response of labeled cells and unlabeled cells in a multicellular cluster. The labeled cells contained 131I-iododeoxyruridine (131IdU), a radiochemical that is incorporated into the DNA of the cell nucleus. The radionuclide 131I emits β-particles with a principal mean energy of 191 keV (17), which have a corresponding range in water of approximately 400 μm (18) or about 40 cell diameters. Accordingly, the labeled cells receive both self-dose and cross-dose, whereas the unlabeled cells receive cross-dose only. The responses of each population were quantified and this information was used to theoretically model the individual response of the labeled and unlabeled cells.
MATERIALS AND METHODS
Radiochemical and Quantification of Radioactivity
131I as Na131I was obtained from Perkin Elmer Life Sciences in 0.1N NaOH (13.6 GBq/mL). The radiochemical 131IdU was synthesized and purified by high-performance liquid chromatography in our laboratory according to procedures previously reported (19). The 131I activity was quantified with a Canberra HpGe (high-purity germanium) well detector (364.5-keV photopeak, photopeak efficiency = 0.33, yield = 0.812) or a Packard automatic γ-counter equipped with a 7.62-cm-diameter sodium iodide well crystal (overall efficiency = 0.78 in the 260- to 470-keV energy window). The radionuclide 131I undergoes β-decay with a physical half-life of 8.04 d.
Cell Line
Cultured Chinese hamster V79 lung fibroblasts were used in this study. The different minimum essential media (MEM) used are as follows: (a) MEMA: MEM with 10% heat-inactivated (57°C for 30 min) fetal calf serum (FCS), 2 mmol/L l-glutamine, 50 units/mL penicillin, and 50 μg/mL streptomycin; (b) MEMB: same as MEMA except that calcium-free MEM for suspension culture was used; (c) wash MEMA: same as MEMA except FCS was replaced with fetal bovine serum; and (d) MEMC: same as MEMA except phenol red–free MEM was used. Phenol red–free medium is required for the cell sorting phase of the experiment. All media and supplements used were obtained from Life Technologies. Cells were maintained in MEMA as monolayers in Falcon (Becton Dickinson) 225-cm2 tissue culture flasks in an incubator at 37°C in 5% CO2/95% air with 100% humidified conditions. The cells were subcultured twice weekly on reaching 80%–90% confluence. The plating efficiency for these cells in MEMA, under the culture conditions described, is generally 65%. The cell line was free of mycoplasma.
Assembly of Multicellular Clusters
Multicellular clusters containing nonuniform distributions of 131I were assembled according to protocols described in detail elsewhere (13–15). Briefly, V79 cells growing as monolayers in 225-cm2 Falcon flasks were washed with 20 mL of phosphate-buffered saline (PBS), removed from the flask with 0.05% trypsin containing 0.53 mmol/L ethylenediaminetetraacetic acid, and suspended at 2 × 10⁶ cells per milliliter in MEMB. Aliquots of 1 mL were placed in 2 sets of sterile 17 × 100 mm Falcon polypropylene round-bottom culture tubes (10 tubes in each set) and placed on a rocker-roller (Fisher Scientific) for 3–4 h in an incubator. After this conditioning period, 1 mL of MEMB containing various activities of 131IdU (0–148 kBq/mL) was added to one set of tubes (denoted “labeled”) and 1 mL of MEMB with no radioactivity was added to the second set of tubes (denoted “unlabeled”). All tubes were then returned to a rocker-roller kept inside the incubator. After a 14-h period of labeling with radioactivity, the tubes were removed and centrifuged at 2,000 rpm at 4°C for 10 min. Aliquots of the supernatant were used to check the concentrations of radioactivity added. The remaining supernatant was decanted, the cells in both sets of tubes were washed once with 10 mL of PBS containing 50 units/mL penicillin and 50 μg/mL streptomycin (PBS-PS) and then centrifuged for 5 min at 1,000 rpm, 4°C. Radiolabeled cells were loaded with a fluorescent Cell-Tracker dye (CFDA-SE [carboxy fluorescein diacetate succinimidyl ester], excitation 492 nm, emission 517 nm; Molecular Probes) by incubating the cells for 15 min at 37°C in 2 mL of 10 μmol/L dye in PBS. Unlabeled cells were also treated similarly by resuspending in 2 mL PBS. All tubes were set on a rocker-roller at 37°C for 15 min to allow CFDA-SE to passively diffuse into the cytoplasm of the cells where it is cleaved by intracellular esterases, becoming fluorescent. After 15 min of dye uptake, the tubes were washed once with 2 mL of prewarmed MEMA, again with 10 mL of wash MEMA, resuspended in 5 mL of MEMA, and passed through a 21-gauge needle 5 times to ensure a single-cell suspension. The cell concentration in each tube was determined with a calibrated Coulter model ZM cell counter (Coulter Electronics). The radiolabeled and subsequently dyed (2 × 10⁶) cells were mixed with an equal number of unlabeled cells that were neither labeled with radioactivity nor dyed but were treated in the same manner as labeled cells. The pooled cells were then centrifuged at 2,000 rpm, 4°C for 10 min. The supernatant was decanted, the pellets were disrupted, and the entire ∼ 200 μL of this final cell suspension was transferred directly to a sterile 400-μL polypropylene microcentrifuge tube (Helena Plastics). The tube was washed with an additional 200 μL of MEMA and the wash was transferred to the same 400-μL polypropylene microcentrifuge tube. The 400-μL tubes were then centrifuged at 1,000 rpm for 5 min at 4°C to form multicellular clusters. The resulting clusters contained 4 × 10⁶ cells (50% cells were radiolabeled/dyed) and weighed (7.9 ± 0.1 mg) (16). Clusters containing 50% unlabeled cells dyed with CFDA-SE and 50% unlabeled undyed cells served as controls. The tubes containing the clusters were maintained at 10.5°C. This temperature was selected because V79 cells can remain in the cluster configuration at this temperature for long periods of time (up to 72 h) without a decrease in plating efficiency. This was also true for V79 cells in suspension culture (13). The cells accumulate the preponderance of their radioactive decays while in the cluster configuration as opposed to the radiolabeling and colony-forming periods.
Determination of Surviving Fraction of Cells in Multicellular Clusters
After 72 h at 10.5°C, the supernatant was carefully removed and the tube was vortexed to disperse the cell cluster. The cells were resuspended in 10 mL of MEMC, transferred to 17 × 100 mm Falcon polypropylene tubes, washed 3 times with 10 mL of wash MEMC and resuspended in 2 mL of MEMC, and passed through a 21-gauge needle 5 times to disperse cells and to produce a single-cell suspension. The phenol red–free MEMC was used because phenol red interferes with the cell sorting. Aliquots were taken from each tube and the mean radioactivity per labeled cell was determined. The remaining cell suspension was transferred to Falcon 12 × 75 mm polystyrene tubes, which were wrapped with aluminum foil. The tubes were kept on a rocker-roller at 10.5°C and transferred to the cell sorter (Becton-Dickinson FACS Vantage).
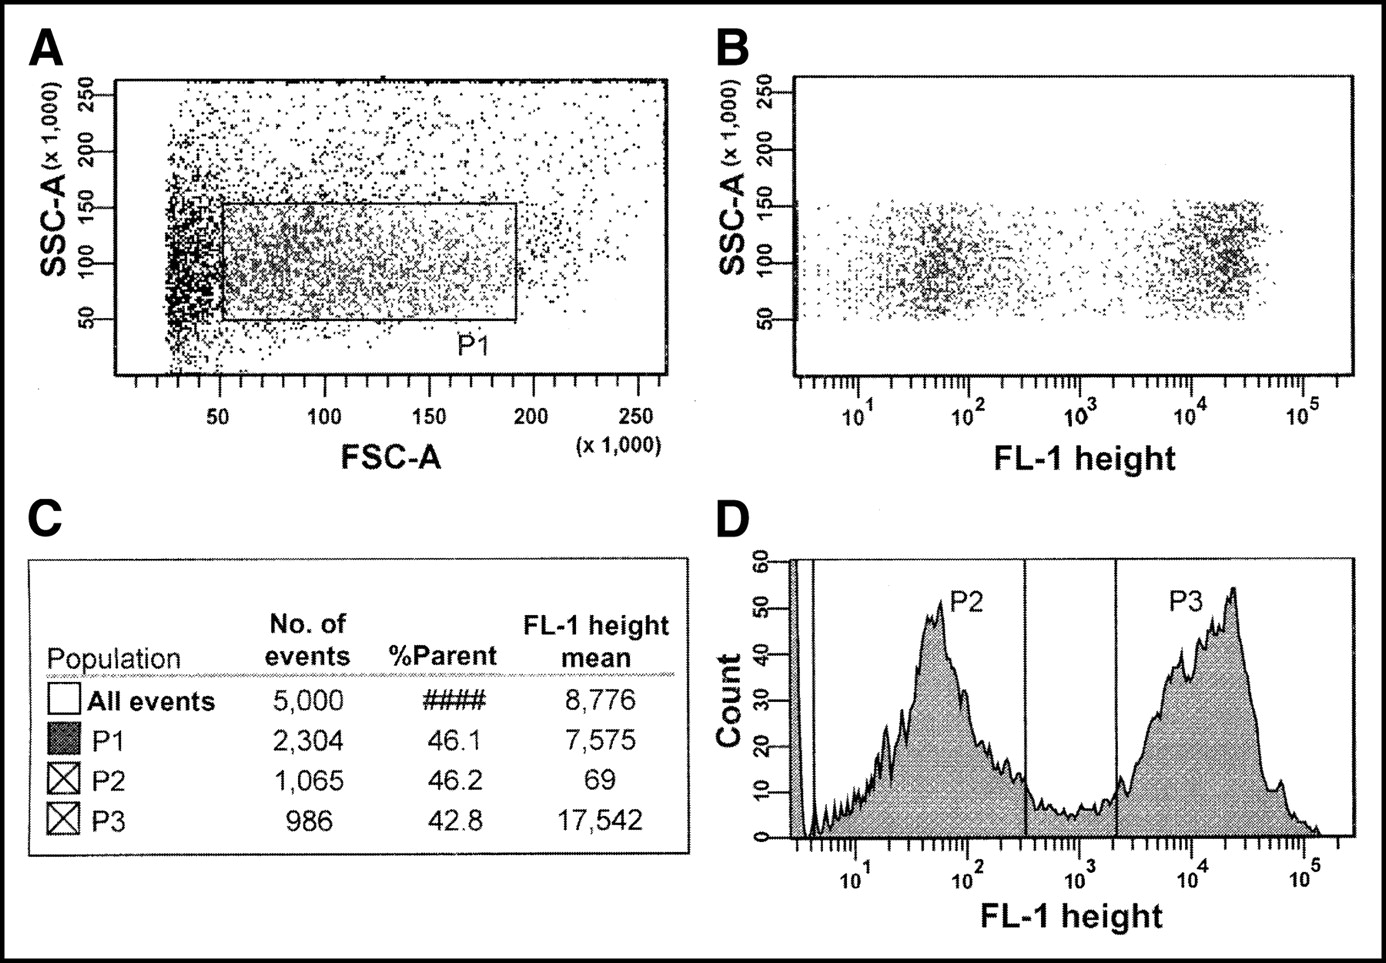
An air-cooled 488-nm argon-ion laser was used to excite the dye. The excitation and emission peaks of the fluorescent dye were 492 and 517 nm, respectively. Fluorescence in the FL-1 channel was collected along with the forward angle and 90° light scatter. The histograms from the cytometer were analyzed using DiVa software (Becton-Dickinson). The flow cytometer sorted both dye-positive (labeled and dyed) and dye-negative (unlabeled and undyed) cells and separately seeded them in triplicate into Falcon 6-well tissue culture plates containing 4 mL of MEMA with 2× penicillin and streptomycin (100, 1,000, or 10,000 cells per well). The 6-well plates were then placed in an incubator at 37°C with 5% CO2/95% air for 1 wk. The remaining unused cells were sorted into 2 tubes and subjected to flow cytometry to check the purity of sorted cells. Our experiments showed that the excitation and emission characteristics of CFDA-SE are well suited for cell sorting by FACS. Figure 1 shows the distribution of dye-positive and dye-negative cells.

Representative flow cytometric analysis of V79 cells from multicellular cluster containing 50% unlabeled cells and 50% cells labeled with 4.25 mBq per cell of 131IdU. The cells containing 131IdU were dyed with CFDA-SE. (A) Side scatter (SSC) vs. forward scatter (FSC) dot plot that was obtained with FACS Vantage cell sorter. Debris and aggregates were gated out as indicated by rectangle denoted P1. (B) P1-gated SSC vs. FL-1 height. (C) Number and percentage of events in each gate relative to parent gate and mean FL-1 height. (D) Distribution of undyed (P2 gate; unlabeled) and dyed (P3 gate; labeled) cells within P1 gate. Analysis indicated that, within P1 gate, 46.2% of cells were undyed, 42.8% were dyed, and remaining 11% were outside P2 and P3 gates. Dyed (P3) and undyed (P2) cells were automatically and separately seeded by FACS Vantage cell sorter in known numbers into 6-well plates. Cells outside P2 and P3 gates were discarded to ensure high degree of certainty in purity of dyed and undyed populations.
The plates were removed from the incubator after 1 wk and the colonies were washed 3 times with normal saline, washed 2 times with ethanol to fix, and stained with 0.05% crystal violet. The colonies were counted with a dissecting microscope (40× magnification). A colony count of 10–100 per well was considered a valid data point. The surviving fractions of labeled (dyed) and unlabeled (undyed) cells compared with parallel controls was determined for each radioactivity concentration.
RESULTS
No Migration of CFDA-SE Dye or Radioactivity
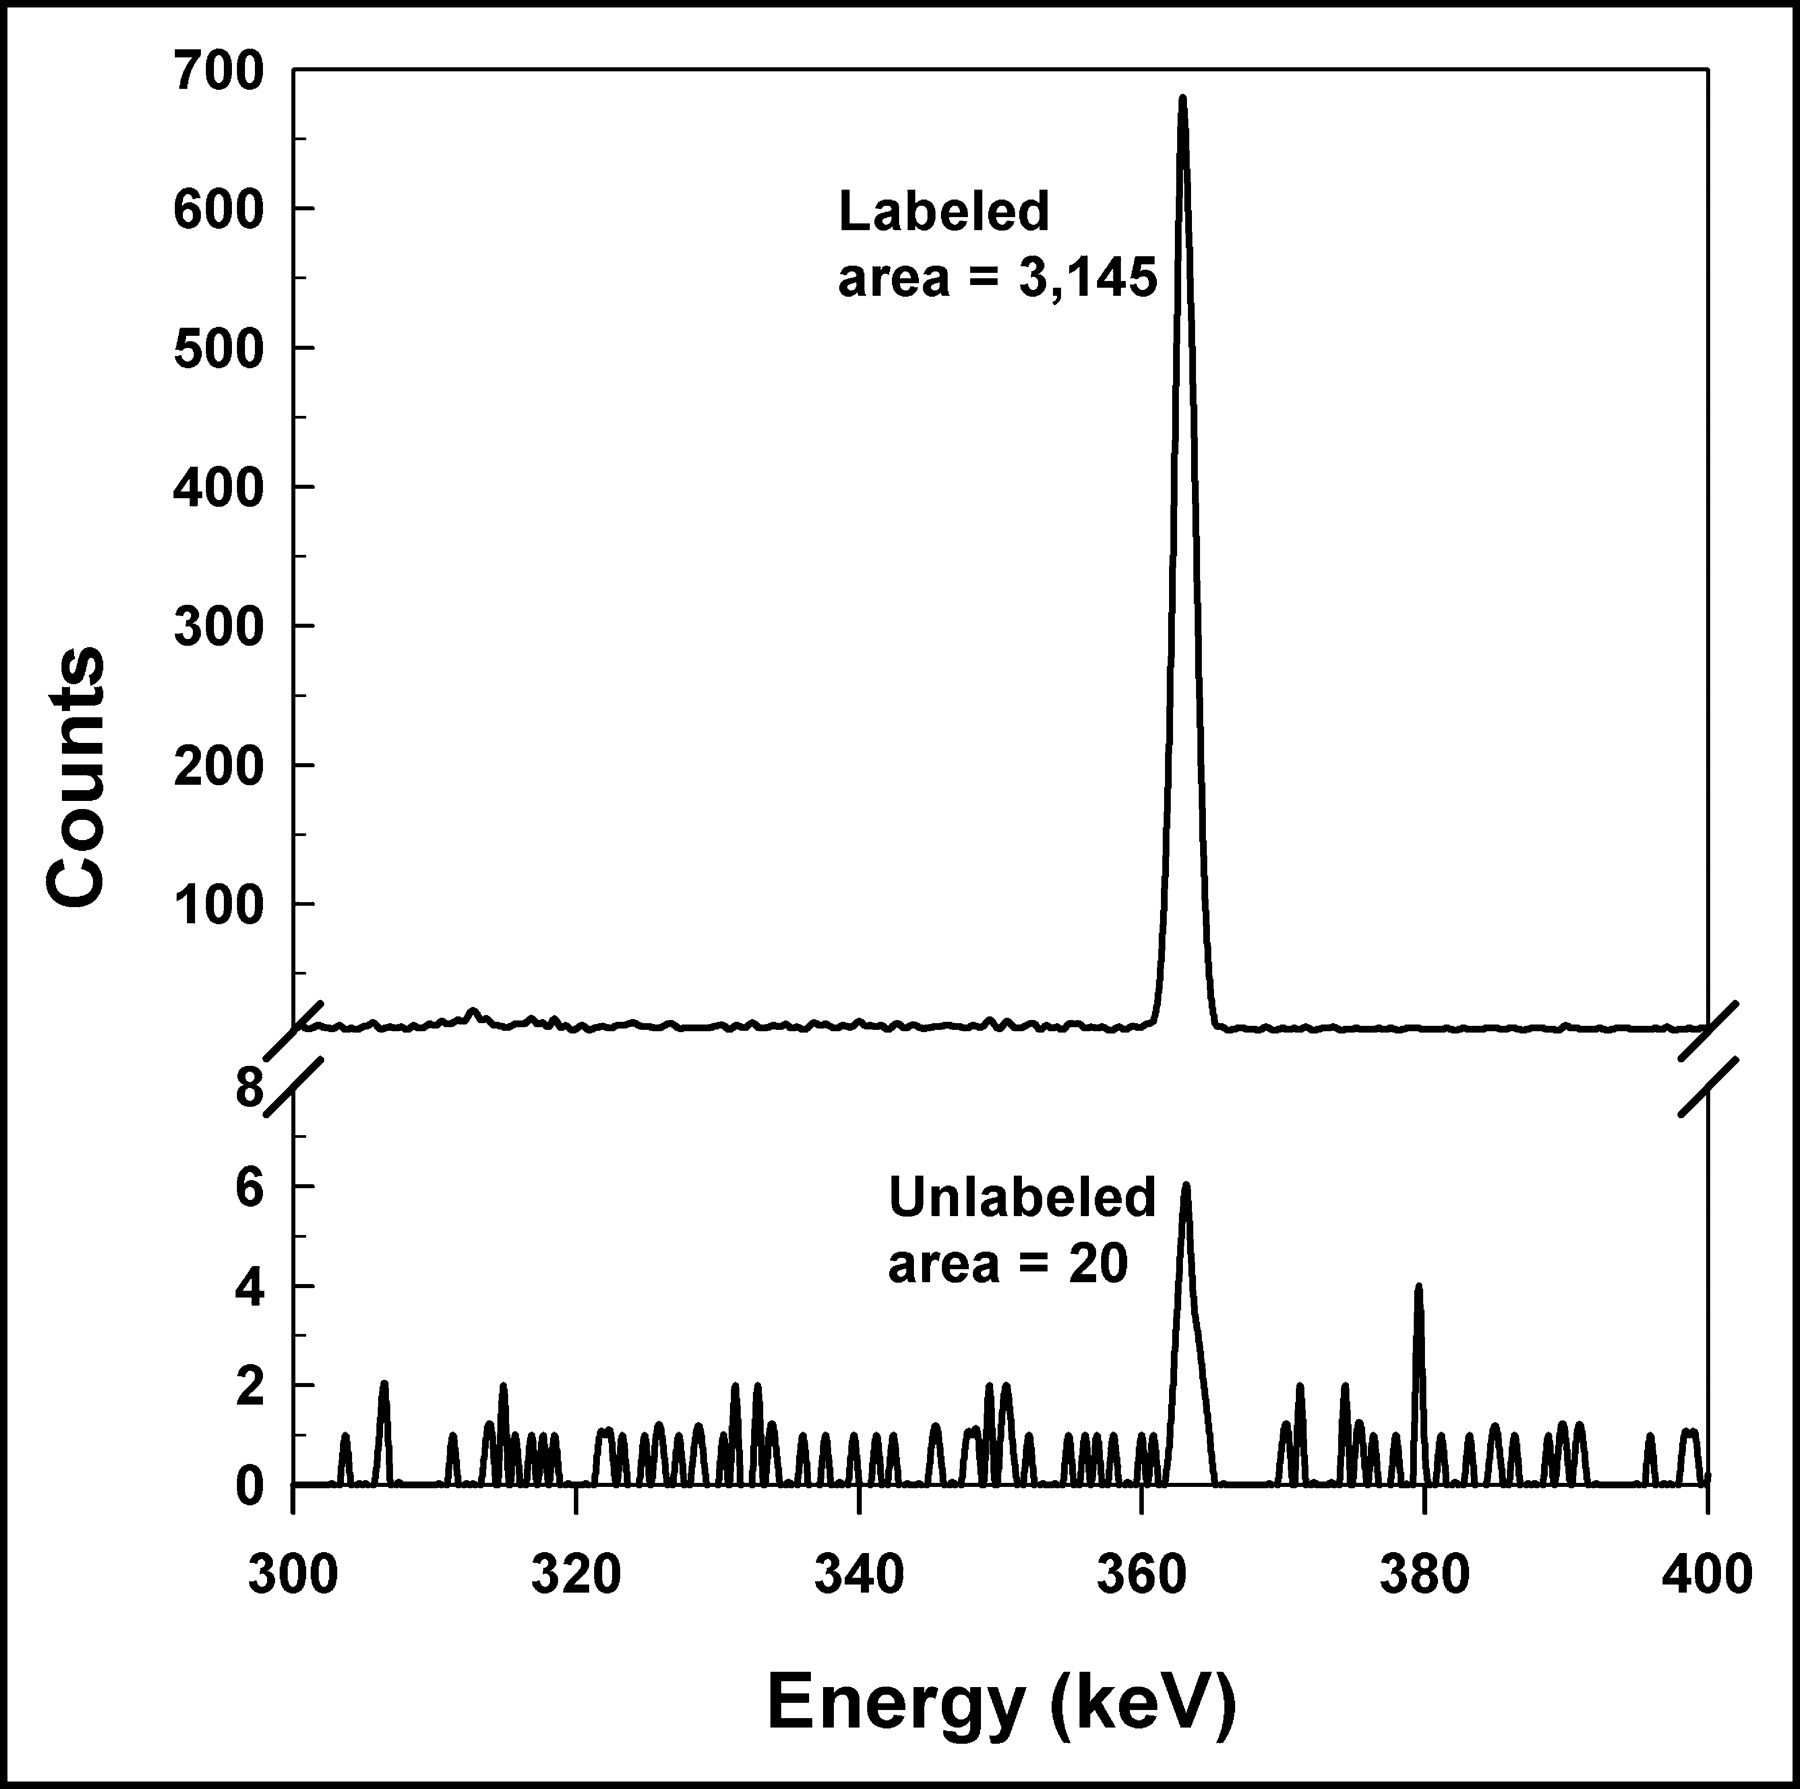
It can be seen from Figure 1 that the FACS analysis of cells from a cluster containing 50% dyed (labeled) cells and 50% undyed (unlabeled) cells after maintaining the cluster at 10.5°C for 72 h showed no appreciable dye transfer from dyed to undyed cells. The dyed (labeled) and undyed (unlabeled) cells were sorted (10,000 each) into separate 12 × 75 mm Falcon polystyrene tubes that were assayed for 131I activity with an HpGe detector. Figure 2 shows that the integral area under the 364-keV (131I) photopeak was 3,145 and 20 counts for the radiolabeled and unlabeled cells, respectively. These data provide strong evidence that there is no significant migration of 131I radioactivity from radiolabeled cells to surrounding unlabeled cells under the experimental conditions used.

γ-Ray spectra show 364.5-keV photopeak of 131I measured with HpGe well detector. Top and bottom panels show 131I photopeaks corresponding to radioactivity in 10,000 labeled (2.4 mBq per cell) and 10,000 unlabeled cells, respectively, obtained from cell sorter. Counts were accumulated for 1,000 s. Integral counts under peaks after background subtraction were 3,145 and 20 for labeled and unlabeled cells, respectively. It can be seen clearly that unlabeled cell population contains only 0.6% as much 131I as labeled cell population. This suggests at least a 99.4% sorting purity. Furthermore, high precision of sorting and activity measurement ensured that there was no significant migration of radioactivity from labeled cells to unlabeled cells.
Uptake of 131IdU in V79 Cells
The cellular uptake of 131IdU is linearly dependent on the concentration of 131IdU in the culture medium (MEMB). A least-squares fit of the data to a linear function gives 0.222 ± 0.017 mBq per cell per kBq/mL. This linear dependence was also observed in previous studies with 131IdU and 125IdU (20,21).
Response of Multicellular Clusters to 131IdU
Figure 3 shows the surviving fraction of cells in the multicellular cluster as a function of the 131I activity in the cluster when 50% of the cells were radiolabeled. The sorting technology allowed independent seeding of the labeled and unlabeled cells for colony formation. Therefore, separate survival curves are provided for each population. The plating efficiency for the controls was about 55% and 25% for the sorted unlabeled and labeled cells, respectively, when seeded into Falcon 6-well polystyrene flat-bottom tissue culture dishes. As indicated in previous studies (16), the plating efficiency for controls cells that undergo manual seeding into culture dishes is typically 65%. Therefore, the plating efficiency for the sorted cells appears to be affected by both the sorting process itself and the CFDA-SE dye. This is compensated for by calculating survival fractions relative to controls for dyed and undyed cells taken from control clusters containing 50% dyed cells and no radioactivity. Figure 3 shows that there are marked differences in the slopes of the survival curves for the labeled and unlabeled cells.
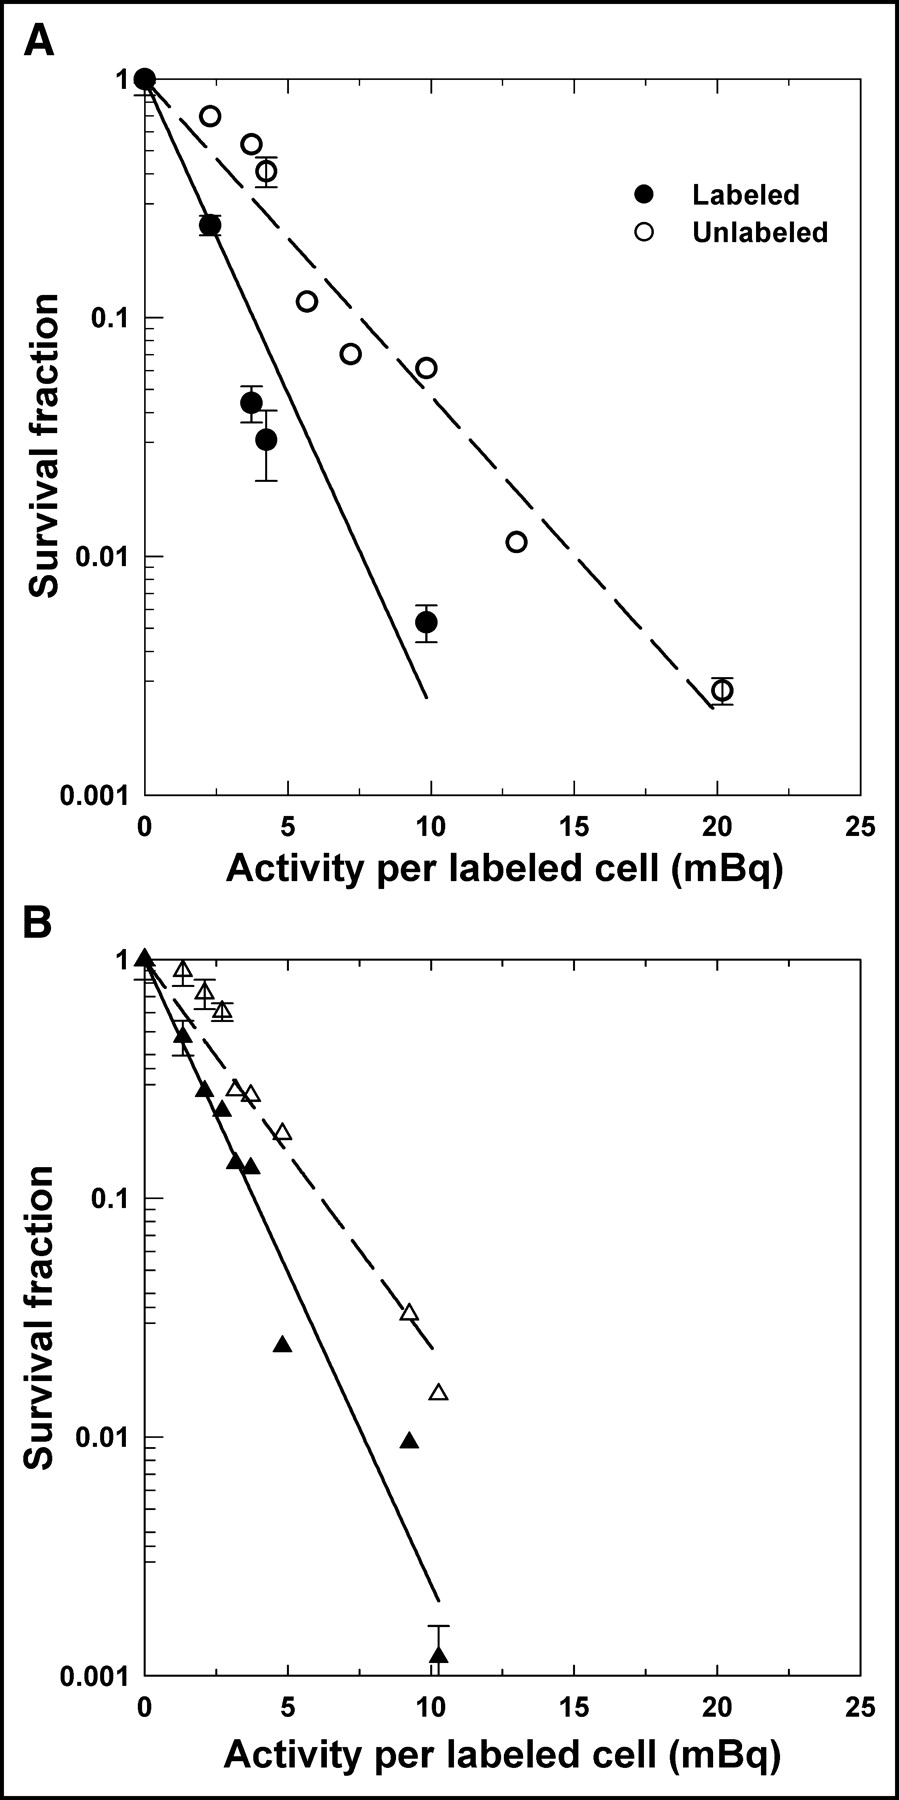
Survival of V79 cells in multicellular clusters as function of initial 131I activity per labeled cell. Multicellular cluster contained 50% cells labeled with 131IdU. Data are shown for 2 independent experiments (A and B) and separately for labeled (•, ▴) and unlabeled (○, ▵) cells. Survival fractions for labeled and unlabeled cells were determined compared with dyed and undyed cells, respectively, taken from control clusters (50% dyed with CFDA-SE and 50% undyed). SDs of mean survival based on triplicate samples are indicated by error bars. Least-squares fits of data to an exponential function are represented by solid (labeled) and dashed (unlabeled) lines, respectively. These fits are provided only to emphasize differences in dose–response between labeled and unlabeled cells.
Cellular Absorbed Doses
Self-Absorbed Dose to Labeled Cells (Self-Dose).
The mean absorbed dose to the labeled cells is delivered during 3 distinct periods of the experiment—namely, the 14-h incubation (I) period on the rocker-roller, where the radioactivity is taken up by the cells; the 72-h maintenance (M) period at 10.5°C; and, finally, the 1-wk colony-forming period (CF). Accordingly, it is necessary to determine the 131I cumulated activity in the cell during each of these periods. The temporal dependence of the cellular activity and the cumulated activity are shown in Figure 4. These data are used to calculate the mean self-absorbed dose to the cell nucleus of the labeled cells as DN = 0.32 Gy/mBq. Details of these calculations are given in the Appendix.

Representative temporal dependence of intracellular activity of 131IdU in labeled cells for case where 20 mBq per cell is taken up by V79 cells by end of uptake period. Area under the curve is proportional to cumulated decays in V79 cell nucleus. Time period of 0–14 h represents uptake of radiochemical into labeled cells. Time period of 14–86 h represents 72-h period where labeled cells were mixed in equal numbers with unlabeled cells and maintained at 10.5°C as a multicellular cluster. Finally, curved region corresponds to 1-wk colony-forming period where cellular activity has an effective half-time of ∼12 h (21). Inset shows corresponding cumulated activity as function of time during uptake (▪), cluster maintenance (▴), and colony formation (•) periods.
Cross Absorbed Dose to Labeled and Unlabeled Cells (Cross-Dose).
For the medium-energy β-emitter 131I, cross-irradiation plays a major role in the absorbed dose to the labeled and unlabeled cells. The β-particles have the capacity to cross-irradiate cells that reside as much as 30–40 cell diameters distant from the labeled cell during the cluster maintenance period of 72 h. The mean cross-dose to the cells is essentially the mean absorbed dose to the cluster. For 131I, the mean absorbed dose to the cluster was determined in our previous communication to be D = 0.66 Gy/kBq of cluster activity (16). For 50% labeling, this translates to a cross-dose of 1.3 Gy/mBq in the labeled cell.
Total Absorbed Dose.
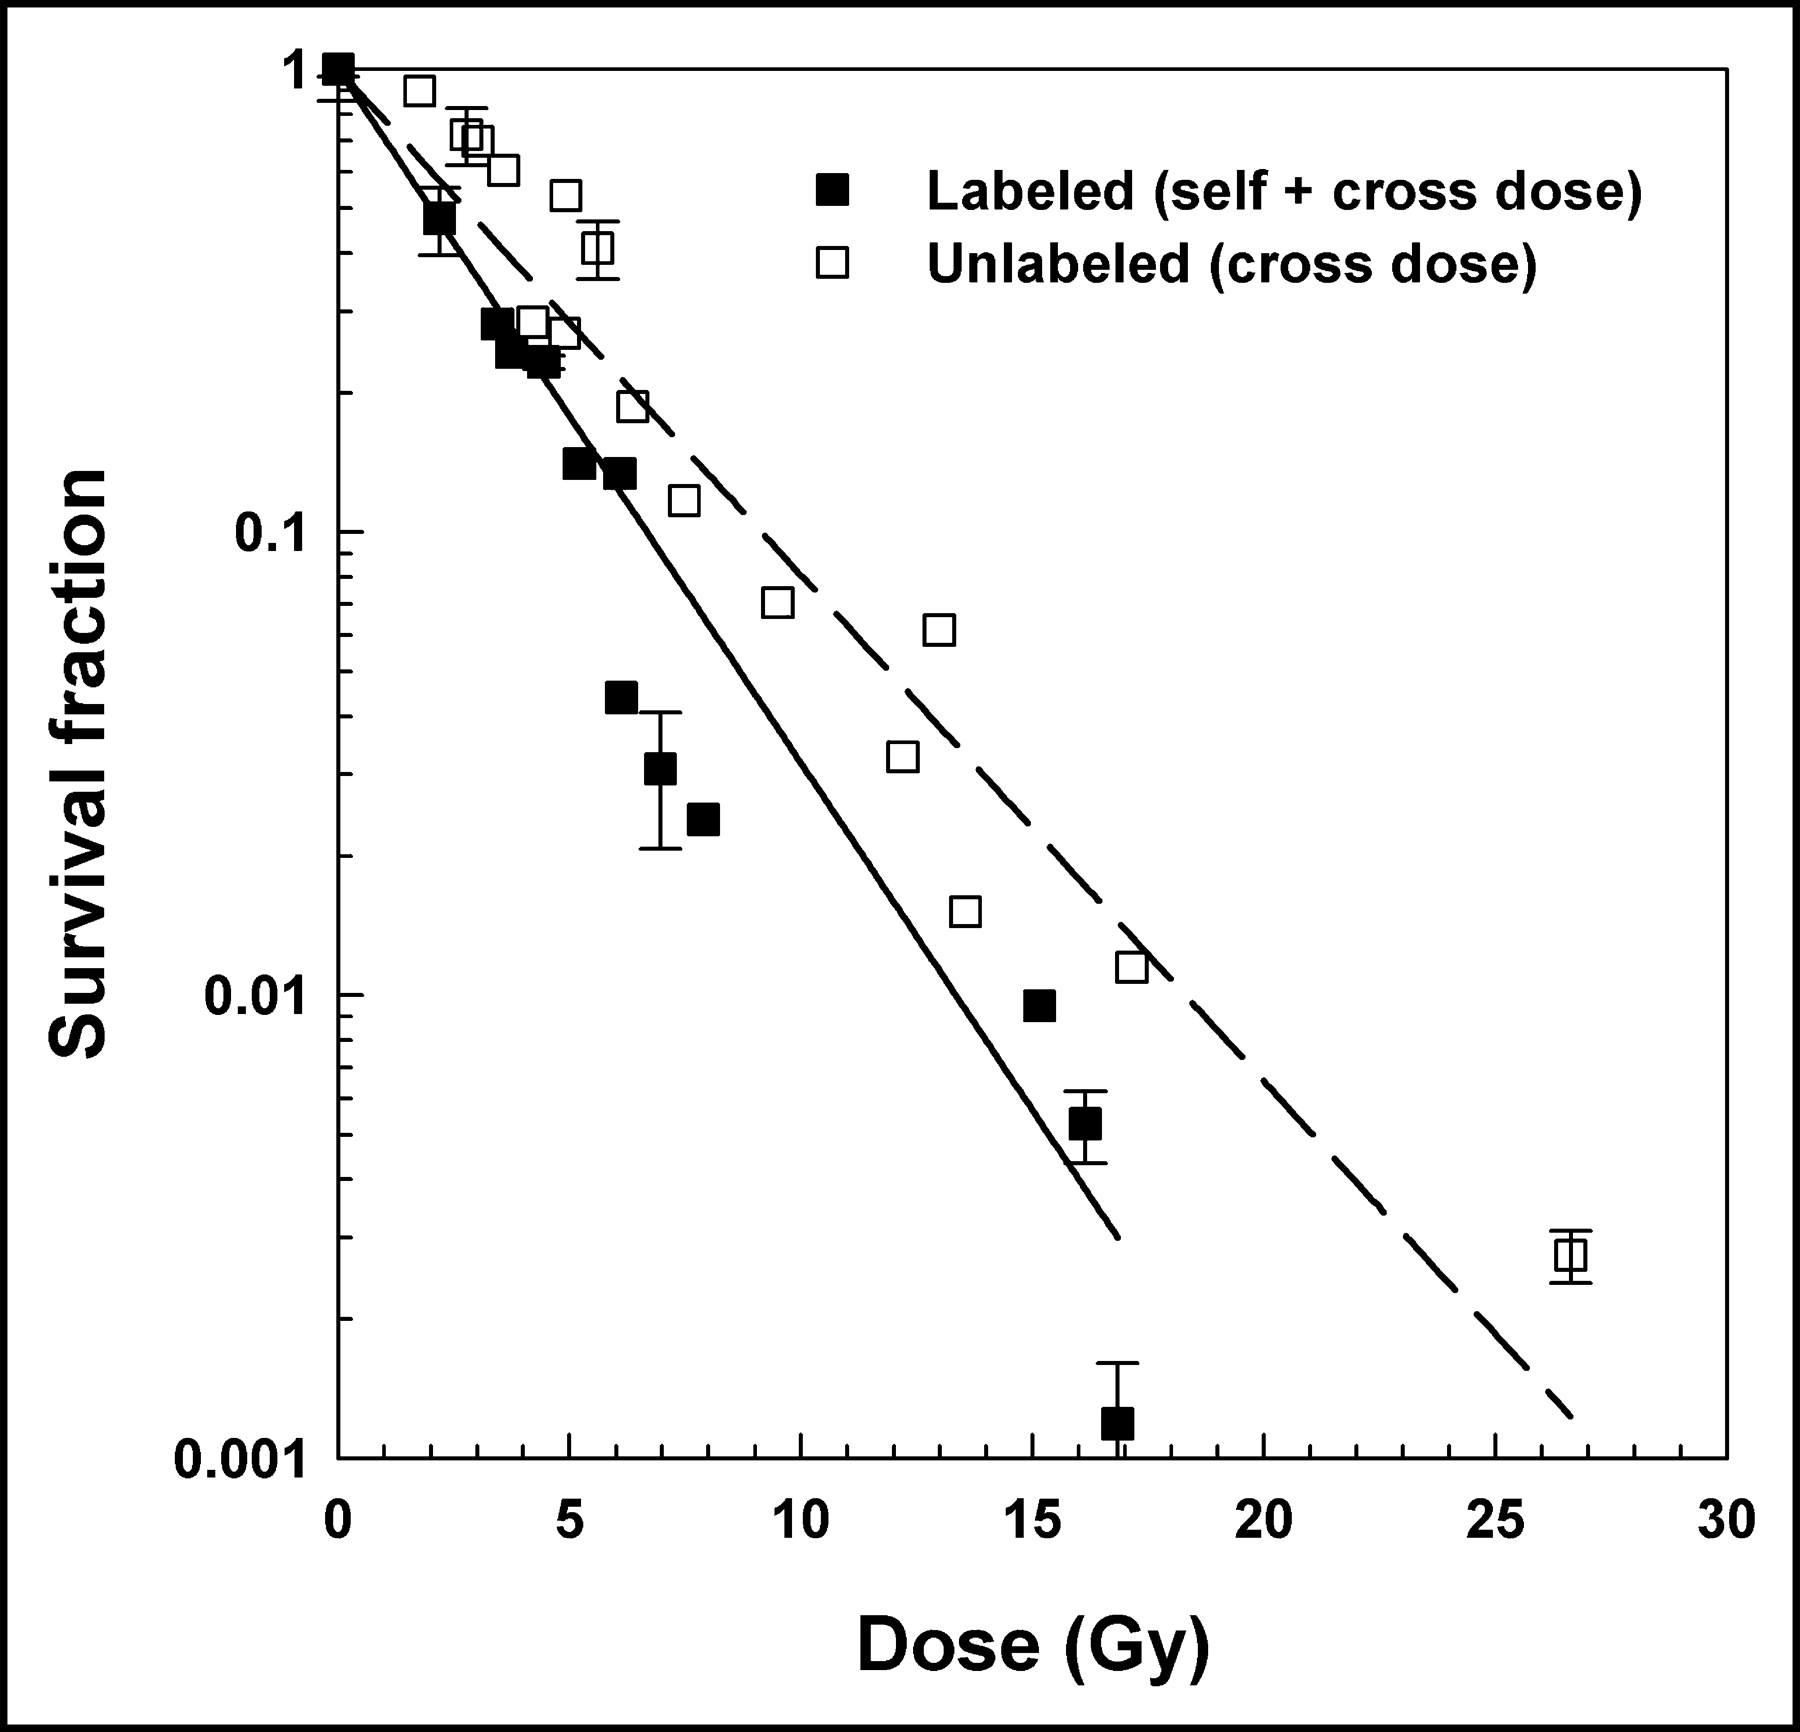
The mean total absorbed dose to the labeled cell has contributions from self-doses and cross-doses, whereas the unlabeled cell only has a contribution from cross-dose. For example, a cellular uptake of 20.2 mBq per cell, the highest activity used in this study, yields a self-dose of 6.5 Gy and a cross-dose of 26.6 Gy. Hence, the ratio of self-dose to cross-dose when 50% of the cells are labeled with 131IdU is 0.24. The labeled cells will therefore receive a total of 33.1 Gy, whereas the unlabeled cells will receive only a cross-dose equal to 26.6 Gy. It should be noted that the self-doses and cross-doses are not equally lethal per unit dose.
Dose–Response
The survival fraction versus the total absorbed dose to the labeled (self-dose + cross-dose) and unlabeled cells (cross-dose) is plotted in Figure 5. A least-squares fit of the labeled cell data to an exponential function yields a mean lethal dose D37 of 2.9 ± 0.3 Gy. Although there is apparently a small shoulder in the dose–response data for unlabeled cells (Fig. 5), an exponential fit has also been used to fit these data. The fit for the unlabeled cells is good (R2 = 0.94) with a D37 of 4.0 ± 0.3 Gy. These values are summarized in Table 1.
Mean Lethal Doses for V79 Cells in Clusters with 50% of Cells Labeled with 131IdU

Survival of V79 cells in multicellular clusters as function of absorbed dose to cell nucleus. Multicellular clusters were formed with equal numbers of cells labeled with 131IdU and unlabeled cells. Labeled cells (▪) received both self-doses and cross-doses, whereas unlabeled cells (□) received only cross-dose. Data shown are pooled from Figures 3A and 3B. SDs of mean survival based on triplicate samples are indicated by error bars. Least-squares fits of data to an exponential dose– response function are shown for labeled (solid line) and unlabeled (dashed line) cells. Corresponding D37 values are given in Table 1.
DISCUSSION
To assess the effects arising out of self-doses and cross-doses delivered by 131I, multicellular clusters were prepared by assembling clusters with equal numbers of unlabeled cells and cells radiolabeled with 131IdU. This radiochemical, a thymidine analog, is incorporated into the DNA in the cell nucleus. It was chosen for its capacity to remain within the cell nucleus without migrating to neighboring unlabeled cells (13). This was proven in the present study with high precision, as shown in Figure 2. In our previous communication, we showed results for clusters with mixtures of labeled and unlabeled cells, wherein 100%, 10%, or 1% of the cells were radiolabeled (16). However, after disrupting the cluster, the mixtures of cells were manually seeded into dishes for colony formation. This co-seeding of labeled and unlabeled cells made it impossible to separate the dose–response of the 2 populations. In the present study, use of cell sorting technology enabled the dose–response of the labeled and unlabeled cells to be studied separately.
The exponential nature of the dose–response curve in Figure 5 for the labeled cells is characteristic of high-LET (linear energy transfer) radiations such as α-particles (8,20), although the β-particles emitted by 131I are considered to be low-LET in nature. This same type of curve was observed in our previous study when 1%, 10%, and 100% of the cells were labeled with 131IdU and the mixture of labeled and unlabeled cells was seeded for colony formation (16). A similar dose–response relationship was also observed for 131IdU in V79 cells growing in suspension (22). As discussed previously (16), there are several possible explanations for the exponential nature of the dose–response to cells labeled with 131IdU—among them is that the damage imparted by 131IdU is somewhat like high-LET because the decays occur within the DNA (21,23). A least-squares fit of the labeled cell data to an exponential function yields a mean lethal dose D37 of 2.9 ± 0.3 Gy (includes self-doses and cross-dose).
The D37 for the unlabeled cells was 4.0 ± 0.3 Gy. One can compare this value to our recently published results for 1% labeling in the same multicellular clusters, where the labeled and unlabeled cells were co-plated without sorting and the survival fraction of the mixed population was determined (16). In that case, the survival fractions were largely dictated by cross-irradiation of unlabeled cells and a D37 of 6.4 ± 0.5 Gy was obtained. One would anticipate good agreement between the 1% labeling data and the D37 for unlabeled cells; however, the 2 values are considerably different. One possible reason is that the protocol for determining the dose–response of the unlabeled cells was significantly different than that for the 1% labeling case. Specifically, unlike the 1% case, the unlabeled cells were subjected to washes with PBS, treatment with the CFDA-SE dye, and ultimately passed through the cell sorter. These manipulations may have had some impact on the survival of the unlabeled cells. It is also possible that bystander effects, similar to those observed for 3H-thymidine (13,14) and 125IdU (15), may have played some role. This possibility is supported by the highly lethal nature of the cellular self-dose delivered by 131IdU. Regardless of the reason, the magnitude of the responses is generally similar.
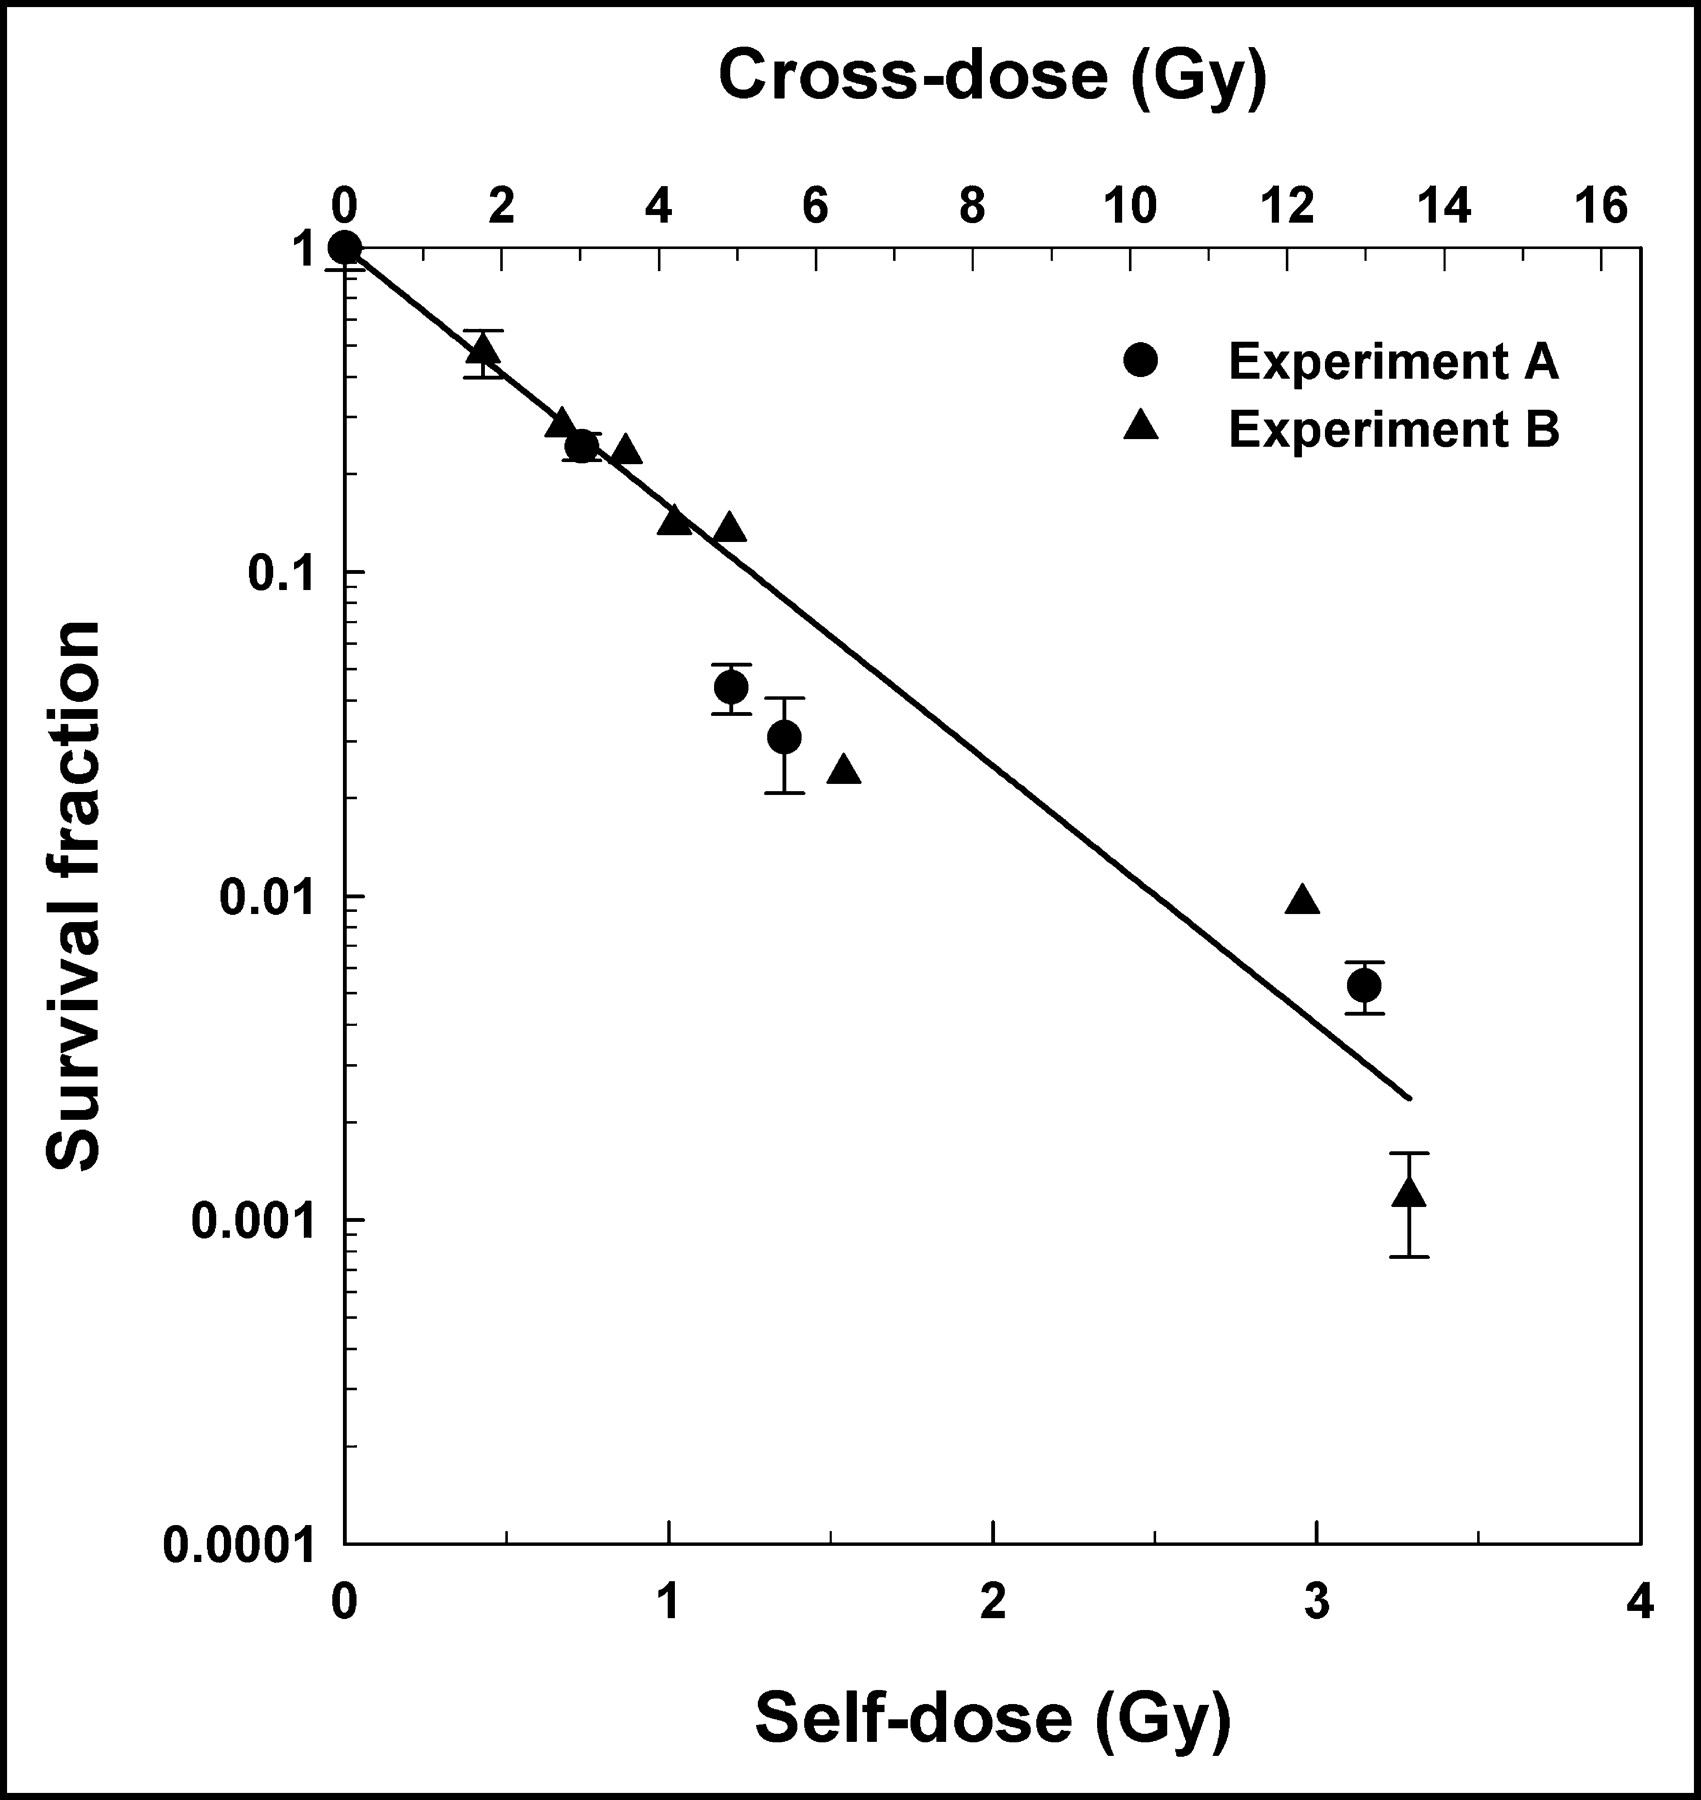
The data in Figure 5 can be further analyzed to explicitly examine the radiotoxicity of the self-dose delivered to the labeled cells. The killing of labeled cells is the result of radiation insults inflicted by both self-doses and cross-doses, whereas the killing of unlabeled cells is caused by cross-dose alone. Therefore, assuming that there is no synergism between the self-doses and cross-doses, and that bystander effects (13–15,24) do not play a substantial role in the lethality of 131I where the cross-dose plays a major role (>4 times the self-dose), the survival fraction arising from the self-dose alone can be determined by simply dividing the survival fractions for the labeled cells by the corresponding survival fractions for the unlabeled cells (Fig. 3). This ratio is plotted as a function of both activity per labeled cell (mBq per cell) and self-dose (Gy) in Figure 6. A least-squares fit of the data to an exponential function yielded a mean lethal cellular activity A37 = 3.7 ± 1.0 mBq per cell that corresponds to a mean lethal self-dose D37 = 1.2 ± 0.3 Gy. Interestingly, the A37 value is almost the same as the mean value of 3.6 mBq per cell for 3 experiments reported in an earlier communication that examined the radiotoxicity of 131I in similarly handled V79 cells, except that the cells were maintained at 10.5°C for 72 h as a suspension where no significant cross-dose was possible (22). This A37 value for suspension culture also gives a D37 of 1.2 Gy. Clearly, in the case of 131I-IdU, the self-dose is more effective than the cross-dose in killing the V79 cells. A comparison of the D37 values for the self-dose (1.2 Gy) with that for the cross-dose (4.0 Gy) indicates that the self-dose has an RBE of about 3.3 compared with that of the cross-dose. Furthermore, as discussed previously, the D37 for chronic 137Cs γ-rays is 12.2 ± 2.4 Gy (16). Therefore, in the present work, the 131I β-particles that deliver the cross-dose are about 3 times more lethal than chronic external γ-rays. The self-dose is about 10 times more lethal than the chronic γ-rays. These comparisons with γ-rays should be used with some caution given that the cells irradiated with γ-rays were not subjected to cell sorting as in the present studies with 131IdU.
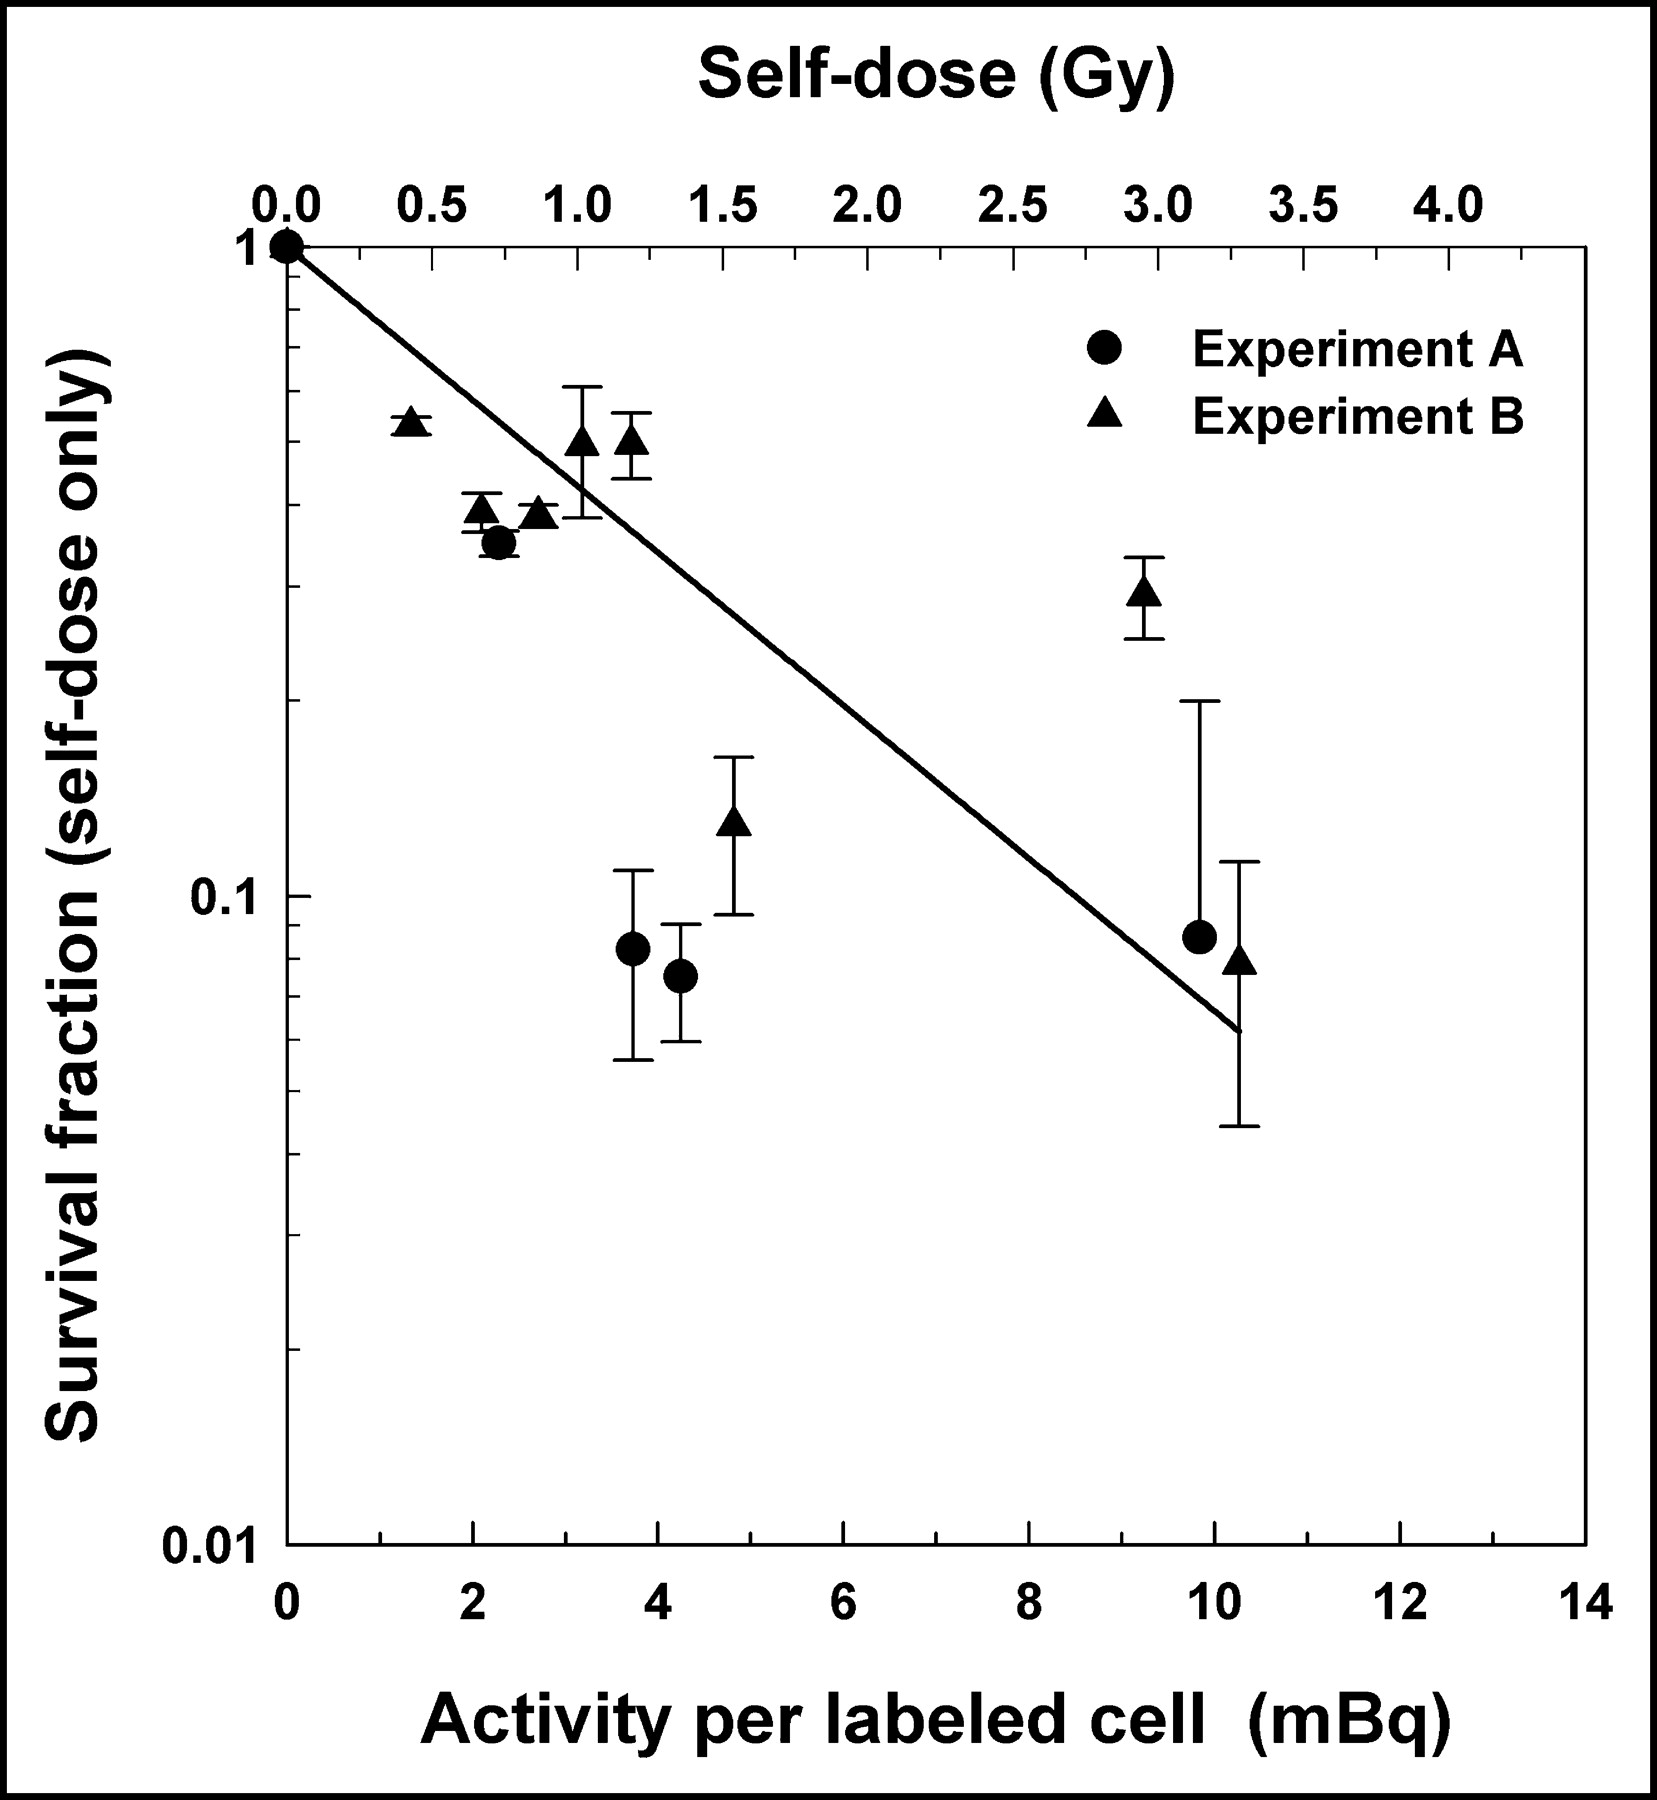
Response of labeled cells specifically to self-dose received from intracellular decays of 131I. This was determined by taking ratio of labeled cell survival fraction to unlabeled cell survival fraction. Ratio is plotted both as a function of activity per labeled cell (bottom axis) and self-dose to labeled cell nucleus (top axis). Data are derived from 2 independent experiments in Figures 3A and 3B (•, ▴). Error bars for ratios are derived from errors associated with survival fractions for labeled and unlabeled cells. Also shown is a least-squares fit of combined data from 2 experiments (solid line).
This analysis has essentially provided separate D37 values for the self-dose and cross-dose. These values reflect the differential radiotoxicity of the self-dose Dself deposited in the labeled cell and the cross-dose Dcross delivered to both the labeled and unlabeled cells. Based on the earlier discussion, the self-dose required to achieve 37% survival is D37,self = 1.2 ± 0.3 Gy and the cross-dose required to achieve 37% survival D37,cross = 4.0 ± 0.3 Gy. Again assuming that there is no synergy between the self-doses and cross-doses, the survival fraction of the labeled and unlabeled cells can be modeled as:
 Eq. 1
Eq. 1
 Eq. 2
Eq. 2
Recall that the unlabeled cells only receive a cross-dose so Equation 2 is essentially the fit to the unlabeled cell data in Figure 5. However, Figure 7 shows the survival fraction predicted by Equation 1 (represented by the solid line) overlaid on the experimental data for the labeled cells. The fit is remarkably good, suggesting that this theoretical approach to modeling the combined effects of self-doses and cross-doses works extremely well for this radiochemical and the biological endpoint of cell killing. The success of this modeling approach augers well for ultimately modeling the response of tissues containing nonuniform distributions of radioactivity with a multicellular dosimetry approach that takes into account both self-doses and cross-doses.

Modeling of response of labeled cells to combined effects of self-doses and cross-doses when 50% of cells are labeled with 131IdU. Self-dose is given by bottom axis, whereas cross-dose is given by top axis. Self-dose to cross-dose ratio is 0.24 for 50% labeling when 131I is in cell nucleus (131IdU). Experimental data for 2 independent experiments (A and B) are shown separately (•, ▴). Errors bars represent SDs of mean survival fraction based on triplicate samples. Solid line represents survival fraction predicted by model SFlabeled = e−Dself/D37,selfe−Dcross /D37,cross, where D37,self and D37,cross are 1.2 and 4.0 Gy, respectively.
CONCLUSION
This work describes a novel methodology to assess the biological consequences of nonuniform distributions of radioactivity at the multicellular level. Cell sorting technology is used to delineate the biological effects of DNA-incorporated 131I on both labeled and unlabeled cells in a multicellular cluster. The results clearly demonstrate that the labeled cells experience a higher degree of cytotoxicity than the unlabeled cells. Furthermore, it is clear that the RBE corresponding to the self-dose delivered by DNA-incorporated 131I to the labeled cells is substantially higher than the RBE of the cross-dose arising from 131I decays in the surrounding cells. Modeling the response of labeled cells to the self-doses and cross-doses clearly demonstrates the importance of assessing the self-doses and cross-doses when predicting the biological response to nonuniform distributions of 131I.
APPENDIX: SELF-ABSORBED DOSE TO LABELED CELLS
The mean absorbed dose to the labeled cells is delivered during the 14-h incubation (I) on the rocker-roller where the radioactivity is taken up by the cells, the 72-h maintenance (M) at 10.5°C, and, finally, during the 1-wk colony-forming period (CF). The cumulated activity and absorbed dose during each of these periods is determined below.
Iododeoxyuridine is taken up by the cell linearly in time (8). If decay during this period is ignored (decay of 131I during uptake period contributes only about 0.5% to total cumulated activity) and there is no biological elimination of the radioactivity, the cellular activity at time t of the incubation period is given by:
 Eq. A1
where k is a constant of proportionality given by A0/tI, A0 is the cellular uptake at the end of the uptake period, and tI is the incubation time during which the radioactivity is taken up by the cells (tI = 14 h). The cumulated activity à is simply the integral of A(t):
Eq. A1
where k is a constant of proportionality given by A0/tI, A0 is the cellular uptake at the end of the uptake period, and tI is the incubation time during which the radioactivity is taken up by the cells (tI = 14 h). The cumulated activity à is simply the integral of A(t):
 Eq. A2
Therefore, the cellular cumulated activity during the uptake period ÃI is given by (8):
Eq. A2
Therefore, the cellular cumulated activity during the uptake period ÃI is given by (8):
 Eq. A3
The period of 12–84 h represents the 72-h period in which the cells were maintained at 10.5°C in the cluster configuration where labeled and unlabeled cells were mixed together. If it is assumed that during the cluster maintenance period (tM) of 72 h there is no biological elimination of the radioactivity from the cells and only physical decay of the radioactivity, the cellular activity (AM) as a function of time t of the maintenance period is then given by:
 Eq. A4
where Tp is the physical half-life = 8.04 d for 131I (17). Integrating Equation A4 according to the prescription in Equation A2, the cumulated activity (ÃM) during this maintenance period (tM) is then given by (25):
Eq. A4
where Tp is the physical half-life = 8.04 d for 131I (17). Integrating Equation A4 according to the prescription in Equation A2, the cumulated activity (ÃM) during this maintenance period (tM) is then given by (25):
 Eq. A5
Equations A4 and A5 are represented graphically in Figure 4 as the cellular activity and cumulated activity during the cluster maintenance period at 10.5°C.
Eq. A5
Equations A4 and A5 are represented graphically in Figure 4 as the cellular activity and cumulated activity during the cluster maintenance period at 10.5°C.
Finally, the curved region in Figure 4 corresponds to the colony-forming period of 7 d at 37°C. During this period, the activity per cell decreases through cell division and physical decay (26). The cellular activity at time t during the colony-forming period is given by:
 Eq. A6
The quantity Te is the effective clearance half-time where Te = Tb Tp/(Tb + Tp), and Tb is the biological clearance half-time. The biological half-time is estimated to be 12 h, the value obtained for 125IdU and 125I-iododeoxycytidine (8). Integrating Equation A6 gives the cumulated activity (ÃCF) during the colony-forming period (tCF):
Eq. A6
The quantity Te is the effective clearance half-time where Te = Tb Tp/(Tb + Tp), and Tb is the biological clearance half-time. The biological half-time is estimated to be 12 h, the value obtained for 125IdU and 125I-iododeoxycytidine (8). Integrating Equation A6 gives the cumulated activity (ÃCF) during the colony-forming period (tCF):

 Eq. A7
The total cumulated activity (Ã) during the 3 periods is simply given by:
Eq. A7
The total cumulated activity (Ã) during the 3 periods is simply given by:
 Eq. A8
Hence, from Equations A3, A5, and A7, one obtains the total cumulated activity as:
Eq. A8
Hence, from Equations A3, A5, and A7, one obtains the total cumulated activity as:
 Eq. A9
Following the general formalism for cellular dosimetry given by equation A7 of (6), the mean self-absorbed dose to the cell nucleus DN is given by:
 Eq. A10
where S(N ← N) is the absorbed dose to the cell nucleus per unit cumulated activity in the cell nucleus. The radius of the cell nucleus of V79 cells is 4 μm (8). Therefore, from the tables in (6), the value of S(N ← N) for V79 cells is 0.00107 Gy Bq−1 s−1. Substituting Equation A9 into Equation A10 and substitution of the various parameters yield a mean self-absorbed dose to the cell nucleus of the labeled cells as DN = 0.32 Gy/mBq.
Eq. A10
where S(N ← N) is the absorbed dose to the cell nucleus per unit cumulated activity in the cell nucleus. The radius of the cell nucleus of V79 cells is 4 μm (8). Therefore, from the tables in (6), the value of S(N ← N) for V79 cells is 0.00107 Gy Bq−1 s−1. Substituting Equation A9 into Equation A10 and substitution of the various parameters yield a mean self-absorbed dose to the cell nucleus of the labeled cells as DN = 0.32 Gy/mBq.
Acknowledgments
The authors thank Tammy Mui for her assistance and for operating the FACS Vantage cell sorter used to perform these experiments. We are extremely grateful to Dr. Edouard I. Azzam for many stimulating discussions during the course of this work. We also thank Drs. Sonia M. de Toledo, Bogdan I. Gerashchenko, Venkatachalam Perumal, and Massimo Pinto for their excellent cooperation in our laboratory. This work was supported in part by U.S. Public Health Service (USPHS) grant R01CA83838. Finally, the authors greatly appreciate the support provided by Thomas Denny and Dana Stein at the core flow cytometry facility that is supported in part by USPHS shared instrumentation grant 1 S10 RR14753-01.
Footnotes
Received Nov. 5, 2003; revision accepted Jan. 13, 2003.
For correspondence contact: Roger W. Howell, PhD, Department of Radiology, MSB F-451, New Jersey Medical School, University of Medicine and Dentistry of New Jersey, 185 S. Orange Ave., Newark, NJ 07103.
E-mail: rhowell{at}umdnj.edu
REFERENCES
In this issue


Jump to section
Related Articles
Cited By...
- Membrane and Nuclear Absorbed Doses from 177Lu and 161Tb in Tumor Clusters: Effect of Cellular Heterogeneity and Potential Benefit of Dual Targeting--A Monte Carlo Study
- Membrane and Nuclear Absorbed Doses from 177Lu and 161Tb in Tumor Clusters: Effect of Cellular Heterogeneity and Potential Benefit of Dual Targeting--A Monte Carlo Study
- MIRD Pamphlet No. 27: MIRDcell V3, a Revised Software Tool for Multicellular Dosimetry and Bioeffect Modeling
- MIRD Pamphlet No. 25: MIRDcell V2.0 Software Tool for Dosimetric Analysis of Biologic Response of Multicellular Populations
- Cell-Level Dosimetry and Biologic Response Modeling of Heterogeneously Distributed Radionuclides: A Step Forward
- Lognormal Distribution of Cellular Uptake of Radioactivity: Monte Carlo Simulation of Irradiation and Cell Killing in 3-Dimensional Populations in Carbon Scaffolds
- Lognormal Distribution of Cellular Uptake of Radiopharmaceuticals: Implications for Biologic Response in Cancer Treatment
- Changes in Lognormal Shape Parameter Guide Design of Patient-Specific Radiochemotherapy Cocktails
- Reply: 131I Radiation Dose Distribution in Metastases of Thyroid Carcinoma
- CELLDOSE: A Monte Carlo Code to Assess Electron Dose Distribution S Values for 131I in Spheres of Various Sizes
- Log Normal Distribution of Cellular Uptake of Radioactivity: Implications for Biologic Responses to Radiopharmaceuticals