


Abstract
Uptake of radiopharmaceuticals and chemotherapeutic drugs is nonuniform at the microscopic level. Their distributions are typically lognormal, suggesting that failure in chemotherapy and targeted radionuclide therapy may be attributable, in part, to the characteristics of this biologically ubiquitous distribution. The lognormal problem can be overcome by using cocktails of 2 or more agents, tailored such that at least 1 agent is strongly incorporated by every cell in the target population. Therefore, critical assessment of the tissue uptake of each cocktail component is warranted. Methods: Cellular incorporation of the α-particle–emitting radiochemical (210Po-citrate) and 2 anticancer drugs (daunomycin and doxorubicin) was determined using flow cytometry. The role of their lognormal distribution in clonogenic cell survival was evaluated. Results: The shape parameter of the lognormal distribution was found to be correlated to both intracellular agent concentration and cell survival. Although no difference emerged between the shape parameters for citrate within the first 2 logs of cell kill, those for daunomycin and doxorubicin changed significantly. Conclusion: Changes in the value of the lognormal shape parameter and slope of the cellular drug uptake curves can be used to rapidly screen radiopharmaceuticals and other cytotoxic agents to formulate more effective cocktails for cancer therapy.
The use of chemotherapeutic drugs as an adjuvant to external-beam radiotherapy, surgery, or other treatment modalities is common practice for the treatment of a wide variety of solid tumors. This approach has demonstrated some success in the management of certain cancers (1,2). The rationale for combining chemotherapeutic agents with external-beam radiotherapy is to radiosensitize the irradiated tumor tissue and to target subpopulations of malignant cells that have metastasized from the primary lesion demarcated for beam therapy. Although the tradition of chemoradiotherapy has been practiced for decades and shows promise, some attempts have not succeeded in demonstrating either an added therapeutic benefit (3) or a reduction of normal-tissue toxicity (4). In another approach, radiolabeled chemotherapy agents have been used in an attempt to enhance cytotoxicity in both human cancer cells and apparently normal hamster fibroblasts (5). Chemotherapy has also been combined with radioimmunotherapy (6).
One limitation of chemoradiotherapy is the frequent lack of interaction between chemotherapeutics and ionizing radiation. This lack often leads to escalation of radiation and drug doses, which in turn results in elevated normal-tissue toxicity. Moreover, lack of specificity of chemotherapy drugs for tumor tissue can result in an insignificant difference in toxicity toward malignant and normal tissues, thereby providing no added therapeutic benefit compared with surgery and radiation alone. Despite these limitations, chemoradiotherapy often provides considerable benefit. However, observed inconsistencies in treatment outcomes may be due to the widely varying chemotherapeutic drug concentrations and radiation-absorbed doses used (7–10). In addition, there is evidence that optimization of radiation dose and drug concentration, and the time sequence for administering drugs and radiation, play important roles in treatment responses both in vitro and in vivo (4,11–13). Also, regardless of the quality of radiation used, the wide variability in drug toxicity in normal cells of different histologies has to be considered, with favor given to the most sensitive tissue in chemoradiotherapy (14).
Unfavorable outcomes in therapies involving the use of chemotherapy drugs and radiopharmaceuticals have been attributed to insufficient tumor specificity, poor tumor vascularization (15,16), and nonuniformities in agent distribution at the macroscopic, cellular, and subcellular levels (17,18). Determination of drug and radionuclide incorporation at the single-cell level is difficult. As such, estimation of intracellular chemotherapy drug concentration and intracellular radioactivity (required to determine radiation-absorbed dose to the cell) has largely been restricted to the macroscopic level. Accordingly, it has been difficult to establish a relationship between therapeutic agent incorporation and biologic response. Interestingly, even in situations with optimum perfusion and no diffusion barriers, cellular incorporation of radionuclides and chemotherapeutic drugs is not only nonuniform but also lognormal (19–25). This strongly suggests that the limited success in chemoradiotherapy of primary solid tumors and metastatic disease is likely due to this lognormal phenomenon, in which minute subpopulations of cells may take up little or no therapeutic agent. Repopulation by these subpopulations could mask a possible treatment benefit and result in an even more resistant neoplastic form. To enhance tumor response, there is the need to address the lognormal distribution of chemotherapy drugs and radiopharmaceuticals. Using a quantitative immunofluorescence-based approach, it has recently been demonstrated in a 3-dimensional culture system that concomitant measurement of radiopharmaceutical uptake and biologic response in individual cells within a population can be used to predict the response of subpopulations of cells and ultimately of the population (26). Although the idea of relating distribution profiles of therapeutic agents within cell populations to their cytotoxicity is not new (23,24,27), the ability to predict the fate of individual cells on the basis of agent incorporation has been lacking. Such capabilities should have significant implications in the design of more effective cocktails for clinical applications.
The experimental studies undertaken in the present work sought to learn more about how lognormal distributions of targeted therapeutics affect killing of a cell population. Accordingly, cellular incorporation of 210Po-citrate and 2 chemotherapeutic drugs (daunomycin and doxorubicin) was quantified by flow cytometry in cultured Chinese hamster V79 cells. 210Po was selected as a surrogate for α-emitting radionuclides used in radioimmunotherapy. The role of cellular incorporation of the cytotoxic agents in biologic response was evaluated. The implications of agent distribution within cell populations in informed cocktail design for effective tumor targeting are further discussed.
MATERIALS AND METHODS
Cell Line and Monolayer Culture
Chinese hamster V79 lung fibroblasts were used. Two different formulations of minimum essential medium (MEM) were used (MEMA and MEMB), and they have been previously described in detail (28). All media and supplements were obtained from Gibco, including fetal calf serum (catalog no. 10437, lot 539574). For routine maintenance, cells were grown as monolayers in Falcon 25-cm2 tissue culture flasks (BD, catalog no. 353082) at 37°C and 5% CO2 and 95% air and were subcultured twice weekly. For experiments, V79 cells (passages 4–11) were transferred into Falcon 225-cm2 flasks (BD, catalog no. 353138) and were used on reaching 80%–90% confluence.
Suspension Cell Culture
Cells grown in 225-cm2 flasks were trypsinized (0.25% trypsin, Gibco, catalog no. 25200-056), and MEMB was added to obtain 2 × 10⁶ cells/mL. Aliquots of 1 mL were placed in Falcon 17 × 100 mm polypropylene tubes (BD, catalog no. 352018) and placed on a rocker-roller (Thermo Fisher) for 3 h at 37°C with 5% CO2 and 95% air. After this conditioning period, cells were treated with drug or radiochemical. Cell cultures were exposed to radiochemical and drugs for 0.5 and 2.5 h, respectively.
Cellular Incorporation of 210Po-Citrate, Daunomycin, and Doxorubicin
210Po-Citrate.
The uptake of 210Po-citrate was determined on a cell-by-cell basis by flow cytometric techniques, using 210Po-free citrate. Briefly, V79 cells (2 × 10⁶ cells/mL) were treated with 0–3 mM citrate and incubated on a rocker-roller as described earlier. Cellular uptake of citrate was tracked using a europium tetracycline conjugate (29–31). Samples were washed twice with 10 mM 3-morpholino-propanesulfonic acid (MOPS) buffer (Sigma, catalog no. M3183), after a 30-min exposure to citrate. The cells were resuspended in 1 mL of MOPS buffer containing europium tetracycline (Sigma, catalog nos. 203254 for europium and T7660 for tetracycline), transferred into 7-mL polystyrene flow cytometry tubes (BD, catalog no. 352054), and incubated at room temperature (∼22°C) in the dark for 30 min. The final concentration of europium tetracycline was 100 μM. Europium tetracycline forms a ternary complex with citrate (europium tetracycline–citrate), which is excitable at 488 nm, and its emission can be captured within the wavelengths transmitted by the 610/20 filter. After being washed twice with MOPS buffer, the samples were resuspended in 1 mL of MOPS buffer, passed 5 times through a 21-gauge needle, and analyzed by flow cytometry using an LSR II flow cytometer (BD) equipped with a 488-nm laser. Cellular incorporation of citrate, expressed in terms of the fluorescence intensity per cell or mean fluorescence intensity (MFI) of europium tetracycline–citrate, was used as a surrogate measure of cellular uptake of 210Po-citrate.
Daunomycin and Doxorubicin.
To determine the cellular uptake of daunomycin and doxorubicin, the cells were treated with each drug (0–10 μM) in MEMB and incubated on a rocker-roller for 2.5 h. The cells were washed twice with phosphate-buffered saline, resuspended in 1 mL of phosphate-buffered saline, passed 5 times through a needle, and immediately subjected to flow cytometric analysis. The 488-nm laser was used to excite intracellular daunomycin and doxorubicin, and the emission spectra were captured within the wavelengths transmitted by the 575/26 and 530/30 filters, respectively. Cellular incorporation of drugs was also expressed as MFI.
Toxicity of 210Po-Citrate
210PoCl4 in 2 M HCl was obtained at 370 MBq/mL from Eckert and Ziegler Isotope Products (catalog no. 6310). 210Po-citrate was prepared as previously described (20). Briefly, PoCl4 solution was mixed with 1 M sodium citrate in the ratio of 1:7 (final pH, 5.8) and was diluted with MEMB to a volume of 4 mL (final pH, 6.9). One milliliter of MEMB containing 210Po-citrate was added to the 1 mL of conditioned V79 cultures (2 × 10⁶ cells/mL), to arrive at a concentration of 0–250 kBq/mL (pH 6.9–7.0). After being incubated for 30 min, the cells were washed twice with MEMB, resuspended in 2 mL of MEMB, and incubated on a rocker-roller for 2.5 h to simulate concomitant drug exposure. The cells were resuspended in 5 mL of MEMB, passed 5 times through a needle, and counted with a Beckman Coulter model Z2 counter. Aliquots (500 μL) of the cell suspension were transferred to vials, mixed with 5 mL of Ecolume (MP Biomedical, catalog no. 882470), and counted with a Beckman Coulter LS6500 counter, and the mean activity per cell was determined (efficiency, 50% (20)). Aliquots of about 5 × 10⁵ cells were counted in triplicate for 210Po activity, and the cpm ranged from 103 to 105. The triplicate measurements kept statistical variations to a minimum. Each sample was serially diluted and plated in Falcon 60 × 15 mm tissue culture dishes for colony formation. Cultures were incubated for 7 d, and the colonies were fixed in 95% ethanol, stained with 0.01% amido black, washed in tap water, air-dried, and counted.
Biologic Clearance of 210Po
To determine the biologic clearance of 210Po from the cells, 4 × 10⁶ cells/mL were treated with 210Po-citrate as already described. After 2 washes with MEMB, the cells were resuspended in 5 mL of MEMB, passed 5 times through a needle, and Coulter-counted. Aliquots of 500 μL of cells were transferred to vials and mixed with Ecolume. The remaining cell suspension was plated into 25-cm2 flasks (1.0, 0.5, 0.5, 0.2, and 0.2 × 10⁶ cells per flask). The cultures were harvested after 24, 48, 72, and 96 h, respectively. Each sample was processed for cell counting and liquid scintillation counting as described. All vials were counted after the last harvest. The ratio of cellular activity at each time point to that immediately after treatment was calculated and plotted.
Toxicity of Daunomycin and Doxorubicin
After conditioning, the cell cultures were treated with daunomycin (Sigma, catalog no. D8809) or doxorubicin (Sigma, catalog no. 44583) to a final concentration of 0–10 μM in MEMB. The tubes were returned to the rocker-roller for 2.5 h. The cells were then processed for colony formation as already described.
RESULTS
Cellular Uptake of 210Po-Citrate, Daunomycin, and Doxorubicin
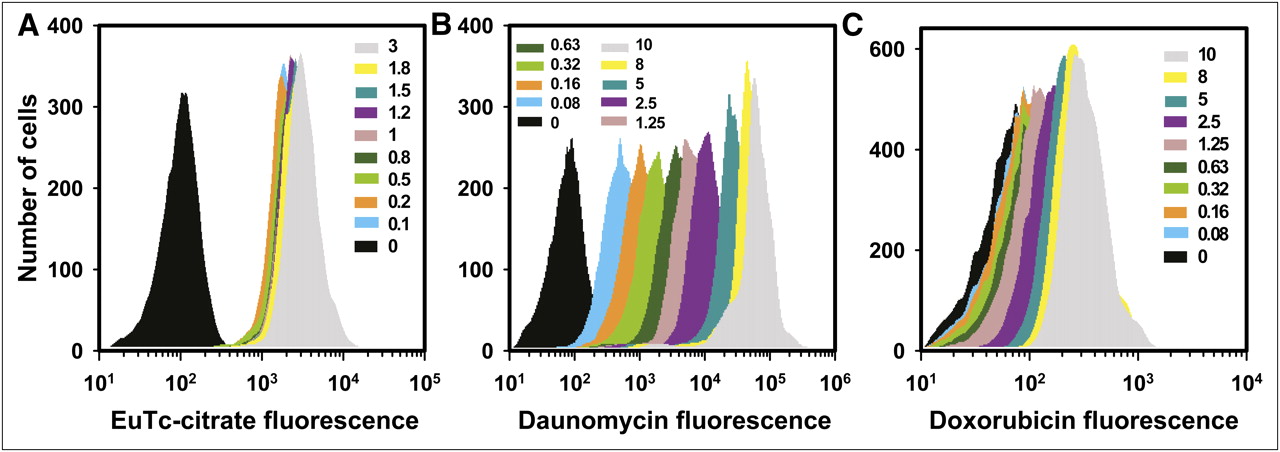
Figure 1 shows flow cytometry histograms of the fluorescence intensity of V79 cells that were treated with citrate (Fig. 1A), daunomycin (Fig. 1B), or doxorubicin (Fig. 1C) at concentrations of 0–3 mM, 0–10 μM, and 0–10 μM, respectively. The peaks shift toward higher mean fluorescence as the extracellular concentration of the drug increases. The relatively symmetric nature of the histograms as plotted on a linear-log scale is suggestive of a lognormal distribution of each agent among the cell population. This suggestion is consistent with the lognormal distribution observed in our earlier communication regarding 210Po-citrate (20,21). In the present study, fluorescence intensity distribution is a lognormal function of the fluorescence intensity I,

Distribution of cellular uptake of citrate, daunomycin, and doxorubicin by V79 cells in suspension culture. Shown are representative flow cytometry–generated histograms of cellular fluorescence intensity after treatment with 0–3 mM citrate (A), 0–10 μM daunomycin (B), or 0–10 μM doxorubicin (C). Citrate uptake was measured with europium tetracycline (EuTc).

Least-squares fits (black lines) of flow cytometry fluorescence intensity histograms to lognormal probability distribution. Histograms correspond to europium tetracycline–citrate (red circles, 0.2 mM; turquoise circles, 1.0 mM; purple circles, 2.0 mM; green circles, 3.0 mM) (A), daunomycin (red circles, 0.63 μM; turquoise circles, 2.5 μM; purple circles, 5.0 μM; green circles, 10 μM) (B), and doxorubicin (red circles, 0.63 μM; turquoise circles, 1.25 μM; purple circles, 2.5 μM; green circles, 5.0 μM) (C).
Figure 1A shows that treatment with 0.1 mM citrate resulted in a large increase in MFI from approximately 163 in untreated samples to approximately 2,000. This increase can be attributed to the high sensitivity of europium tetracycline for detecting citrate. Europium tetracycline is capable of detecting citrate in solution at concentrations approximately 1,000-fold lower than 0.1 mM (30). Because 0.1 mM corresponded to an intracellular 210Po activity of approximately 0.02 mBq/cell, which translates to no significant cell kill, background fluorescence of 2,000 units was subtracted from the MFI of each sample to obtain a net MFI. The net MFI was then plotted as a function of extracellular citrate concentration (Fig. 3A). With knowledge of the linear correlation between MFI and extracellular citrate concentration, and knowledge of the linear correlation between cellular uptake of 210Po and extracellular 210Po-citrate concentration (22), a similar correlation could be established between MFI and intracellular 210Po activity (Fig. 3A). A strong correlation emerged between cellular incorporation of the vehicle citrate and intracellular 210Po-activity.

(A) Net MFI of europium tetracycline–citrate complex as function of extracellular citrate concentration (•, solid line) and corresponding mean 210Po activity per cell (•, dashed line). Lines represent least-squares fits of data to linear functions: MFI = 267 ± 16 mM−1 × Ccit, and MFI = 1,058 ± 19 (mBq/cell)−1 × < a0 >, where Ccit and < a0 > are extracellular citrate concentration and mean cellular activity of 210Po, respectively. (B) Net MFI of intracellular daunomycin after exposure to low extracellular concentrations (▪, dashed line) and high concentrations (□, solid line). Linear least-squares fits to data give MFIdauno (Cdauno < 0.6 μM) = 5,922 μM−1 × Cdauno and MFIdauno (Cdauno > 0.6 μM) = 2,480 μM−1 × Cdauno + 1,161. (C) Net MFI of intracellular doxorubicin after exposure to low extracellular concentrations (▴, dashed line) and high concentrations (△, solid line). Linear least-squares fits to data give MFIdoxo (Cdoxo < 1 μM) = 61 μM−1 × Cdoxo and MFIdoxo (Cdoxo > 1 μM) = 40 μM−1 × Cdoxo + 29. For all cases, error bars represent SE of 3 independent experiments.
Similarly, cellular drug uptake was measured after treatment of cells with daunomycin and doxorubicin and is presented in Figures 3B and 3C, respectively. For both drugs, the MFI for the untreated controls was subtracted as background from the MFI of each sample, and the net MFI was plotted against extracellular drug concentration. In each case, net MFI was linearly correlated with drug concentration.
Cellular Dosimetry
The absorbed dose to the cell nucleus was determined as previously described (22). Because cells were treated with 210Po-citrate as a single-cell suspension and were subsequently seeded for colony formation, the small contribution of cross-irradiation from neighboring cells in the colony can be ignored because it is essentially counterbalanced by the reduction in self-dose caused by flattening of cells during the colony-forming period (32). The data in Supplemental Figure 2 were least-squares-fitted to obtain a mean biologic half-time of 11.6 h. Considering the physical half-life of 138 d for 210Po, this yields an effective half-time of 11.6 h. This time, the maintenance period of 2.5 h, the subcellular distribution of 210Po-citrate (28% nucleus, 72% cytoplasm) for V79 cells (32), and the published S values (33) were used to calculate a mean absorbed dose to the cell nucleus of 5.8 Gy/mBq of 210Po incorporated into the cell.
Toxicity of 210Po-Citrate, Daunomycin, and Doxorubicin
To evaluate 210Po cytotoxicity, we plotted the surviving fraction as a function of europium tetracycline–citrate net MFI, mean cellular uptake of 210Po, and mean absorbed dose to the nucleus (Fig. 4A). The data indicate that net MFI of the vehicle (citrate) is a good predictor of 210Po toxicity within the range of cellular activities used. The relationships between cell survival and europium tetracycline–citrate net MFI or cellular 210Po activity can be described by an exponential function: surviving fraction = exp(−A/A1). The relationship between surviving fraction (SF) and drug net MFI (or extracellular concentration) for daunomycin and doxorubicin are illustrated in Figures 4B and 4C, respectively. For both drugs, clonogenic survival and cellular drug uptake (as determined by net MFI) are related via a 2-component exponential function: SF = bexp(−A/A1) + (1 − b)exp(−A/A2). A is the intracellular activity of 210Po-citrate, absorbed dose to the cell nucleus, or drug concentration. Least-squares fits of the survival data to this function were performed as described previously (22), and the fitted parameters b, A1, and A2 are given in Table 1.

Surviving fraction of V79 cells after treatment with various agents. (A) 210Po-citrate for 3 independent experiments (represented by data points of 3 different colors), surviving fraction plotted against absorbed dose to cell nucleus, intracellular 210Po activity, and net MFI of europium tetracycline–citrate complex. Curve represents least-squares fit of data to single-component exponential function. (B) Daunomycin, with surviving fraction plotted against extracellular drug concentration and against net MFI of drug. (C) Doxorubicin, with surviving fraction plotted against extracellular drug concentration and against net MFI of drug. Curves for daunomycin and doxorubicin represent least-squares fits to 2-component exponential function. For 210Po-citrate, horizontal and vertical error bars represent SE of mean cellular activity and surviving fraction of triplicate measurements, respectively. For daunomycin and doxorubicin, horizontal and vertical error bars represent SE of net MFI and surviving fraction for 3 independent experiments.
Parameters Corresponding to Radiotoxicity and Chemotoxicity of Drugs
Role of Agent Distribution in Cellular Toxicity
To evaluate the role of the distribution of 210Po-citrate, daunomycin, and doxorubicin in their subsequent toxicity within a cell population, the fluorescence histograms presented in Figure 1 were fitted to the lognormal probability density function to obtain the shape parameter σ (Fig. 2, Supplemental Fig. 1). Although increasing intracellular 210Po activity did not have an appreciable effect on σ over the range of concentrations studied for 210Po-citrate, increases in extracellular drug concentration had a marked impact on σ for both daunomycin and doxorubicin (Fig. 5A). The relationship between cell survival and σ for the 3 agents is illustrated in Figure 5B. These plots show that σ for 210Po-citrate does not change appreciably as the surviving fraction decreases. However, σ for daunomycin and doxorubicin decreases substantially as the surviving fraction decreases.

(A) Lognormal shape parameters σ for 210Po-citrate, daunomycin, and doxorubicin plotted against intracellular 210Po activity and extracellular concentrations of daunomycin and doxorubicin, respectively. (B) Surviving fraction vs. shape parameter for 210Po-citrate, daunomycin, and doxorubicin. Error bars represent SE of 3 independent experiments.
DISCUSSION
It is now well established that chemotherapy drugs and radiopharmaceuticals are typically heterogeneously distributed in tissues at the macroscopic, cellular, and subcellular levels (17–21,23,24,27,34). In the case of radiopharmaceuticals, this distribution complicates estimation of cellular absorbed doses based on cellular activities and causes the relationship between incorporated radioactivity and biologic response to be complex. Several in vitro studies have demonstrated saturation in cell kill with increasing activity per cell after exposure to a variety of radiochemicals and have attributed the phenomenon to the lognormal nature of the agent distribution (19–22). This effect has also been shown for 2 chemotherapeutics, daunomycin and doxorubicin (35,36). Given the clinical difficulty of sterilizing tumor cell populations with these and other agents, a more thorough understanding of their lognormal distributions and how they affect cell killing is needed to assist in selecting combinations of agents and guide the dosing of the constituent agents. Some enlightenment can be obtained by interpreting the flow cytometric and clonogenic survival studies described in this article.
Figure 1 demonstrates that flow cytometry can, under certain circumstances, be used to quantitate intracellular drug concentration, a concept discussed decades ago (23,24). In the present case, this approach is used for europium tetracycline–citrate (surrogate for 210Po-citrate) and 2 different chemotherapy drugs, daunomycin and doxorubicin. The distributions of intracellular agent concentration are lognormal (Fig. 2). As shown in Figure 2A and Supplemental Figure 1, europium tetracycline–citrate is exquisitely lognormal throughout the range of extracellular drug concentrations studied. Not only is it lognormal, but the breadth of the peak remains consistent as well. This fact is confirmed by the absence of a change in σ for europium tetracycline–citrate in Figure 5. In contrast, the breadths of the peaks and their corresponding σ values change markedly for daunomycin and doxorubicin (Figs. 2 and 5). Furthermore, there are notable exceptions to the lognormality of the data acquired for daunomycin and doxorubicin (Supplemental Fig. 1). In the case of daunomycin, there appears to be a growing population of cells on the low-fluorescence side of the peak as the extracellular concentration increases. Conversely, the slight departure of doxorubicin from lognormality occurs at low extracellular drug concentrations. These changes occur in concert with changes in the slope of drug uptake versus concentration of the drug in the extracellular medium, as emphasized by the dashed versus solid lines in Figures 3B and 3C.
The net MFI of intracellular europium tetracycline–citrate strongly correlates with both extracellular citrate concentration and intracellular 210Po activity (Fig. 3A), indicating that MFI of europium tetracycline–citrate may be related to 210Po toxicity. Similarly, the data for daunomycin and doxorubicin in Figures 3B and 3C support the longstanding notion that the extent of agent incorporation by cells can be used as a predictor of their cytotoxicity (37). To validate this notion, cell survival is plotted against net MFI and extracellular drug concentration or against intracellular 210Po activity and absorbed dose to the cell nucleus from 210Po-citrate (Fig. 4A). For 210Po-citrate, only 2 logs of cell killing is observed. (The monoexponential survival curve obtained for 210Po-citrate in this work is consistent with an earlier study that showed no tailing in the survival curve within a similar range of cell killing (32). Tailing in the cell survival curve has been shown to occur beyond 2 logs of cell killing in 3-dimensional cultures for both 210Po-citrate and 131I-iododeoxyuridine. This finding was attributed to the lognormal distribution of intracellular 210Po [0.54 < σ < 0.80] and possibly other factors such as geometry of the culture (22,38).) The relationship between the surviving fraction and net MFI (or cellular activity or absorbed dose) is exponential. Notably, neither the slope of the cellular uptake curve (Fig. 3A) nor the slope of the survival curve (Fig. 4A) or the value of the shape parameter (Fig. 5) changes over the range of the concentrations required to achieve 0–2 logs of cell kill. These conditions may be requirements to achieve a monoexponential survival curve and avert tailing of the survival curve.
The data in Figures 4B and 4C illustrate that cell survival is related to extracellular concentration (or net MFI) of daunomycin and doxorubicin by a 2-component exponential function, with tails analogous to those in previous studies using radiochemicals (20,22,28,38). Daunomycin and doxorubicin are closely related anthracyclines and interact with DNA by intercalation. Based on extracellular drug concentration in V79 cell cultures, daunomycin ultimately emerged as more cytotoxic than doxorubicin. Although this difference may be due to differences in the extent to which the drugs are incorporated, that explanation cannot be ascertained by flow cytometry alone but rather with the help of cellular uptake studies with daunomycin and doxorubicin labeled with 3H or 14C at known specific activities (23,24,27). What is certain is that the slope of the cellular uptake curves (Figs. 3B and 3C), the slope of the survival curves (Figs. 4B and 4C), and the value of the shape parameter (Fig. 5) all changed over the span of concentrations required to see the emergence of a tail in the survival curves. The presence of these conditions appears to be related to the 2-component exponential survival curves. In fact, the concentration (∼1–2 μM) at which these parameters begin to change (Figs. 2, 3, and 5) appears to coincide with the transition to the second component (Fig. 4).
The mean lethal concentrations (A37) for daunomycin and doxorubicin are 0.24 and 1.32 μM, respectively (Table 1). These values indicate that at low extracellular concentrations, daunomycin is approximately 5 times more lethal than doxorubicin in V79 cells. The mean lethal absorbed dose for 210Po-citrate is 1.2 Gy (Table 1). This value arises from an uptake of 0.21 mBq/cell, corresponding to about 3,600 atoms of 210Po. Although the survival curve is similar to that obtained previously, the present mean lethal dose is higher than the former value of 0.7 Gy (32), largely because of improved S values (33).
Although there is interest in using multimodal approaches that involve the concomitant delivery of chemotherapeutic and radiotherapeutic agents for cancer treatment (5,39), most efforts have not been directed at using agent-specific distribution profiles to target all malignant cells. To facilitate the design of cocktails that effectively target all cells of interest, an in-depth knowledge of the distribution profile of each agent is required. As suggested 3 decades ago, this requires the cellular incorporation of each agent on a cell-by-cell basis (23). As an initial step toward this end, the flow cytometric histograms presented in Figure 2 (and Supplemental Fig. 1) were fitted to the lognormal probability density function, and the derived shape parameters (σ) were plotted against intracellular 210Po activity or extracellular drug concentration (Fig. 5A). It is not surprising that these data are closely analogous to the relationship established elsewhere between heterogeneity of intracellular incorporation of doxorubicin and extracellular drug concentration (23), as the shape parameter is a measure of the broadness of a distribution profile. Although a small σ implies a narrow distribution profile (i.e., σ → 0 when all cells incorporate the same amount of agent), a large σ signifies a wide spread in distribution. In practice, σ is greater than 0, and therefore subpopulations of cells will always incorporate subtoxic amounts of any given agent (20,21). However, as has been shown in the present article, the value of σ is not itself necessarily the primary determinant of the shape of the survival curve. Rather, changes in the value of σ (Fig. 5A and 5B) and changes in the slope of the cellular uptake curves (Figs. 3B and 3C) appear to correlate with changes in the transition from the first component to second component of the 2-component exponential survival curves (Fig. 4B and 4C). Hence, formulation of recipes for combined-modality therapy should seek to use information from flow cytometry distribution to identify the drug concentration that will achieve the first component of killing. A similarly optimized additional agent could then be added with the aim of targeting cells that had low uptake of the first drug. Successively adding drugs would ultimately seek to achieve a net homogeneity, based on incorporation of all agents. Findings related to the distribution of therapeutic agents among a population of cells, and their corresponding dose–response characteristics, may vary considerably depending on cell type and the microenvironment within which the cells reside. In addition, factors such as resistant subpopulations can have a significant impact on the shape of the response curve. Therefore, caution is needed when cocktails are formulated on the basis of in vitro findings and then extrapolated to the in vivo setting encountered in the clinic.
CONCLUSION
This study provides additional experimental evidence to support the previous observation that the distribution of cellular radioactivity within a cell population is reasonably described by a lognormal probability density function (20). The ubiquity of the lognormal distribution is further demonstrated by the cellular uptake profiles of 2 chemotherapeutic drugs. Changes in the value of the lognormal shape parameter and changes in the slope of the cellular uptake curves with increasing drug concentration appear to flag the onset of saturation in the dose–response curve. Accordingly, measurement of these changes with flow cytometry can be used to rapidly assist in predicting biologic response to the drug and ultimately in formulating a cocktail of radiopharmaceuticals and chemotherapy drugs. However, relating agent incorporation with toxicity, on a cell-by-cell basis, will be invaluable in the ultimate selection of agents for the design of highly effective therapeutic cocktails (26).
Acknowledgments
This work was supported in part by NIH grant R01 CA083838-09. The content is solely the responsibility of the authors and does not necessarily represent the official views of the National Cancer Institute or the National Institutes of Health.
- © 2011 by Society of Nuclear Medicine
REFERENCES
- Received for publication September 23, 2010.
- Accepted for publication December 1, 2010.


Jump to section
Related Articles
Cited By...
- The Advantage of Antibody Cocktails for Targeted Alpha Therapy Depends on Specific Activity
- Cell-Level Dosimetry and Biologic Response Modeling of Heterogeneously Distributed Radionuclides: A Step Forward
- Lognormal Distribution of Cellular Uptake of Radiopharmaceuticals: Implications for Biologic Response in Cancer Treatment