


Abstract
Targeted α-therapy (TAT) appears to be an ideal therapeutic technique for eliminating malignant circulating, minimal residual, or micrometastatic cells. These types of malignancies are typically infraclinical, complicating the evaluation of potential treatments. This study presents a method of ex vivo activity quantification with an α-camera device, allowing measurement of the activity taken up by tumor cells in biologic structures a few tens of microns. Methods: We examined micrometastases from a murine model of ovarian carcinoma after injection of a radioimmunoconjugate labeled with 211At for TAT. At different time points, biologic samples were excised and cryosectioned. The activity level and the number of tumor cells were determined by combined information from 2 adjacent sections: one exposed to the α-camera and the other stained with hematoxylin and eosin. The time–activity curves for tumor cell clusters, comprising fewer than 10 cells, were derived for 2 different injected activities (6 and 1 MBq). Results: High uptake and good retention of the radioimmunoconjugate were observed at the surface of tumor cells. Dosimetric calculations based on the measured time-integrated activity indicated that for an injected activity of 1 MBq, isolated tumor cells received at least 12 Gy. In larger micrometastases (≤100 μm in diameter), the activity uptake per cell was lower, possibly because of hindered penetration of radiolabeled antibodies; however, the mean absorbed dose delivered to tumor cells was above 30 Gy, due to cross-fire irradiation. Conclusion: Using the α-camera, we developed a method of ex vivo activity quantification at the cellular scale, which was further applied to characterize the behavior of a radiolabeled antibody administered in vivo against ovarian carcinoma. This study demonstrated a reliable measurement of activity. This method of activity quantification, based on experimentally measured data, is expected to improve the relevance of small-scale dosimetry studies and thus to accelerate the optimization of TAT.
On the basis of the characteristics of the α-particle, targeted α-therapy (TAT) has been acknowledged as a potentially efficient therapeutic technique (1) for decades. α-particles have a short range in tissue, making the irradiation specific, and a high linear energy transfer, making them highly cytotoxic (2). These properties make them suitable for the treatment of hematologic malignancies or minimal residual or micrometastatic diseases (3,4). The first clinical trials using TAT have been started for the treatment of leukemia (5,6), ovarian carcinoma (7), and residual tumor cells after surgery of malignant brain tumors (8).
Micrometastatic diseases are infraclinical and hardy or not localized with in vivo imaging techniques. Thus, targeted radionuclide therapies of tumor cells or micrometastases require complex evaluations. Activity quantification of micrometric lesions by imaging is difficult in patients because of the limited spatial resolution. Only rough estimations of the activity of isolated tumor cells are feasible, and they are based on assumptions of tumor burden size (5,6).
Consequently, preclinical experiments are required to assess the targeting efficiency of the radiolabeled vector and to identify the optimal conditions for treatment delivery. The first method for selecting the most promising vector for delivering α-emitters to tumors is based on in vitro measurements of the activity taken up by isolated cells (9–11). However, in vivo evaluations are complex, even in animal studies, for determining tumor uptake of radioimmunoconjugates in the context of circulating cells, residual cells, or minimal diseases. To perform accurate dosimetric studies and estimate the therapeutic window of a potential treatment, it is essential to measure the temporal distribution of activity within the micrometric lesions. To that purpose, small-scale ex vivo quantifications (i.e., assessment of the temporal distribution of the radionuclide, presumably presenting the number of radiolabeled vectors per tumor cell) can provide invaluable information.
Recently, a device based on autoradiography, the α-camera, was developed and evaluated by our group (12). This device provides images of activity distribution (of α-emitters) with good spatial resolution (around 35 μm). In the present study, we used the α-camera to develop a method to quantify the activity taken up by small micrometastases excised from a murine model of ovarian carcinoma after TAT. We hypothesized that this method would allow estimations of relevant, small-scale, mean absorbed doses and thus provide a means to confirm the delivery of potentially therapeutic absorbed doses to tumor cells.
MATERIALS AND METHODS
Overview
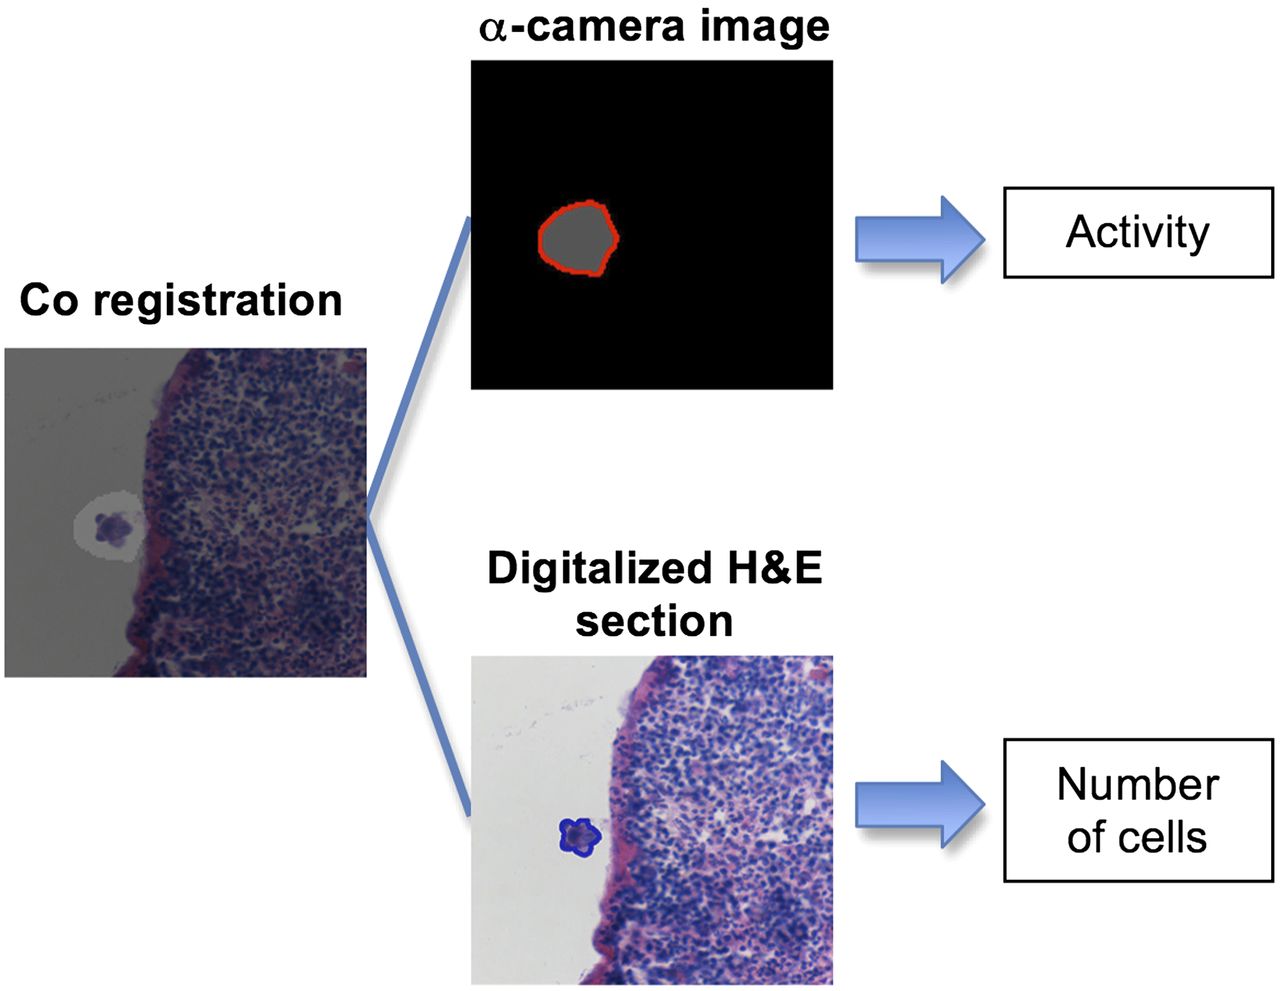
The general method of quantification is described in Figure 1. The samples comprised small micrometastases excised from a nude mouse model of ovarian carcinoma (OVCAR-3) after TAT. The method was developed to measure the tumor cell uptake of a monoclonal antibody (mAb), MX35, radiolabeled with the α-emitter 211At.

Illustration of different steps involved in activity quantification process.
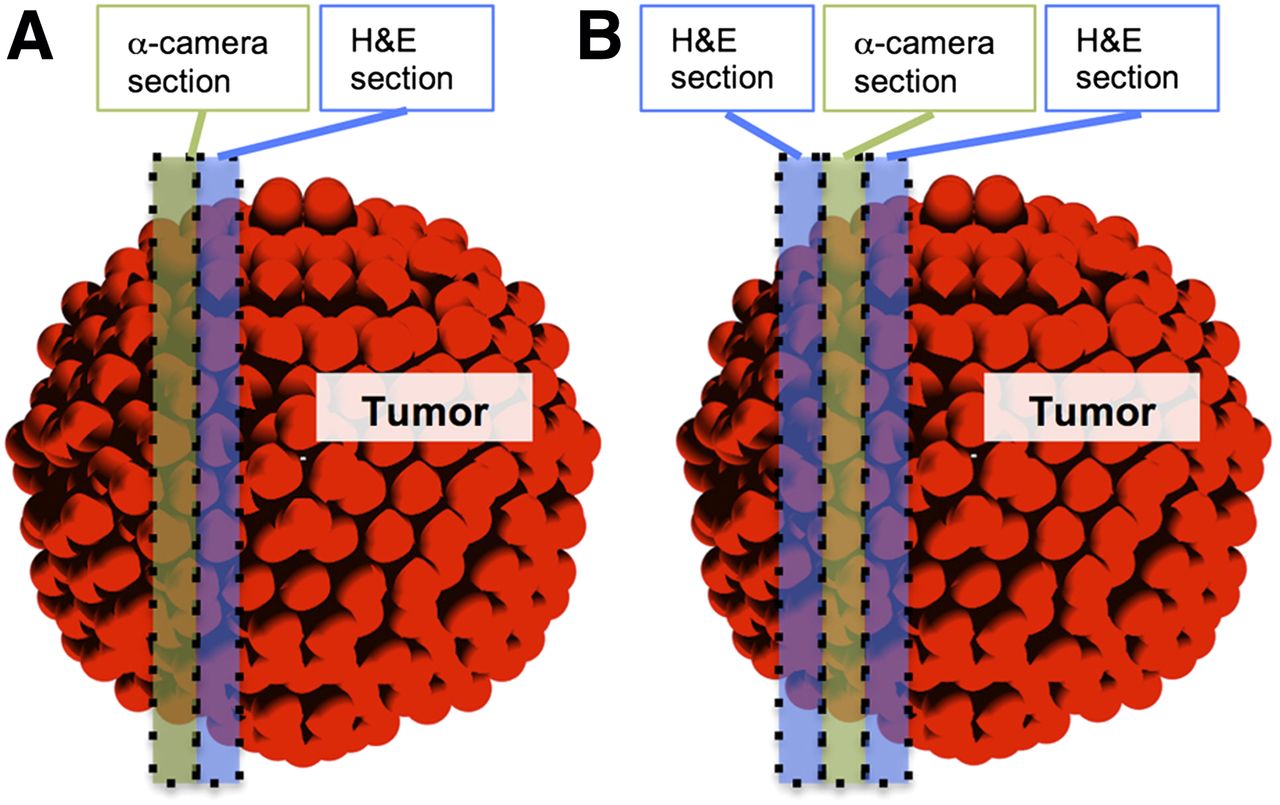
The excised biologic samples were snap-frozen and cryosectioned as previously described (12). Ten to 20 pairs of consecutive sections were analyzed for each sample: one section for α-camera imaging and the other section for staining with hematoxylin and eosin (H&E) (in some cases, 3 consecutive sections were analyzed [Fig. 2]). The α-camera image of radioactivity and the digitalized image of the H&E section were manually coregistered with Adobe Photoshop CS5 software. A region of interest (ROI) was manually drawn on the α-camera image with the ImageJ software (version 1.6.0_29; National Institutes of Health), as shown in Figure 1. The total pixel intensity within the ROI was quantified. A calibration curve was used to derive a coefficient that related the pixel intensity value to the activity of the α-emitter, and this was used to estimate the activity in each ROI. This value was corrected for decay as discussed below (Eq. 4).

Description of sectioning scheme performed on biologic samples. (A) Method for all biologic samples: first section was used for α-camera imaging and consecutive section for H&E staining. In some cases, 3 consecutive sections were taken (B) to evaluate accuracy of cell number determination.
Similarly, an ROI was drawn on the digitalized H&E section to evaluate the number of cells that corresponded to the measured activity. The number of cells in an ROI was estimated with the following equation:
The activity per cell (Acell; at a given time after injection) was derived by dividing the activity measured in the ROI of the α-camera image (AROI) by the number of cells within this part of the micrometastasis, NbCells,ROI:
α-Camera Images
Three α-camera systems were set up in parallel. The α-camera system consisted of a cooled, high-sensitivity charge-coupled device (SXV-H9; Starlight Xpress Ltd.), coupled to a photographic lens (60 mm f/2.8 Micro-Nikkor; Nikon Corp.) (12). Specimens to be imaged (i.e., tissue sections on a scintillating sheet) were placed on an adjustable stand below the photographic lens. The distance of the specimen to the lens was adjusted to capture the entire specimen within the field of view.
A series of 600- or 1,200-s images (∼10) was acquired for each group of specimens. Postprocessing was performed as described previously (12).
The coefficient for converting the pixel intensity in an α-camera image into activity was determined during the experiments. This coefficient depended on the specimen-to-lens distance. To establish the calibration curve for each camera, each sample was imaged with the α-camera at a given pixel resolution (proportional to the specimen-to-lens distance), then measured with a γ-counter (Wizard 1480; Wallac Oy). At each distance, and for numerous samples, the calibration coefficients were calculated by dividing the γ-counter–measured activity (Bq) by the total pixel intensity per second of acquisition (pixel intensity unit·s−1) for the whole tissue section. The calibration curves comprised the coefficient of calibration plotted as a function of the pixel resolution. Experimental points were fitted with a second-order polynomial curve.
Because the exposure times were long (≤2 h), a correction was applied (Eq. 3) to the measured activity (AROI,Meas) equal to PIROI × CoeffCalib to correct for radioactive decay during the time of acquisition; that is, the activity was not constant during the acquisition period (Δt). Using the decay constant of 211At (λ), we derived the activity in an ROI at the start of the acquisition using the following equation:
Accuracy of Cell Number Determination
The estimated cell number, from the H&E section adjacent to the imaged α-camera section, was used for deriving the activity per cell (Fig. 2A). The size of this introduced sampling error depended on the size and shape of the analyzed tumor cell cluster. To evaluate this error, a third section, from the other side of the α-camera section (Fig. 2B), was evaluated. The number of cells in each identified cluster was determined in this third section (NbCells,third). We considered the true cell number (NbCells.true) to be the average:
To estimate the uncertainty in the NbCells,ROI value, the distributions of
Other uncertainties of the method, including the general uncertainty, are detailed in the supplemental materials (available online only at http://jnm.snmjournals.org).
Astatine
The α-emitter 211At was produced in a cyclotron (Scanditronix MC32; Cyclotron and PET Unit, Rigshospitalet) via the 209Bi(α,2n)211At reaction and isolated with a dry distillation procedure (13). The half-life of 211At is 7.2 h, and the emitted α-particles (7.45 and 5.87 MeV, with ranges in tissue of 70 and 48 μm) were generated through 2 branches of decay (58% and 42%, respectively).
mAb
The murine IgG1 class mAb MX35 (F(ab′)2 fragments) targets the NaPi2b cell surface glycoprotein expressed on more than 90% of human epithelial ovarian cancers (14,15).
Cells
The human ovarian cancer cell line NIH:OVCAR-3 (16) was obtained from the American Type Culture Collection. Cell cultures were maintained at the Department of Oncology at Sahlgrenska University Hospital.
Antibody Labeling
The mAb MX35 was labeled with 211At using the reagent m-MeATE (N-succinimidyl 3-(trimethylstannyl)benzoate), as previously described (17). The specific activity achieved was 650 MBq/mg (i.e., 1 of 250 mAbs labeled with an 211At atom) for all the experiments. The radiochemical purity was more than 99%, determined by methanol precipitation, and the immunoreactivity was about 85%.
Animals and Study Groups
Female, nude BALB/c nu/nu mice (n = 44; age range, 5–7 wk [Charles River Laboratories]) were inoculated intraperitoneally with 1 × 10⁷ NIH:OVCAR-3 cells in 0.2 mL of cell medium. After 3–8 wk (to obtain micrometastases of variable sizes), the mice were intraperitoneally treated with 6 MBq (5.8–7 MBq) or 1 MBq (0.8–1.1 MBq) of 211At-MX35 F(ab′)2 in 0.75 mL of phosphate-buffered saline. For each activity (1 and 6 MBq), animals were sacrificed at 1.5 h (n = 6 + 6), 4 h (n = 6 + 6), 8 h (n = 6 + 6), and 24 h (n = 4 + 4). The spleen, stomach, liver, peritoneal wall samples, and suspected lymph nodes were excised and snap-frozen. All animal experiments were approved by the ethics committee of the University of Gothenburg.
Time–Activity Curve
The activity per cell (Acell; Eq. 3) was derived by quantification of activity in hundreds of tumor cell clusters at 4 different time points after injection. Acell values were sorted into groups according to the size of the cluster, as measured on the digitalized H&E sections. Two cluster sizes were considered: those with radii less than 13.5 μm (corresponding to <5 cells in a 12-μm-thick section) and those with radii between 23.4 and 42.8 μm (between 15 and 50 cells in a 12-μm-thick section). The Acell versus time point curve (i.e., time–activity plot) for each group was fitted using the equation y = (1 − exp(−a × t)) × exp(−b × t). The time-integrated activity per cell was derived as the area under the fitting curve.
Dosimetry
Dosimetric calculations at the cellular level were performed to estimate the mean absorbed dose delivered to tumor cells for each injected activity (1 or 6 MBq). We used a validated code, based on analytic calculations, that is able to determine the mean absorbed doses to isolated cells or cells within spheroids, exposed to α-particles emitted from variable compartments (cell surface, cytoplasm, nucleus, extracellular domain) (18). In the case of spheroids, the contributions both from radiolabeled antibodies on the cell and from cross-fire are used to calculate the mean absorbed dose. The time-integrated activity derived above was used as an input for the algorithm. Cells and nuclei were modeled as 2 concentric homogeneous spheres of density 1 g/cm3 with radii of 6.9 and 5.5 μm, respectively. We calculated the mean absorbed dose delivered to isolated cells, based on the time-integrated activity determined for clusters with a 13.5-μm radius, and the mean absorbed dose delivered to cells within a micrometastasis with a radius of 42.8 μm (modeled by a spheroid containing 200 cells), based on the number of decays per cell (which was measured experimentally for this cluster size). The spatial resolution (∼35 μm) of the α-camera images in this study did not allow for discrimination of differences in cell uptake of the radiolabeled antibody according to position in the cluster, but no cold spots were observed within identified tumor cell clusters, therefore a uniform activity distribution was assumed.
Statistical Analysis
Mean values of activity per cell were compared using a 2-sample t test with the PRISM 5 software (GraphPad Software, Inc.). P values of less than 0.05 were considered significant. Data are expressed as mean ± SD.
RESULTS
α-Camera Calibration Coefficient
The calibration coefficient for the α-camera (Fig. 3) was derived by plotting the measured activity (Bq) divided by the pixel intensity per second of acquisition as a function of the relative pixel size (μm) in the field of view (proportional to the specimen-to-lens distance). The experimental data were satisfactorily fitted with a second-order polynomial curve: y = b0 + b1 × x + b2 × x^2 (b0 = 3.973 × 10⁻³ ± 9.07 × 10⁻⁴; b1 = −3.32 × 10⁻⁴ ± 1.14 × 10⁻⁴; b2 = 1.93 × 10⁻⁵ ± 3.3 × 10⁻⁶).
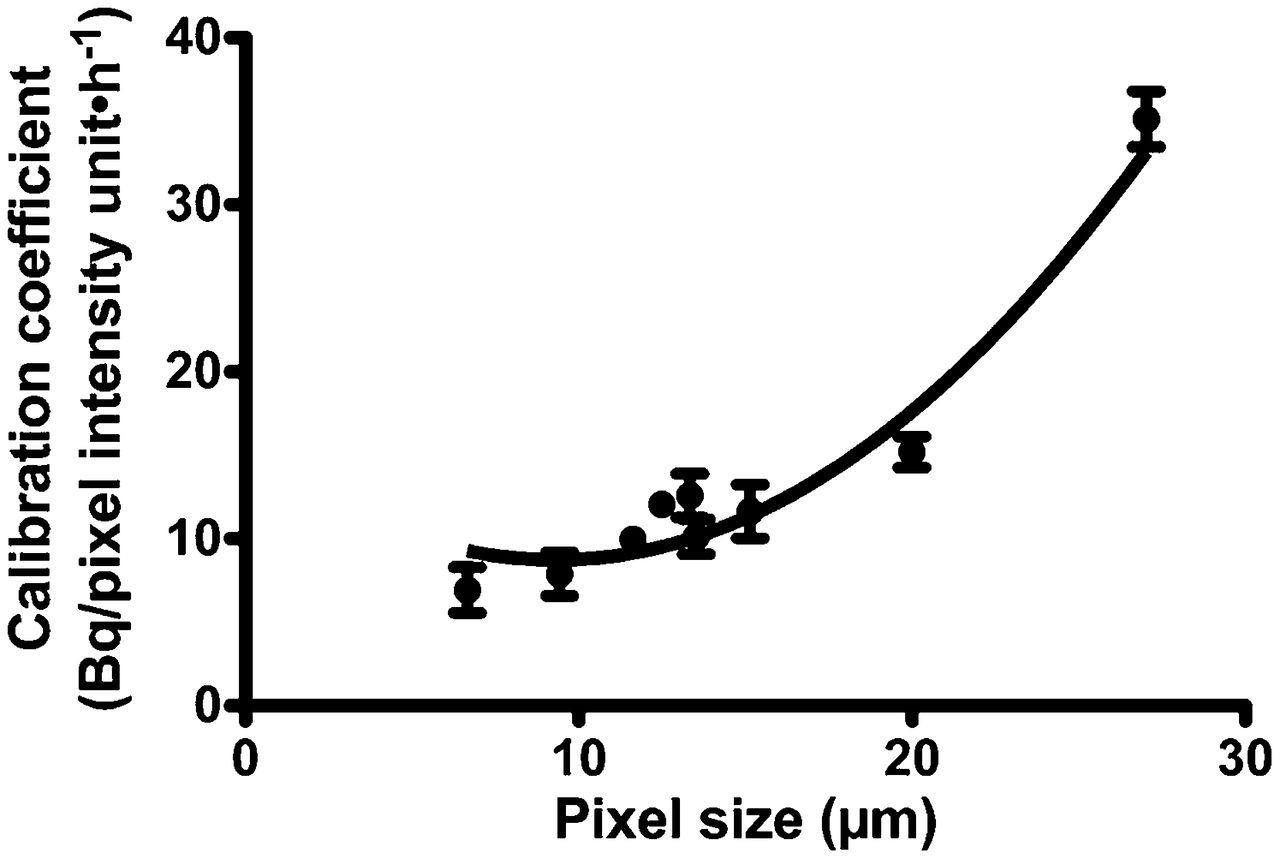
Coefficient of calibration (that relates activity to pixel intensity on α-camera images per second of acquisition) as function of pixel size on α-camera image for 1 α-camera. Experimental points were fitted with second-degree polynomial curve.
Accuracy of Number of Cells Determination
Figure 4 shows the distributions of
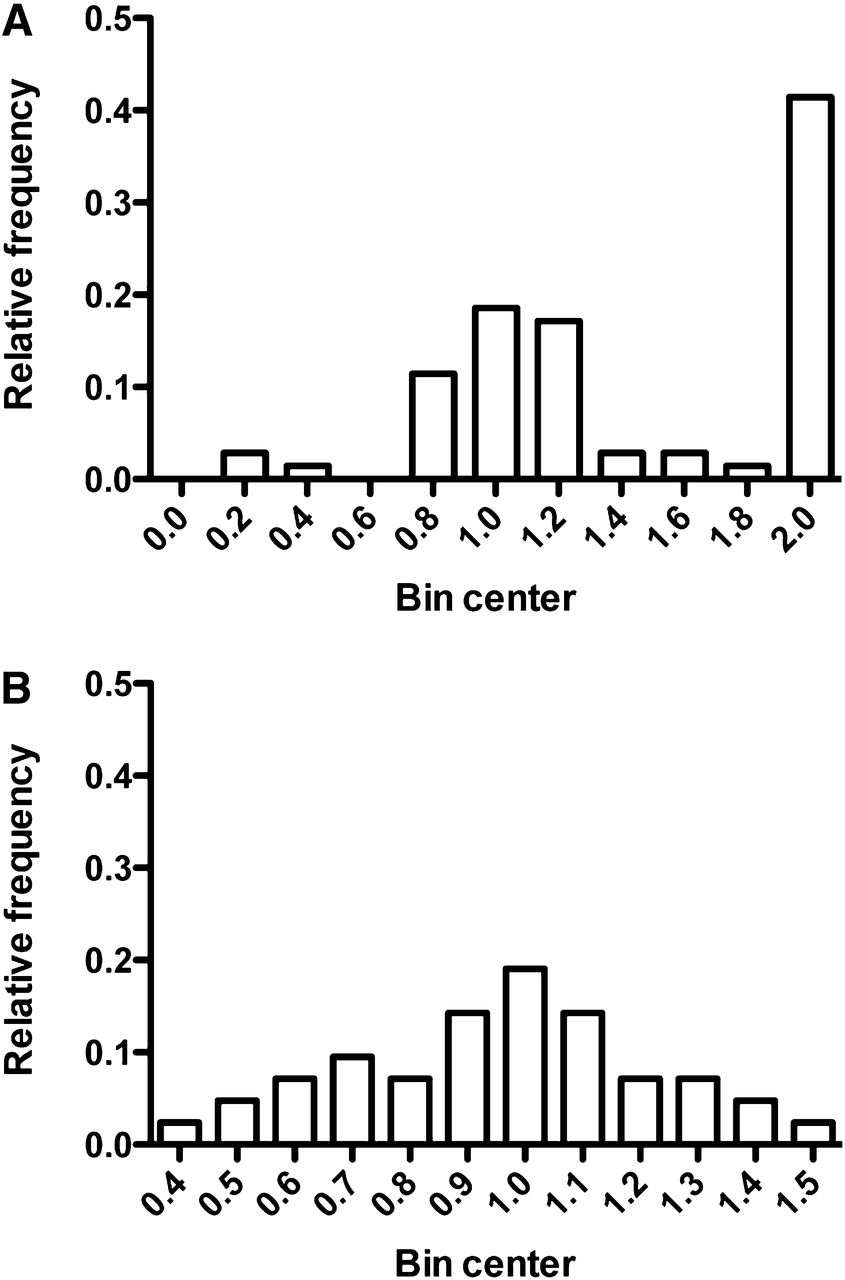
Distributions of ratio  (i.e., number of cells estimated by general method divided by number of cells estimated by use of 3 consecutive sections) for 2 sizes of clusters (<13.5-μm radius [A] and 23.4- to 42.8-μm radius [B]).
Experimental Measurements
At different time points, the animals were dissected and spleen and stomach were excised. A significant number of tumor clusters (>30) were typically found in one third of the animals at 1.5, 4, and 8 h for both injected activities. At 24 h, only one 6-MBq animal could be used for activity uptake measurements. For 1-MBq animals, the α-camera image signals were too low for analysis at the 24-h time point (i.e., the delineation of tumor ROIs was impossible due to a low signal-to-noise ratio).
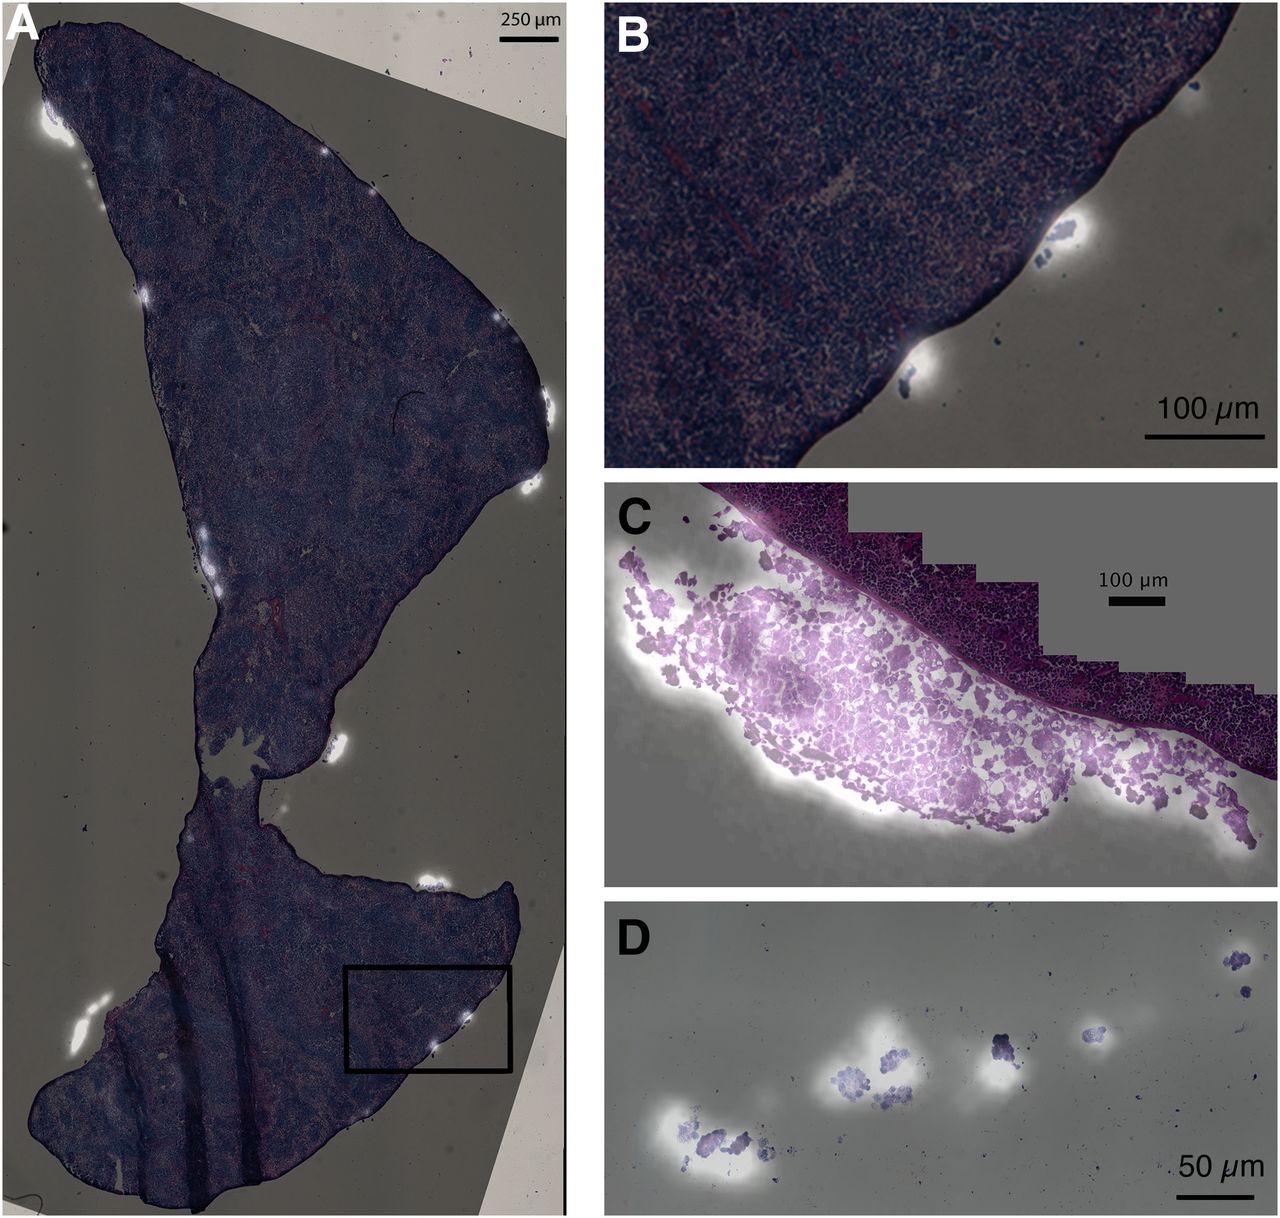
Figure 5 shows examples of coregistration of α-camera images and the digitalized adjacent H&E section, displaying numerous tumor cell clusters by the peritoneal surface of the spleen. The activity distribution from the α-camera image closely matched the anatomic features. α-camera images were acquired from samples of different animals, and one can notice micrometastases of variable sizes.

Coregistration of α-camera images and their consecutive H&E section. Bright areas represent areas of high activity. (A) Whole section of spleen with numerous tumor cell clusters for which activity uptake is significant 4 h after injection. (B) Blow up of previous image showing 4 clusters and corresponding activity spots on α-camera image. (C) Nonvascularized micrometastasis (400-µm thick and 800-µm wide) attached to spleen. Eight hours after injection, activity distribution appeared slightly uniform. (D) Detail of section of drop of ascitic fluid containing tumor cell clusters.
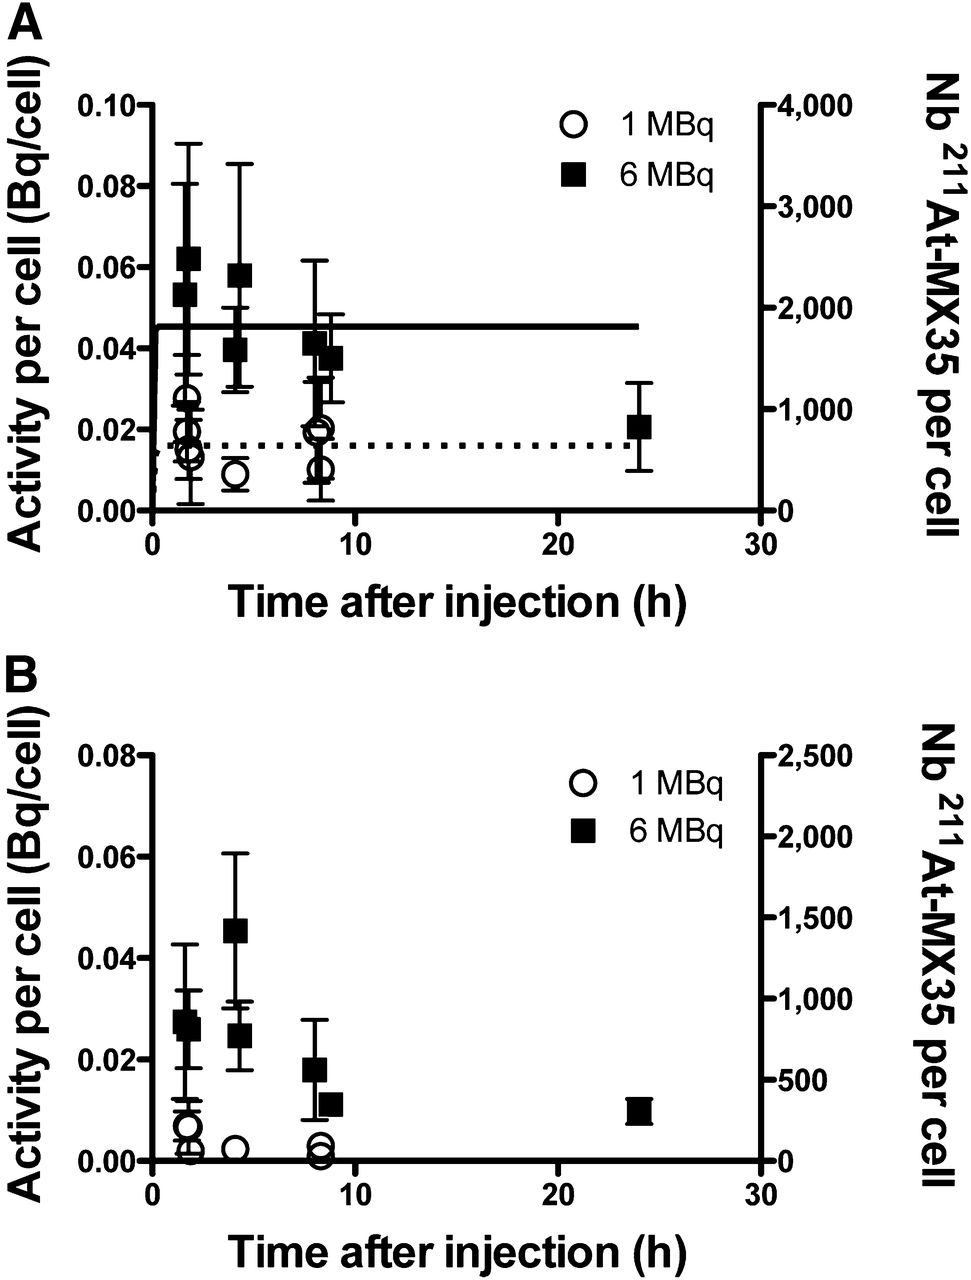
Figure 6A represents the time–activity plots (decay-corrected) for tumor clusters with less than 13.5-μm radii for both injected activities (1 and 6 MBq). The small tumor clusters represented a situation similar to an isolated cell. For the 6-MBq injection, at 1.5 h, we observed a maximal uptake of ≈0.07 ± 0.02 Bq/cell (corresponding to 2,100 radiolabeled antibodies per cell). After the 1-MBq injection, the maximal uptake was ≈0.02 ± 0.01 Bq/cell (i.e., 700 radiolabeled antibodies per cell). For both injections, up to 8 h, the number of radiolabeled antibodies attached to tumor cells remained nearly constant (regardless of physical decay). At 24 h after the 6-MBq injection, the cluster activity uptake had decreased from 2,100 to around 800 radiolabeled antibodies per cell. Both experimental plots (for 1 and 6 MBq) were fitted with a standard antibody binding equation (assuming antibody excess in the peritoneal cavity) applied with PRISM 5 software:

Activity per cell (left y-axis) and number of radiolabeled antibodies per cell (right y-axis) as function of time after injection for 2 different injected activities (1 and 6 MBq) within micrometastases less than 13.5 μm in radius (A) and within micrometastases comprised between 23.4 and 42.8 µm (B). Experimental points were decay-corrected. Error bars represent SD of all experimental measurements at each time point. For micrometastases less than 13.5 µm in radius (A), plots for both activities were fitted (plain line for 6 MBq, dotted line for 1 MBq) with classic antibody binding equation (Eq. 6). Value at 24 h and for 6 MBq was discarded in fitting process.
Here, Bmax represents the total number of antigens on the tumor cell surface, SA is the specific activity of the 211At-MX35 antibody (650 MBq/mg), M is the molar mass of MX35 F(ab′)2 (100,000 g/mol), NA is the Avogadro constant, r is the immunoreactive fraction (0.82), Ainj is the injected activity (6 or 1 MBq), and Vinj is the injected solution volume (0.75 mL). The fits of both curves provided a Bmax of 7 × 10⁵ ± 1.8 × 10⁵, the Kon was 44,000 L mol−1 s−1, and the Koff was 2.2 × 10⁻³ s−1 ± 0.67 × 10⁻³. The value of Kon was fixed as a constant in the fitting equation, based on previous in vitro measurements (19).
Figure 6B represents the time–activity plots (decay-corrected) for tumor clusters with 23.4- to 42.8-μm radii for both injected activities (1 and 6 MBq). The curve shapes were similar for large and small clusters, but the uptake per cell was significantly lower for large clusters (Fig. 6B). For 6-MBq injections, the activity per cell was constant from 1.5 h (≈0.027 ± 0.010 Bq/cell) to 4 h (≈0.034 ± 0.012 Bq/cell), then decreased slightly at 8 h (≈0.015 ± 0.010 Bq/cell). For 1-MBq injections, the maximum uptake was observed around 1.5 h (≈0.005 ± 0.002 Bq/cell) and decreased thereafter.
The time-integrated activity for small tumor clusters was over 1,700 decays per cell for a 6-MBq injection, as derived from the lines shown in Figure 6A. This value decreased to 500 decays per cell for a 1-MBq injection. Using these values, we estimated the mean absorbed dose delivered to isolated cells, and they were approximately 40 and 12 Gy for injections of 6 and 1 MBq, respectively. For the large tumor clusters, around 750 and 180 decays per cell were detected for the 6- and 1-MBq injections, respectively. Assuming a uniform activity distribution in those clusters, the calculations showed that cells received between 125 and 245 Gy for the 6-MBq injections and between 30 and 60 Gy for the 1-MBq injections (with >85% of the mean absorbed dose originating from cross-fire irradiation).
DISCUSSION
Because of the characteristics of α-particles, TAT is expected to be a potent treatment for circulating, minimal, and residual malignancies. The development of radioimmunoconjugates for those indications involves complex evaluations. Consequently, many evaluations rely on in vitro measurements of radiolabeled vector binding and tumor cell survival (20) or on the estimation of in vivo efficacy for different kinds of malignant lesions (e.g., subcutaneous tumors grafted on mice) (21). For ovarian carcinoma, TATs were evaluated with a model mimicking the human minimal disease (i.e., peritoneal spread of micrometastases) to determine the efficacy of 211At-MX35 and compare it with other radiolabeled specific (19) and nonspecific antibodies (22). The endpoint was the fraction of animals that presented no visible signs of tumor at 8 wk after therapy. These studies contributed to the initiation of a clinical trial (7); however, numerous questions remained unanswered and prevented proper optimization. In general, it has been difficult to measure pre- and posttherapy tumor statuses; thus, the efficacy evaluation can be misleading (23).
We demonstrate here a method using ex vivo measurements to assess activity uptake in micrometastases and even in isolated tumor cells. We showed that the time-integrated activity could be measured directly in targeted tumor clusters or tumor cells, enabling comparisons of the in vivo action of different radioimmunoconjugate regimens. Previous attempts to measure activity uptake on micrometric tumor structures with autoradiography have been confined to snapshot measurements that provided the activity distribution at only 1 time point after treatment injection (24,25). The present method showed that the α-camera could be used to determine both spatial and temporal activity distributions, despite the need to analyze samples from different sacrificed animals.
Uncertainties
To validate this technique and evaluate its accuracy, we detailed and estimated the uncertainties associated with each step of the calculation (supplemental materials). The global relative uncertainty on the value of activity per cell was estimated to be approximately 75% for a case example of a tumor cluster of 42.8 μm in radius. We expected that an analysis of 10–15 clusters would be sufficient to achieve an acceptable confidence level (i.e., a relative uncertainty close to 20%). This process highlighted difficulties in determining the number of cells in very small tumor cell clusters (<13.5 μm in radius)—that is, close to 1 cell. The distribution of the ratio (measured value:true estimation of the value) was non-gaussian, indicating a potential systematic error. This error was not observed for large clusters. To investigate the impact of this error, we created another time–activity curve based on 2 H&E-stained sections to determine the number of cells. We analyzed several clusters at different time points (n = 20 + 25 at 1.5 h, n = 30 at 4 h, and n = 9 at 8 h). As expected, the activity per cell determined by this method was slightly higher when based on 3, rather than 2, adjacent sections. This difference was not significant, given the error bars. For example, from the 2 animals studied at 1.5 h, the activities were 0.044 ± 0.021 and 0.059 ± 0.028 Bq/cell based on 3 sections and 0.040 ± 0.018 and 0.052 ± 0.028 Bq/cell based on 2 sections. Nevertheless, we recommend that future studies on small biologic structures should be based on 3 consecutive sections to increase confidence in the results.
Experimental values for the largest analyzed clusters were associated with a relative SD between 15% and 50%, where around 10 clusters were analyzed at each time point. This SD was, in some cases, slightly higher than theoretic estimations. However, previous studies observed relatively high biologic variability in the number of antigens present at the surface of tumor cells (26,27), possibly explaining the discrepancy between our theoretic estimations and experimental measurements.
Time–Activity Curves
In the murine model used in this work, we targeted micrometastases in the peritoneal cavity with intraperitoneal injections of the 211At-MX35 antibody at 2 different injected activities. In previous studies, activity uptake by micrometastases was modeled with binding parameters determined in vitro (19). Because of the micrometric nature of the malignant lesions, no previous studies have performed in vivo assessments of tumor uptake. With the present method, it was possible to make experimentally based measurements and create a time–activity curve for micrometastases as small as a few tumor cells. Using this data, we derived relevant values of the mean absorbed dose delivered to tumor cells. We found good radiolabel stability for up to 8 h, with a constant number of antibodies on the surfaces of cells. At 24 h, and to a lesser degree at 8 h, the measured activity per cell declined. It was not possible to ascertain whether this decline resulted from instability of the antigen–antibody association, from conjugate instability (less probable according to in vitro results demonstrating good stability of the labeling method (17)), or from a measurement artifact (at late time points, the signal-to-noise ratio had declined on the α-camera images; thus, data were less reliable). Additionally, cell damage after 8–24 h of acute irradiation could induce measurement errors. We assume that ultrastructural changes in irradiated cells, receiving more than 10 Gy of α-particle irradiation, could affect the results derived from our method.
Small-Scale Dosimetry
When time–activity curves for 6- and 1-MBq injections were fitted, we found in vivo values of Bmax (7 × 10⁵) and antibody dissociation constant, Kd (5 × 10⁻⁸ M). Previously (19), in vitro measurements indicated that OVCAR-3 cells possessed approximately 1 × 10⁶ antigens, and the antibody Koff was negligible. In the present work, the maximal uptake on tumor cells depended on the injected activity. This could argue for the possibility of antibody dissociation. From previous in vitro measurements, theoretic modeling estimated that the number of decays per cell would be more than 800 for an injected activity of 1 MBq, taking into account a specific activity of 134 MBq/mg, which was used at that time (19). Those values were previously used for small-scale dosimetry and the establishment of dose–effect curves. However, the 2 dose–effect curves reported at that time for injections of nonspecific and specific radiolabeled antibodies were different, possibly indicating an overestimation of the mean absorbed dose delivered in the case of specific antibodies (22). In the present study, the measured time-integrated activity was around 500 decays per cell for a 1-MBq injection (specific activity, 650 MBq/mg, or 4.8 times the specific activity used in previous studies). This value was 7.7 times less than the theoretically modeled value (scaling for the specific activity). On the basis of our experimental time-integrated activity, we calculated that the mean self-absorbed dose delivered to OVCAR-3 cells was around 12 Gy, a highly therapeutic dose, because a D0 (the mean absorbed dose required to reduce cell survival to 37%) of 0.56 Gy was determined in vitro for OVCAR-3 cells (9).
Interestingly, clusters with radii greater than 20 μm had significantly lower uptake than smaller clusters, regardless of the injected activity. At 1.5 h, after a 1-MBq injection, the activity was less than 0.025 Bq/cell for large micrometastases and around 0.05 Bq/cell for an isolated tumor cell (P = 0.018).
For large tumor clusters (>100 μm in diameter), slow penetration of radiolabeled antibodies through the tumors was reported (28–30). We therefore expected that the number of radiolabeled antibodies per tumor cell (after decay-correction) would increase with time. For both injected activities, this was not observed in the first 8 h after the injection. Within large micrometastases (>500 μm) containing more than 5,000 cells, the activity distribution showed no ring-effect—that is, presence of activity only at the edge of the micrometastasis—at early time points (Fig. 5C). In contrast, the distribution appeared uniform.
Despite the lower uptake per cell in the large clusters, the time-integrated activity was still high; an average of 500 decays per cell was measured within micrometastases of 23.4–42.8 μm in radii (i.e., between 15 and 50 cells in a 12-μm-thick section) for 1-MBq injections. Although activity distribution was unknown in micrometastases, the range of possible mean absorbed doses could be estimated by considering 2 opposing scenarios: a uniform distribution of activity or a skewed distribution. In the latter scenario, all the labeled antibodies (500 decays per cell × number of cells in the micrometastasis) were assumed to be attached to tumor cells at the edge of the lesion. When a uniform distribution of decays was assumed within a large micrometastasis (42.8-μm radius), the mean absorbed dose delivered to cells was between 30 (cells on the edge) and 60 Gy (cells in the core). When a skewed distribution of decays was assumed for the micrometastasis, the lowest mean absorbed dose in the tumor was 26 Gy. Again, those values are expected to be therapeutic, and they may explain the good therapeutic outcomes previously observed (22). Further studies on penetration of MX35 within intraperitoneal larger metastases are ongoing.
CONCLUSION
The present work demonstrated a method for measuring time–activity curves at the cellular scale from experimental data. Our results provided information on the binding of a specific radiolabeled antibody to ovarian carcinoma micrometastases. We measured a high activity uptake, particularly for micrometastases of only a few tumor cells. This quantitative method represents a step forward in the development of small-scale dosimetry, because further modeling was not required to derive the spatial and temporal activity distributions in micrometric biologic structures. This method is not limited to preclinical experiments; in future, it could be applied to the analysis of tumor material excised from patients undergoing surgery.
DISCLOSURE
The costs of publication of this article were defrayed in part by the payment of page charges. Therefore, and solely to indicate this fact, this article is hereby marked “advertisement” in accordance with 18 USC section 1734. This work was supported by grants from the Swedish Cancer Society, the Swedish Research Council, the Swedish Radiation Safety Authority, the Assar Gabrielsson Foundation, and the King Gustaf V Jubilee Clinic Research Foundation in Gothenburg, Sweden. No other potential conflict of interest relevant to this article was reported.
Footnotes
Published online Jun. 12, 2013.
- © 2013 by the Society of Nuclear Medicine and Molecular Imaging, Inc.
REFERENCES
- Received for publication August 31, 2012.
- Accepted for publication February 7, 2013.


Jump to section
Related Articles
Cited By...
- Tumor Control Probability and Small-Scale Monte Carlo Dosimetry: Effects of Heterogenous Intratumoral Activity Distribution in Radiopharmaceutical Therapy
- Dose-Dependent Growth Delay of Breast Cancer Xenografts in the Bone Marrow of Mice Treated with 223Ra: The Role of Bystander Effects and Their Potential for Therapy
- Biokinetic Modeling and Dosimetry for Optimizing Intraperitoneal Radioimmunotherapy of Ovarian Cancer Microtumors
- {alpha}-Imaging Confirmed Efficient Targeting of CD45-Positive Cells After 211At-Radioimmunotherapy for Hematopoietic Cell Transplantation
- Astatine-211 conjugated to an anti-CD20 monoclonal antibody eradicates disseminated B-cell lymphoma in a mouse model