


Article Figures & Data
Figures
- FIGURE 1.
Initial mean cellular activity <ao> as function of activity concentration C of 210Po-citrate in culture medium for representative experiment. Error bars represent SD of mean for 3 replicate measurements of <ao> and C. Solid line represents linear least-squares fit of the data.
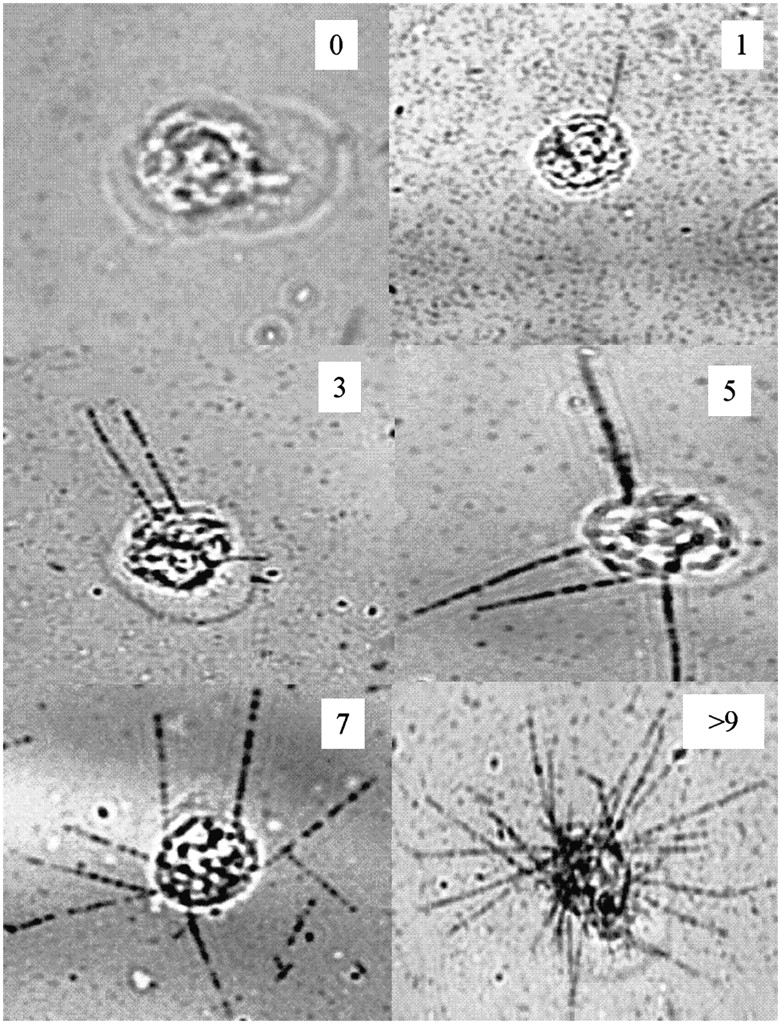
- FIGURE 2.
Autoradiographs of cells within a population exposed to culture medium containing 67 kBq/mL of 210Po-citrate. These images show cells with 0, 1, 3, 5, 7, and >9 α-particle tracks, demonstrating wide variation in cellular uptake of 210Po-citrate.
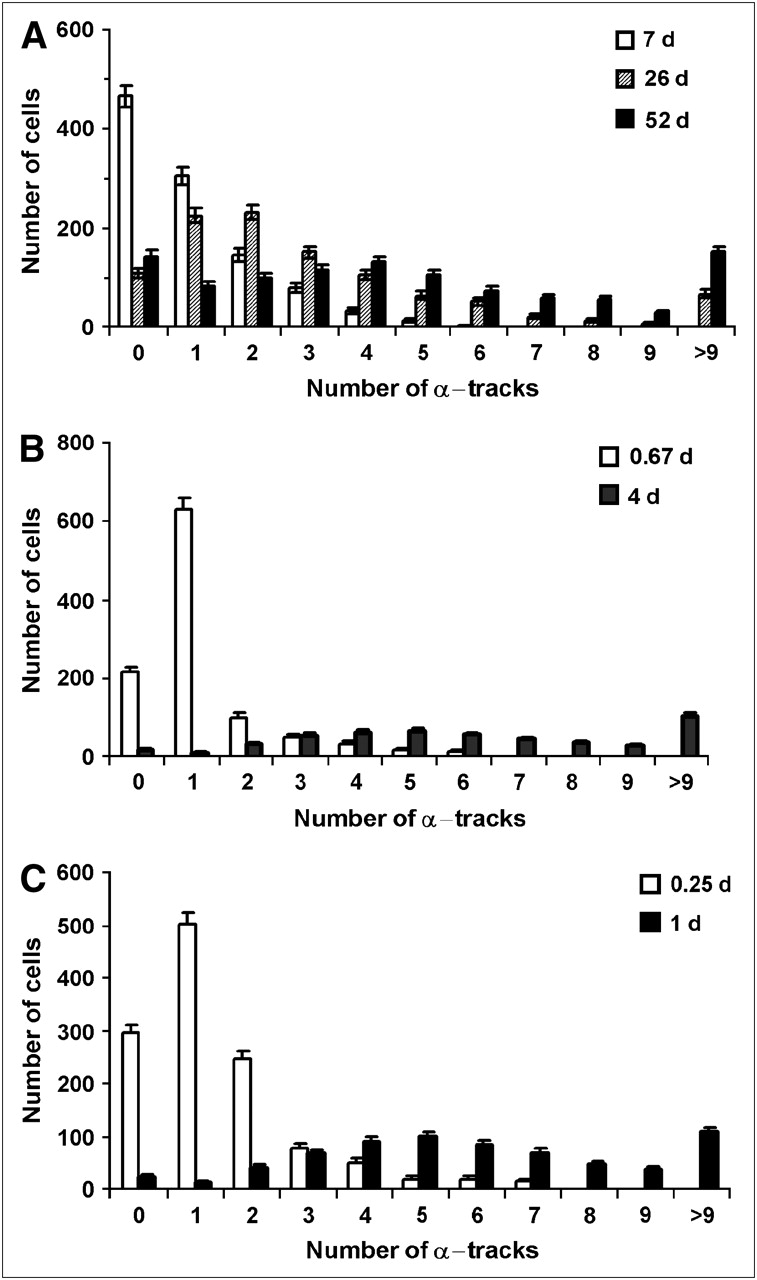
- FIGURE 3.
Distribution of α-particle tracks in cells that were incubated in culture medium containing 210Po-citrate: 0.52 kBq/mL (A), 3.8 kBq/mL (B), 67 kBq/mL (C). <ao> was 0.054, 0.12, and 1.8 mBq per cell in A, B, and C, respectively. Decays were allowed to accumulate for different times, as indicated in the keys in A–C.
- FIGURE 4.
Distribution of convolved α-particle tracks (lower abscissae) and initial cellular activity (upper abscissae) in cell populations having mean activity per cell <ao> of 0.054 mBq per cell (A), 0.12 mBq per cell (B), and 1.8 mBq per cell (C). α-Particle tracks are result of convolving the data shown in Figure 3. Data arising from different decay accumulation times are denoted with different symbols: (A) 52 d (•), 26 d (▪), 7 d (▴); (B) 4 d (•), 0.67 d (▴); and (C) 1 d (•), 0.25 d (▴). The close correspondence of convolved data from different time points supports the accuracy of the convolution approach. Error bars represent SE. Cellular activity was calculated from track data using Equation 3. Curve represents least-squares fit of Equation 5 to convolved track data. Details regarding fitted parameters and corresponding statistical quantities are given in Table 1. Parameters related to cellular activity are given in Table 2.
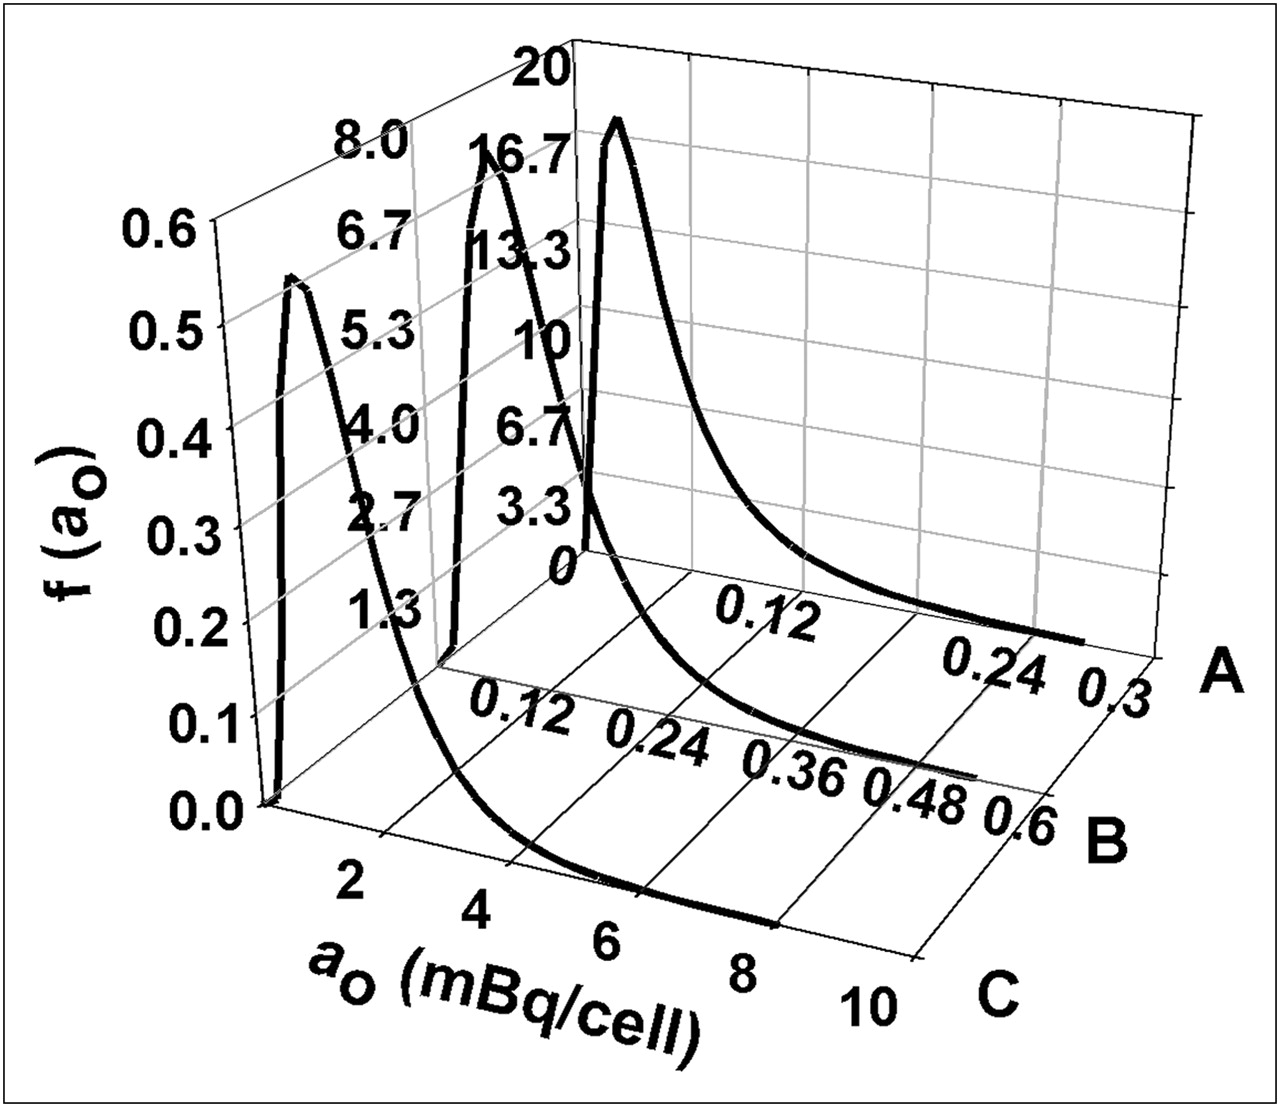
- FIGURE 5.
Log normal probability density function f(ao) vs. initial cellular activity ao for 3 different mean cellular activities <ao>: 0.054 mBq per cell (A), 0.12 mBq per cell (B), 1.8 mBq per cell (C). Probability density functions were obtained using Equation 9 and parameters μa and σ from Table 2.
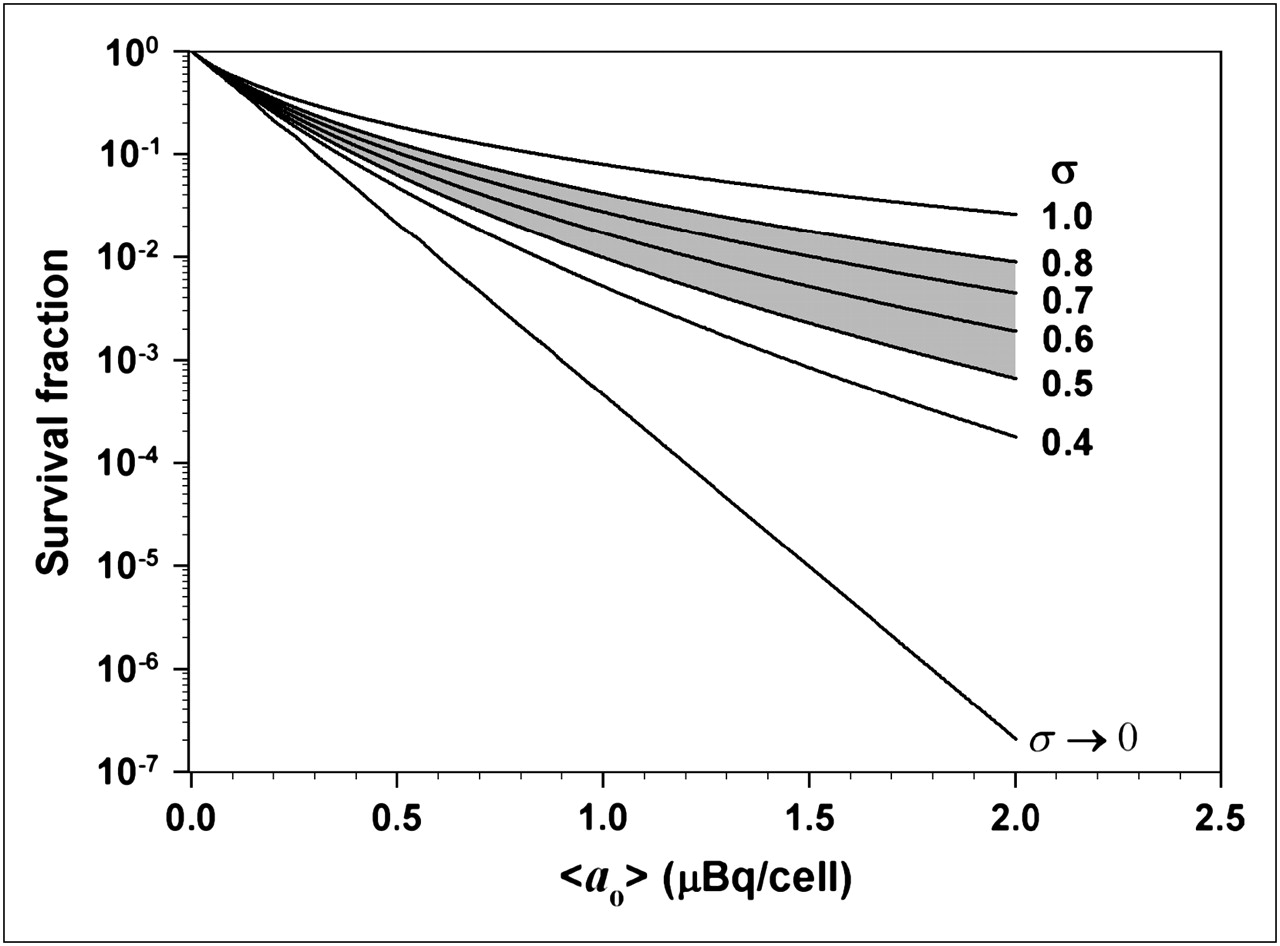
- FIGURE 6.
Calculated cell survival fraction (SF) vs. mean activity per cell <ao> assuming a log normal distribution of activity per cell. Survival fractions were calculated for different values of σ according to Equation 14. Shaded region represents range of σ values that were observed for various 210Po activities used in the present studies. Condition σ → 0 represents the case where all cells in the population contain the same activity (i.e., SF = exp(−<ao>/a37). Note profound impact that shape parameter σ has on survival curve.


Tables
- TABLE 1
Fitted Parameters and Statistical Quantities for Log Normal Convolved Track Distributions
Parameter Value Experiment A B C Labeling concentration (kBq/mL)* 0.52 ± 0.051 3.8 ± 0.36 67 ± 6.6 Mean cellular activity <ao> (mBq/cell)* 0.054 ± 0.0037 0.12 ± 0.011 1.8 ± 0.22 Maximum time of emulsion exposure (d) 52 4 1 Scale parameter (μN)† 1.6 ± 0.072 1.8 ± 0.027 1.8 ± 0.031 Shape parameter (σ)† 0.80 ± 0.056 0.59 ± 0.023 0.54 ± 0.029 Goodness of fit (R2) 0.92 0.98 0.97 Arithmetic mean <N> (convolved tracks/cell)‡ 7.1 ± 0.63 6.9 ± 0.22 6.7 ± 0.25 Median (convolved tracks/cell)‡ 5.2 ± 0.37 5.8 ± 0.16 5.8 ± 0.18 Mode (convolved tracks/cell)‡ 2.7 ± 0.31 4.2 ± 0.16 4.3 ± 0.19 Variance‡ 45 ± 13 20 ± 2.3 15 ± 2.3 Skewness‡ 3.7 ± 0.51 2.2 ± 0.12 1.9 ± 0.14 Kurtosis‡ 34 ± 10 12 ± 1.2 10 ± 1.2 Coefficient of variation (CV) 0.94 0.64 0.58 Cumulative probability for 1−9 tracks (%) 74 77 79 Cumulative probability for 10−40 tracks (%) 20 18 15 Cumulative probability for <1 track (%) 2.0 0.13 0.053 - TABLE 2
Fitted Parameters and Statistical Quantities for Log Normal Activity Distributions
Parameter Value Experiment A B C Labeling concentration (kBq/mL)* 0.52 ± 0.051 3.8 ± 0.36 67 ± 6.6 Mean cellular activity <ao> (mBq/cell)* 0.054 ± 0.0037 0.12 ± 0.011 1.8 ± 0.22 Scale parameter (μa)† −3.2 ± 0.11 −2.3 ± 0.028 0.43 ± 0.029 Shape parameter (σ)† 0.80 ± 0.056 0.59 ± 0.023 0.52 ± 0.026 Arithmetic mean (ao) (mBq/cell)‡ 0.054 ± 0.0066 0.12 ± 0.0041 1.8 ± 0.062 Median (mBq/cell)‡ 0.039 ± 0.0041 0.11 ± 0.0029 1.5 ± 0.046 Mode (mBq/cell)‡ 0.021 ± 0.0032 0.074 ± 0.0029 1.2 ± 0.047 ↵* †‡Errors are obtained as described in Table 1.


Jump to section
Related Articles
Cited By...
- The Emission of Internal Conversion Electrons Rather Than Auger Electrons Increased the Nucleus-Absorbed Dose for 161Tb Compared with 177Lu with a Higher Dose Response for [161Tb]Tb-DOTA-LM3 Than for [161Tb]Tb-DOTATATE
- Radium-223-Induced Bystander Effects Cause DNA Damage and Apoptosis in Disseminated Tumor Cells in Bone Marrow
- The Advantage of Antibody Cocktails for Targeted Alpha Therapy Depends on Specific Activity
- Ex Vivo Activity Quantification in Micrometastases at the Cellular Scale Using the {alpha}-Camera Technique
- Cell-Level Dosimetry and Biologic Response Modeling of Heterogeneously Distributed Radionuclides: A Step Forward
- Lognormal Distribution of Cellular Uptake of Radioactivity: Monte Carlo Simulation of Irradiation and Cell Killing in 3-Dimensional Populations in Carbon Scaffolds
- Changes in Lognormal Shape Parameter Guide Design of Patient-Specific Radiochemotherapy Cocktails
- Lognormal Distribution of Cellular Uptake of Radiopharmaceuticals: Implications for Biologic Response in Cancer Treatment
- The {alpha}-Camera: A Quantitative Digital Autoradiography Technique Using a Charge-Coupled Device for Ex Vivo High-Resolution Bioimaging of {alpha}-Particles
- MIRD Pamphlet No. 22 (Abridged): Radiobiology and Dosimetry of {alpha}-Particle Emitters for Targeted Radionuclide Therapy
- Lognormal Distribution of Cellular Uptake of Radioactivity: Statistical Analysis of {alpha}-Particle Track Autoradiography
- Further Explorations of Cellular Uptake of Radioactivity
- Reply: Log Normal Distribution of Cellular Uptake of Radioactivity
- Log Normal Distribution of Cellular Uptake of Radioactivity