


Abstract
It remains unclear how different translocator protein (TSPO) ligands reflect the spatial extent of astrocyte or microglial activation in various neuroinflammatory conditions. Here, we use a reproducible lipopolysaccharide (LPS)-induced model of acute central nervous system inflammation to compare the binding performance of a new TSPO ligand 18F-GE-180 with 11C-(R)-PK11195. Using immunohistochemistry, we also explore the ability of the TSPO ligands to detect activated microglial cells and astrocytes. Methods: Lewis rats (n = 30) were microinjected with LPS (1 or 10 μg) or saline (1 μL) into the left striatum. The animals were imaged in vivo at 16 h after the injection using PET radiotracers 18F-GE-180 or 11C-(R)-PK11195 (n = 3 in each group) and were killed afterward for autoradiography of the brain. Immunohistochemical assessment of OX-42 and glial fibrillary acidic protein (GFAP) was performed to identify activated microglial cells and reactive astrocytes. Results: In vivo PET imaging revealed an increase in the ipsilateral TSPO binding, compared with binding in the contralateral hemisphere, after the microinjection of 10 μg of LPS. No increase was observed with vehicle. By autoradiography, the TSPO radiotracer binding potential in the injected hemisphere was increased after striatal injection of 1 or 10 μg of LPS. However, the significant increase was observed only when using 18F-GE-180. The area of CD11b-expressing microglial cells extended beyond that of enhanced GFAP staining and mapped more closely to the extent of 18F-GE-180 binding than to 11C-(R)-PK11195 binding. The signal from either PET ligand was significantly increased in regions of increased GFAP immunoreactivity and OX-42 colocalization, meaning that the presence of both activated microglia and astrocytes in a given area leads to increased binding of the TSPO radiotracers. Conclusion: 18F-GE-180 is able to reveal sites of activated microglia in both gray and white matter. However, the signal is increased by the presence of activated astrocytes. Therefore, 18F-GE-180 is a promising new fluorinated longer-half-life tracer that reveals the presence of activated microglia in a manner that is superior to 11C-(R)-PK11195 due to the higher binding potential observed for this ligand.
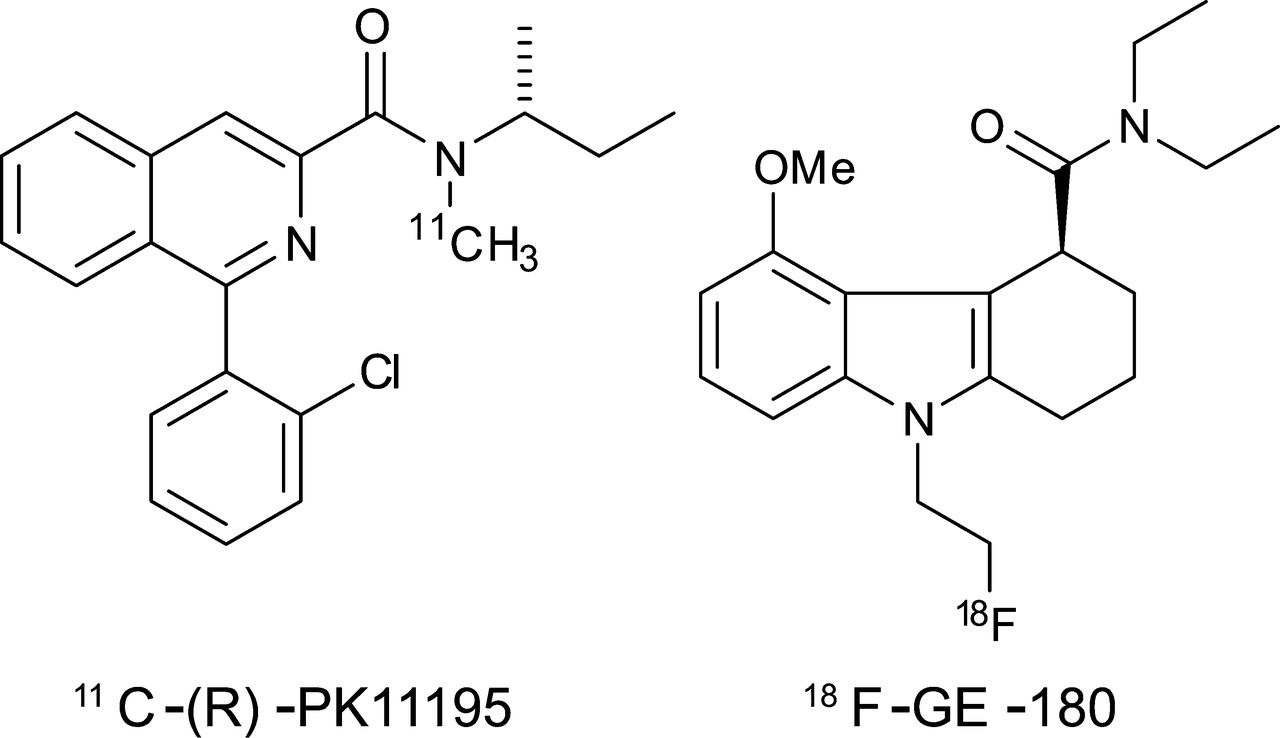
There is an unmet need for imaging agents that reveal the spatial extent of inflammation in the brain (1,2). The peripheral benzodiazepine receptor, now known as the 18-kDa translocator protein (TSPO), is a cholesterol-transporter protein expressed in the membrane of mitochondria of cells throughout the body (3). The basal expression of TSPO within the brain is low; however, its expression on microglial cells and on astrocytes increases after brain injury and inflammation (4). Because of this expression profile, TSPO has been suggested as a surrogate marker for neuroinflammation (5). The first TSPO PET radiotracer developed was the 11C-labeled tracer 11C-(R)-PK11195 (11C-N-methyl-N-[1-methylpropyl]-1-[2-chlorophenyl]-isoquinoline-3-carboxamide, Fig. 1), which has been used to image the increase in TSPO expression in vivo (6). However, there are several problems with 11C-(R)-PK11195 that have prevented it from being adopted widely in the clinic. The compound is highly lipophilic (logD7.4 [octanol-water distribution constant at pH 7.4] = 4.58), leading to binding to fatty structures within the brain. Thus, it has a poor signal-to-noise ratio and is not selective (7,8). The requirement of an on-site cyclotron also limits widespread use. To overcome these shortcomings, novel TSPO ligands have been developed (9). 18F-GE-180 (S-N,N-diethyl-9-[2-18F-fluoroethyl]-5-methoxy 2,3,4,9-tetrahydro-1H-carbazole-4-carboxamide, Fig. 1) is the lead compound from a new series of tricyclic indoles, which have been shown to have a high affinity for TSPO (10). According to a preliminary in vitro and biodistribution study, 18F-GE-180 has shown higher selectivity for TSPO than 11C-PK11195 (10). However, no direct comparison has been made of the relative sensitivities of these 2 different TSPO radiotracers in a proven model of neuroinflammation.

Chemical structures of the 2 radiotracers, 11C-(R)-PK11195 and 18F-GE-180.
Here, we sought to compare the binding of 18F-GE-180 with 11C-PK11195 in a model of neuroinflammation that involves the activation of both the microglia (11) and the astrocytes (12). Although the binding properties of several novel TSPO radiotracers have been reported in the literature (2,9), it is still unclear which cell populations are responsible for the TSPO binding in response to brain injury. Historically, the increase in TSPO expression was attributed to the activation of the microglia within the central nervous system (13). However, there is now growing evidence that reactive astrocytes also show an increase in TSPO binding after brain insult (2,14). The specificity of TSPO tracers needs to be explored to determine their suitability as surrogate markers for neuroinflammation. In this article, we have performed in vivo PET imaging using both 11C-(R)-PK11195 and 18F-GE-180 in conjunction with ex vivo autoradiography and immunohistochemistry. As such, we demonstrate the relationship between the extent of activation of both microglial cells and astrocytes assessed by immunohistochemistry and the area of binding of each TSPO ligand after autoradiography.
MATERIALS AND METHODS
Tracer Production
11C-(R)-PK11195 and 18F-GE-180 were synthesized according to methods first described by Hashimoto (15), Shah et al. (16), and Wadsworth et al. (10), with some modifications (the supplemental methods provide details; supplemental materials are available at http://jnm.snmjournals.org).
Animals
Adult male Lewis rats (3–4 mo, n = 30) were obtained from Harlan and housed in accordance with the Amsterdam protocol for animal experiments (17). The animals were divided randomly into 2 sets. Animals in set A (n = 18) were used for the ex vivo and in vitro autoradiography experiments. The animals in set B (n = 12) were used in the in vivo experiments (Supplemental Fig. 1). All animal experiments were performed with ethical approval from the Finnish Animal Experiment Board, application number ESAVI/6360/04.10.03/2011. Animals were anesthetized using isoflurane (Baxter Medical AB) at 3% in air or oxygen, and body temperature was maintained using an electronic heating blanket. During the procedure, anesthesia was maintained at 2.5% in air.
Intrastriatal Injection
The animals were injected intrastriatally with lipopolysaccharide (LPS) using the method previously described by Serres et al. (18) (the supplemental methods provide more details).
Digital Autoradiography
Rats from set A were killed for autoradiography analysis 16 h after the injection of LPS (n = 3 per group, groups consisted of rats injected with LPS [10 or 1 μg/μL] or saline). The digital autoradiography was performed as previously described by Forsback et al. (19) (the supplemental methods provide more details).
In Vitro Blocking Studies
Coronal brain sections (20 or 40 μm thick) from rats in set A were cryocut and preincubated for 30 min at room temperature in 50 mM Tris-HCl (pH 7.4 at 25°C) before incubation for 30 min with 11C-(R)-PK11195 (0.67 MBq, ∼50 pM) or 18F-GE-180 (0.42 MBq, ∼50 pM). The binding specificity for 11C-(R)-PK11195 or 18F-GE-180 was determined by the addition of the unlabeled GE-180 or PK11195 (90 nM), respectively. The sections were washed with ice-cold Tris-buffer and rinsed in ice-cold distilled water to remove buffer salts. The slides were dried under a stream of air at room temperature, exposed to the imaging plate and imaged as described above.
Autoradiography Data Analyses
Regions of interest (ROIs) were drawn in the left and right striatal and cortical areas on the images obtained from the autoradiography. The digital images were analyzed for count densities (photostimulated luminescence per unit area, PSL/mm2) with Aida 2D Analysis (Raytest Isotopenmessgeräte GmbH). To quantify the binding potential (BPex vivo) of the radiotracer, the following calculation was performed: Each result was averaged across the whole striatum to get an overall BPex vivo for each injected animal. To validate the use of the contralateral hemisphere as an appropriate reference region, the binding ratio (BR) of this area was calculated in each animal using an ROI drawn in the cerebellum as a reference region.
In Vivo Imaging
For the comparison between the 2 different radiotracers, the animals in set B (n = 3 for each group, 10 μg of LPS, 1 μg of LPS, and saline) were imaged 16 h after the intracerebral injection of LPS (the supplemental methods provide more details).
In Vivo Data Analysis
The PET data were analyzed as previously described by Farde et al. (20) with some modifications (supplemental methods). The following calculation was performed to determine the binding potential of the ligands:
Pixelwise Modeling of In Vivo Images
The dynamic datasets were aligned to a standard T2 MR imaging template with PMOD (PMOD Technologies Ltd.) using the inbuilt rigid body-matching tool in the fusion package. Spheric volumes of interest were once again placed in the contralateral hemisphere. These volumes of interest were used to perform the pixelwise calculation of the binding potential during the period of maximal binding (25–50 min). These calculations were performed in Matlab (R2011a; The MathWorks). Further manipulations of the resultant images (averaging and subtraction) were performed in Statistical Parametric Mapping version 8 (SPM 8; Wellcome Trust Centre for Neuroimaging).
Immunohistochemical Analysis
Fresh tissue from animals in set A were stained for OX-42 and glial fibrillary acidic protein (GFAP) as previously described (18) (supplemental methods).
To assess the extent of the microglial activation, the number of OX-42–positive cells in both the striatum and the cortex was counted. Three photomicrographs (area, 399.7 × 258.2 μm) from randomly chosen fields of view from bregma +1.0AP were obtained. The total cell count per mm2 was calculated for each field of view in a masked fashion and then averaged to obtain an average cell count per unit area. This average was then multiplied by the slice thickness for each brain region. This analysis was performed on animals imaged with 11C-(R)-PK11195 (10 μg of LPS, n = 3; 1 μg of LPS, n = 3; saline, n = 3) and 18F-GE-180 (10 μg of LPS, n = 3; 1 μg of LPS, n = 3; saline, n = 3).
Statistical Analysis
Prism (5.01; Graph Pad Software Inc.) was used for any statistical analysis and the outcome was considered significant if the P value was less than 0.05. Autoradiography and immunohistochemistry images were manually coregistered with Photoshop (CS4, Adobe) to resize and overlay the images using neuroanatomic landmarks such as the ventricles.
RESULTS
PK11195 and GE-180 were successfully labeled with the short-lived radioactive isotopes 11C and 18F, respectively, and this labeling was confirmed by radio–high-performance liquid chromatography (Fig. 1; more information is provided in the supplemental results).
Ex Vivo Autoradiography
The intrastriatal injection of LPS in set A animals caused widespread neuroinflammation in the injected hemisphere and activation of the microglia. This activation was observed by the uptake of both 11C-(R)-PK11195 and 18F-GE-180 in the images obtained from the digital autoradiography (Fig. 2A). Increased radiotracer binding was observed in animals injected with either 10 μg of LPS (Fig. 2A, BPex vivo = 0.76 ± 0.31 for 11C-PK11195 and 1.32 ± 0.13 for 18F-GE-180) or 1 μg of LPS (Fig. 2A, BPex vivo = 0.67 ± 0.30 for 11C-PK11195 and 1.33 ± 0.17 for 18F-GE-180) but not in animals injected with saline (Fig. 2A, BPex vivo = 0.05 ± 0.02 for 11C-PK11195 and 0.05 ± 0.01 for 18F-GE-180). In the animals injected with 10 μg of LPS, a halo of increased binding was observed around the injection site, which was not observed in animals injected with 1 μg of LPS.
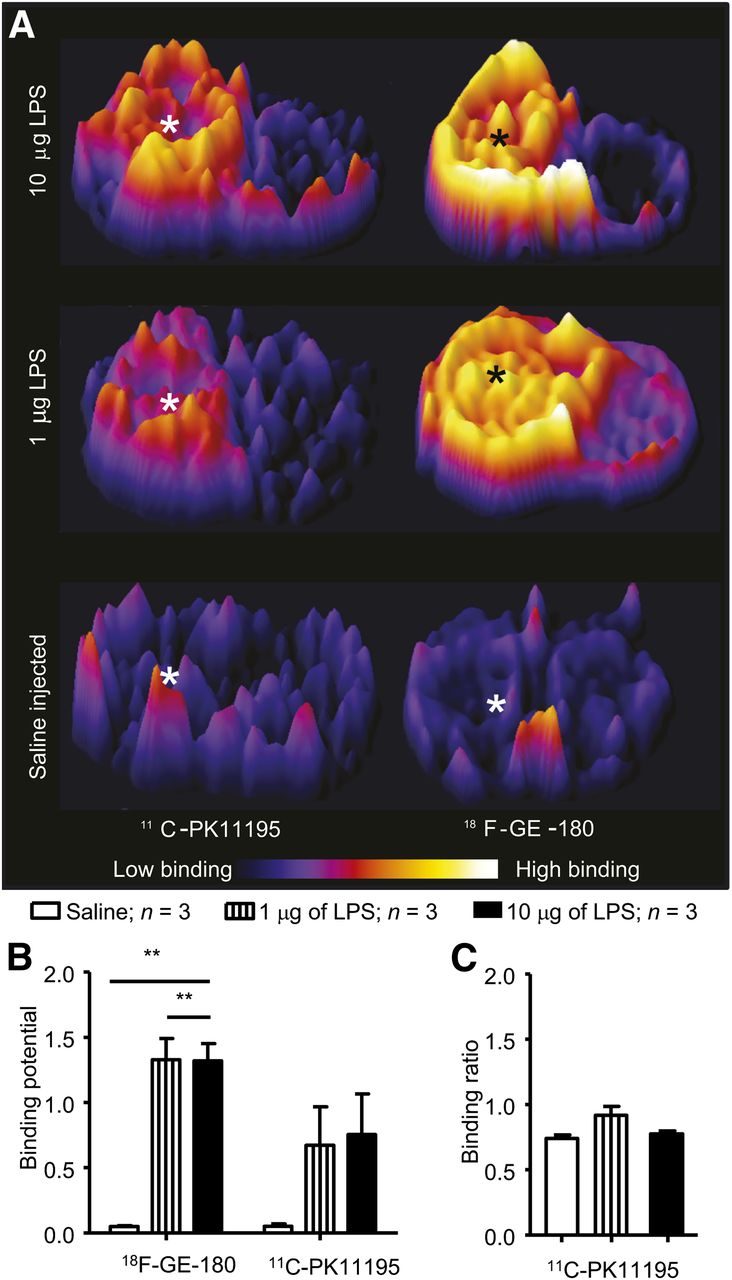
LPS causes unilateral upregulation of TSPO binding of 11C-(R)-PK11195 and 18F-GE-180. (A) Representative coronal striatal images obtained when animals were imaged with 11C-(R)-PK11195 or 18F-GE-180. * = injection site. (B) Autoradiography analysis reveals significant (**P < 0.01) increase in 18F-GE-180 binding after intracerebral injection of LPS (10 or 1 μg); similar significant increase was not observed with 11C-(R)-PK11195. Unprocessed images are shown in Supplemental Fig. 3C. There is no significant increase (P = 0.106) in signal in contralateral hemisphere, using cerebellum as reference region. Bars = SEM.
The repeated-measures ANOVA on the binding potentials obtained from the ROI analysis performed on the autoradiography images showed that there was a significant main effect of LPS treatment (F2,12 = 16.40, P = 0.0004). In addition, there was a significant main effect (F2,12 = 6.45, P = 0.0260) in which the binding potential of 18F-GE-180 was greater than that of 11C-(R)-PK11195 (Fig. 2B). When Bonferroni post hoc analysis was used, only the animals injected with LPS at either concentration, and imaged with 18F-GE-180, showed a significant increase in radiotracer binding in the ipsilateral hemisphere (P < 0.01), compared with the saline-injected group (Fig. 2B). To determine the use of the contralateral hemisphere as a reference region, we compared the BR between the contralateral striatum and the cerebellum between the different groups. There was no significant difference (P = 0.106) between brain regions distal to the LPS injection in the binding of 11C-(R)-PK11195 (10 μg, BR = 0.79 ± 0.04; 1 μg, BR = 0.92 ± 0.12) when compared with the saline control group (BR = 0.74 ± 0.04) (Fig. 2C).
Selectivity of Radiotracers
To assess whether 11C-(R)-PK11195 and 18F-GE-180 are binding to the same cell type within the central nervous system, we quantified the increase in expression of OX-42, a marker of activated microglia, which are considered to be the major source of TSPO binding in the central nervous system (5). Repeated-measures ANOVA analysis performed on the counts of OX-42–positive cells demonstrated that there was a significant main effect of LPS treatment in both the striatum (F2,18 = 146.725, P < 0.0001, Fig. 3A) and the cortex (F2,18 = 269.86, P < 0.0001, Fig. 3A). In the striatum, there was no difference observed between the groups imaged with 11C-(R)-PK11195 or 18F-GE-180 (P = 0.179). However, in the cortex there was a significant main effect of LPS treatment observed between the groups imaged with 11C-(R)-PK11195 or 18F-GE-180 (F1,18 = 9.086, P = 0.011, Fig. 3A) (P = 0.02). Bonferroni post hoc analysis revealed that, in the striatum there was a highly significant increase in OX-42–positive cells after an injection of LPS (10 or 1 μg, P < 0.0001, Fig. 3A). However, there was no significant difference between the animals injected with 10 μg of LPS, compared with the animals injected with 1 μg of LPS (P = 1). In the cortex, post hoc analysis demonstrated that the injection of LPS (10 or 1 μg) caused a highly significant increase in OX-42–positive cells (P < 0.0001). In addition to this, there was also a significant increase in OX-42–positive cells after an injection of 10 μg of LPS, compared with an injection of 1 μg of LPS (P < 0.0001). After an injection of LPS into the left striatum, there was also a statistically significant difference between the number of OX-42–positive cells in the injected hemisphere, compared with the contralateral hemisphere (data not shown, P < 0.0001). In vitro blocking studies revealed a reduction in specific binding of both 11C-(R)-PK11195 and 18F-GE-180 when either was blocked by the corresponding nonradioactive tracer (Fig. 3B). Analysis of the ROI means showed a significant reduction (Student t test, P < 0.0001) in the binding potential when 11C-(R)-PK11195 was blocked with nonradioactive GE-180 (Fig. 3C). A similar significant reduction (Student t test, P < 0.0005) was observed in the binding potential when 18F-GE-180 was blocked with nonradioactive PK11195 (Fig. 3C). To confirm that the administration of tracer had no impact on the histopathology, we counted the number of OX-42–positive cells. In the striatum, there was no significant difference in the number of OX-42–positive cells in the animals imaged with 18F-GE-180 or 11C-(R)-PK11195. There was a small increase in OX-42–positive cells in the cortex in the 11C-(R)-PK11195 group, compared with animals imaged with 18F-GE-180 (Fig. 3A), but the binding potential was decreased in the 11C-(R)-PK11195 group, further highlighting the improved imaging with 18F-GE-180.

Selectivity of 11C-(R)-PK11195 and 18F-GE-180. (A) Intracerebral injection of LPS causes significant increase in OX-42–positive cells in striatum and cortex in injected hemisphere (P < 0.0001) when compared with control group. There was no significant difference between animals imaged with 18F-GE-180, compared with 11C-(R)-PK11195, or animals injected with 10 μg of LPS, compared with 1 μg. ***P < 0.0001. 11C-(R)-PK11195 and 18F-GE-180 bind specifically to same target in vitro. (B) Representative in vitro autoradiography images from coronal striatal sections demonstrating total binding of 11C-(R)-PK11195 and 18F-GE-180 and reduction in signal when 11C-(R)-PK11195 signal was blocked by GE-180 or vice versa. (C) GE-180 significantly reduces (P < 0.0001) specific signal observed when using 11C-(R)-PK11195 to image the increase in TSPO expression. Correspondingly, (R)-PK11195 significantly (P < 0.0001) reduces specific signal observed when using 18F-GE-180 as radiotracer. Bars = SEM.
Specificity of Radiotracers
To determine the specificity of the 2 radiotracers, we compared the areas of OX-42 staining (Fig. 4) and increased GFAP immunoreactivity (Fig. 4) to the extent of binding observed in the autoradiography. The area of microglial activation corresponded to the area of increased binding observed in the autoradiography for both 18F-GE-180 (Fig. 4) and 11C-(R)-PK11195 (data not shown). There was no corresponding increase in microglial activation observed in the contralateral hemisphere or the animals injected with saline (data not shown). There was also a smaller area of increased expression of GFAP (Fig. 4). Where there was an increase in immunoreactivity of GFAP, there was a corresponding increase in the signal from the autoradiography (Fig. 4).
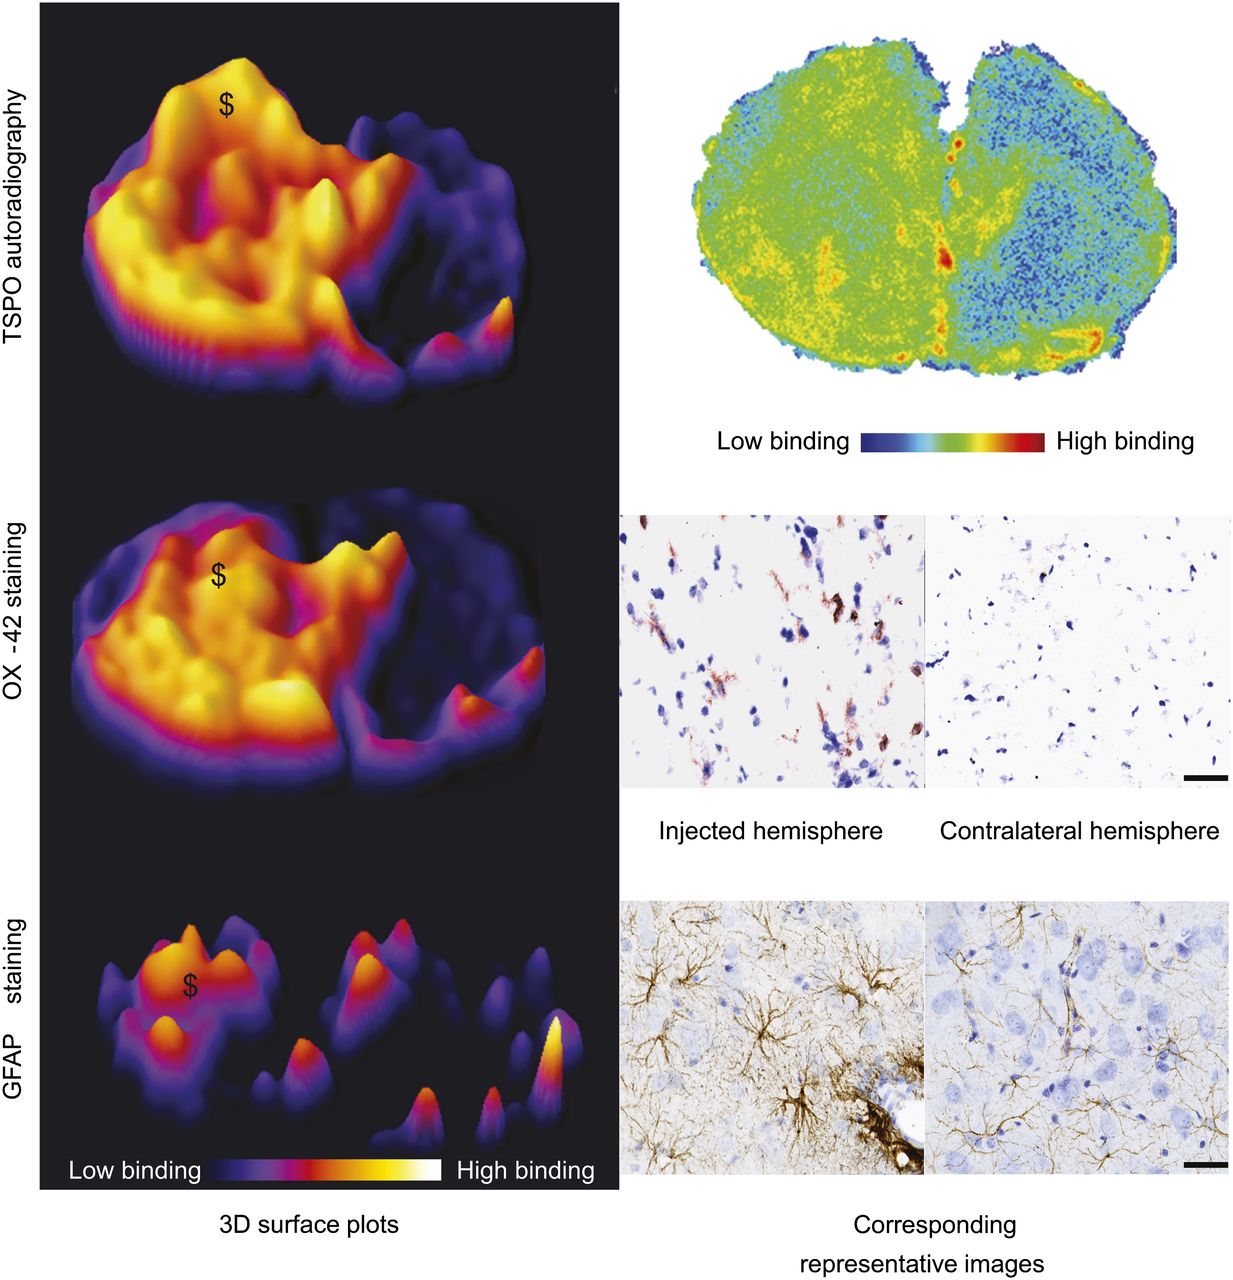
Specificity studies; histologic comparison to autoradiography results. (Left) Three-dimensional surface plots demonstrate area of increased signal observed in autoradiography from animals imaged with 18F-GE-180 and increase in OX-42 and GFAP immunoreactivity in sequential sections. (Right) Shown are corresponding images or high powered photomicrographs from injection site obtained from 18F-GE-180 autoradiography, OX-42 (activated microglia), and GFAP (astrocytes) staining. $ marks increase in autoradiography signal where there is corresponding area of OX-42–positive cells and increased GFAP immunoreactivity. Scale bar = 50 μm.
In Vivo Imaging
From the in vivo PET images, of the animals in set B, it was possible to observe an increased binding of both 11C-(R)-PK11195 and 18F-GE-180 in the injected striatum (Figs. 5A and 5B). The binding potential (BPin vivo) was calculated over the time of maximal binding (25–50 min, supplemental results and Supplemental Fig. 2). The BPin vivo analysis revealed a significant increase (F4 = 58.08, P < 0.001) in the animals injected with 10 μg of LPS (BPin vivo = 0.47 ± 0.06 for 11C-PK11195 and 0.92 ± 0.07 for 18F-GE-180), compared with the animals injected with saline (BPin vivo = 0.00 ± 0.07 for 11C-PK11195 and 0.00 ± 0.01 for 18F-GE-180, Fig. 5C). There was also a significant increase (P < 0.01) in the BPin vivo from the animals injected with 10 μg of LPS when the images were acquired with 18F-GE-180, compared with those acquired with 11C-(R)-PK11195 (Fig. 5C). From the 3-dimensional pixelwise modeling, the area of 18F-GE-180 binding was increased, compared with 11C-(R)-PK11195 (Figs. 5A and 5B).
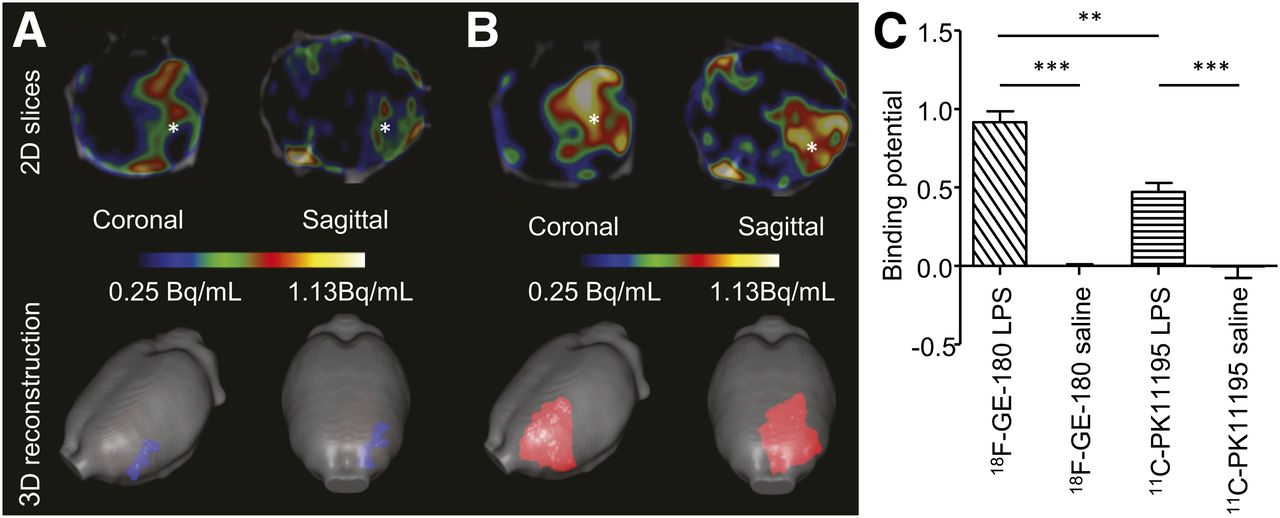
Radiotracer 18F-GE-180 is superior to 11C-(R)-PK11195 in detection of TSPO upregulation after brain injury. (A) Averaged (n = 3) normalized (bound-to-free pixelwise modeling) images from animals imaged in vivo with 11C-(R)-PK11195. (B) Corresponding images using 18F-GE-180. PET/CT 2-dimensional slices at level of striatum show increase in signal at site of injury (shown by *). 3-dimensional reconstruction demonstrates greater area, which can be segmented when imaging is performed with 18F-GE-180. (C) Quantification of binding demonstrates that there is significant increase in binding of both 11C-(R)-PK11195 (P < 0.0001) and 18F-GE180 (P < 0.0001) after injection of LPS (10 μg) into left striatum, compared with animals injected with saline. There is significantly (P < 0.01) higher binding of 18F-GE-180, compared with 11C-(R)-PK11195 in animals injected with LPS (10 μg). Bars = SEM.
DISCUSSION
Data presented here demonstrate for the first time that the novel radiotracer 18F-GE-180 is superior to 11C-(R)-PK11195 in detecting in vivo glial activation in our rodent model of neuroinflammation. The superiority of the tracer was apparent both in ex vivo and in vivo imaging techniques, for which 18F-GE-180 had a statistically significant higher binding potential when compared with 11C-(R)-PK11195. The area of TSPO binding colocalized with the area of microglial activation after an intrastriatal injection of LPS. However, the intensity of the TSPO signal increased in the presence of both activated microglial cells and reactive astrocytes.
We used an intrastriatal injection of LPS to induce unilateral acute inflammation and glial activation within the rodent brain, which provides a reliable and reproducible inflammatory response throughout adulthood (21). The main benefit of the model used in this paper is that it causes a unilateral inflammatory response, permitting an internal control for the PET modeling and avoiding the need for serial blood sampling, which would be required if no reference region was available (22). In addition to this, high binding of both tracers within the myocardium prevents the use of the left ventricle as an internal blood input function (23).
Several other models have been used to compare TSPO ligands (9). The intrastriatal injection of α-amino-3-hydroxy-5-methyl-4-isoxazolepropionic has been used in several studies (24–26) and was used primarily to study the effect of excitotoxity on glial activation (27). The pathology is associated with considerable cell death (28), which could be considered a confound, and maximal activation of the microglia and astrocytes occurs after 7 d (26). The LPS injection does not cause any significant cell death (11). LPS, on binding to LPS binding protein and CD14, quickly activates the immune system via toll-like receptor 4 (29) and the NFκB pathway (30) to induce an M1 phenotype (31). This model has also been used in the past to show the different binding characteristics of TSPO ligands (32) and has the advantage over the α-amino-3-hydroxy-5-methyl-4-isoxazolepropionic model that the animals can be imaged at a much earlier time point and it does not induce overt clinical signs.
We also observed an area of increased GFAP immunoreactivity after the LPS injection. The area of increased immunoreactivity of GFAP varied in the model but was always considerably smaller than the area of OX-42 activation. It has been suggested that it takes longer for astrocytes to become fully activated after brain injury, but TSPO ligands do display increased binding to activated astrocytes (33), and to fully probe the interaction of astrocytes with the TSPO ligands imaging at a later time point, such as at 3–7 d, might be useful. However, the results presented here suggest that the TSPO signal is the sum total of the increase in TSPO expression in both the microglia and the astrocytes where the binding coincides. This does not diminish the use of TSPO as a surrogate marker of neuroinflammation where the activation of both populations is usual. However, attributing the signal to one specific cell type must be done with caution.
In addition to the increase in TSPO expression observed in the presence of both activated microglia and astrocytes, there was binding of the radiotracers in the ventricular area and the olfactory bulbs, even in the saline-injected animals, suggesting that the tracer is binding to further cell types in these areas. This fact has previously been used to validate TSPO tracers in healthy animals (10). Previously, it has been reported that the TSPO protein is also expressed in the ependymal cells (34) and cells within the choroid plexus (9,35). Additionally, the binding in the olfactory bulbs in rodents has previously been observed (36). The causes for this binding remain unclear, with several reports suggesting that neuronal cells in this brain region express TSPO in neo-natal rats (35) and humans (37). It has been suggested that there is an activation of the microglial cells thought to be caused by the replacement of the granular and periglomerular neurons from the subventricular zone (38). It has been shown that experimental autoimmune encephalomyelitis enhances this cellular migration and can be seen by an increase in TSPO binding (39).
CONCLUSION
This study reveals that 18F-GE-180 is a promising new PET radiotracer for imaging the increase in TSPO expression in response to neuroinflammation. 18F-GE-180 performed significantly better than the current gold standard 11C-(R)-PK11195 radiotracer for imaging this target by displaying improved binding potentials both ex vivo and in vivo.
DISCLOSURE
The costs of publication of this article were defrayed in part by the payment of page charges. Therefore, and solely to indicate this fact, this article is hereby marked “advertisement” in accordance with 18 USC section 1734. This study is funded in part by the Academy of Finland; Biocentre Finland; GE Healthcare, Ltd.; and European Union's Seventh Framework Program (FP7/2007-2013) under grant agreement HEALTH-F2-2011-278850 (INMiND). No other potential conflict of interest relevant to this article was reported.
Acknowledgments
We thank Elisa Riuttala, Markko Vehmanen, and Merja Tuomas from the Turku PET Centre for their assistance. We also thank the staff of the radiopharmaceutical chemistry laboratory at the Turku PET Centre.
Footnotes
Published online Feb. 10, 2014.
- © 2014 by the Society of Nuclear Medicine and Molecular Imaging, Inc.
REFERENCES
- Received for publication May 31, 2013.
- Accepted for publication October 24, 2013.


Jump to section
Related Articles
Cited By...
- Pre-therapeutic Microglia Activation and Sex Determine Therapy Effects of Chronic Immunomodulation
- Nondisplaceable Binding Is a Potential Confounding Factor in 11C-PBR28 Translocator Protein PET Studies
- Sexually dimorphic responses to MPTP found in microglia, inflammation and gut microbiota in a progressive monkey model of Parkinsons disease
- PET imaging of microglia by targeting macrophage colony-stimulating factor 1 receptor (CSF1R)
- Imaging microglial activation in tacrolimus-associated CNS vasculitis with translocator protein PET
- Head-to-Head Comparison of 11C-PBR28 and 18F-GE180 for Quantification of the Translocator Protein in the Human Brain
- Neuroinflammation Appears Early on PET Imaging and Then Plateaus in a Mouse Model of Alzheimer Disease
- The FTD-like syndrome causing TREM2 T66M mutation impairs microglia function, brain perfusion, and glucose metabolism
- Flutriciclamide (18F-GE180) PET: First-in-Human PET Study of Novel Third-Generation In Vivo Marker of Human Translocator Protein
- Serial Quantitative TSPO-Targeted PET Reveals Peak Microglial Activation up to 2 Weeks After an Epileptogenic Brain Insult
- Glial Activation and Glucose Metabolism in a Transgenic Amyloid Mouse Model: A Triple-Tracer PET Study
- In Vivo Detection of Age- and Disease-Related Increases in Neuroinflammation by 18F-GE180 TSPO MicroPET Imaging in Wild-Type and Alzheimer's Transgenic Mice
- In Vivo PET Imaging Demonstrates Diminished Microglial Activation After Fingolimod Treatment in an Animal Model of Multiple Sclerosis