


Abstract
18F-GE180 is a third-generation PET tracer for quantifying the translocator protein (TSPO), a biomarker for inflammation. The aim of this study was to perform a head-to-head comparison of 18F-GE180 and the well-established TSPO tracer 11C-PBR28 by scanning with both tracers during the same day in the same subjects. Methods: Five subjects underwent a 90-min PET scan with 11C-PBR28 in the morning and 18F-GE180 in the afternoon. A metabolite-corrected arterial input function was obtained in each subject for both tracers, and the brain uptake was quantified with a 2-tissue-compartment model. Results: The rate of metabolism of 18F-GE180 in arterial blood was slower than that of 11C-PBR28 (the percentages of nonmetabolized parent in plasma at 90 min were 74.9% ± 4.15% [mean ± SD] and 11.2% ± 1.90%, respectively). The plasma free fractions were similar for both tracers: 3.5% ± 1.1% for 18F-GE180 and 4.1% ± 1.1% for 11C-PBR28. The average total volume of distribution (VT) of 18F-GE180 was about 20 times smaller than that of 11C-PBR28 (0.15 ± 0.03 mL/cm3 for 18F-GE180 and 3.27 ± 0.66 mL/cm3 for 11C-PBR28). 18F-GE180 was characterized by poor transfer from the vascular compartment to the brain (its plasma-to-tissue rate constant [K1] was about 10 times smaller than that of 11C-PBR28). Moreover, kinetic modeling was more difficult with 18F-GE180, as its VT values were identified with a lower precision than those of 11C-PBR28 and outlying values were more frequent. Conclusion: The VT of 18F-GE180 was about 20 times smaller than that of 11C-PBR28 because of low penetration into the brain from the vascular compartment. In addition, kinetic modeling of 18F-GE180 was more challenging than that of 11C-PBR28. Therefore, compared with 11C-PBR28, 18F-GE180 had unfavorable characteristics for TSPO imaging of the brain.
The 18-kDa mitochondrial translocator protein (TSPO) is overexpressed in activated microglia in response to a variety of insults, such as tumors, physical injuries, and strokes, as well as neurodegenerative and psychiatric conditions (1–3). Therefore, TSPO is commonly used as a biomarker for imaging and quantifying glial activation with PET.
However, TSPO imaging with PET is a challenging task, especially from a logistic point of view. TSPO is expressed in all brain regions, and—except for well-defined clinical situations in which a pseudoreference region has been carefully validated for the disease under study (4,5)—quantification requires serial blood sampling from an artery (6). Another logistic problem is that subjects must have a genotype analysis before the scan, because a single-nucleotide polymorphism (rs6971) affects the affinity of the TSPO radioligand for the receptor (7). This polymorphism can be used to separate subjects into 3 groups: those with high-, mixed-, and low-affinity binding. In those with low-affinity binding—representing about 5%–10% of the white population—TSPO radioligands generally are not bound with sufficient affinity to allow for imaging, and the difference in affinity for the other 2 groups needs to be considered to increase the statistical power of a study (8).
Also, TSPO ligands do not all perform equally well. The prototypical TSPO radioligand, 11C-(R)-PK11195, has high lipophilicity and low specific binding (9). In recent years, several new radioligands with higher binding potential have been synthesized (10). For instance, the binding potential of 11C-DPA-713 in humans is about 10 times higher than that of 11C-(R)-PK11195 (11). The affinity in vitro of PBR28 for high-affinity binders is also about 10 times the affinity of PK11195 (12), and this translates into better in vivo imaging characteristics for 11C-PBR28 than for 11C-(R)-PK11195 in rodents (13), monkeys, and humans (9).
However, quantification using ligands with a higher affinity has brought about another challenge. As immunohistochemical studies have shown, the density of TSPO is higher at the vessel walls of the blood–brain barrier than in brain tissue (14). Because of this heterogeneous distribution, the signal from the endothelium is disproportionately higher than the signal in the tissue (1). For proper accounting of endothelial uptake, an additional trapping compartment has been added to the compartmental model (15,16).
In quest of new radioligands with better properties, a novel tricyclic indole series of TSPO ligands was recently developed. The best compound of the series, 18F-GE180, displayed high affinity, good brain uptake, and high specific binding in a neuroinflammation model (17). This tracer was further tested in preclinical models of inflammation and proved to be superior to 11C-(R)-PK11195 (18–20). In humans, 18F-GE180 was amenable to quantification with compartmental modeling and Logan graphical analysis but showed unexpectedly low brain uptake (21,22).
The aim of this study was to perform a head-to-head comparison of 18F-GE180 and a well-established second-generation TSPO tracer, 11C-PBR28, by scanning with both tracers during the same day in the same subjects.
MATERIALS AND METHODS
Radiosynthesis
18F-GE180 was manufactured in accordance with published procedures (17) but with slight modifications using a GE Healthcare FASTlab synthesizer unit under U.S. Food and Drug Administration (FDA)–approved Drug Master File (21995). In brief, an 18F-fluoride solution with K222 (KRYPTOFIX; Millipore Sigma) and potassium bicarbonate was dried under azeotropic conditions, and radiolabeling was performed at 100°C for 6 min in an acetonitrile solution. The radiolabeled product was trapped on the C18 cartridges (Waters), and the impurities were removed with 20 mL of 40% (v/v) ethanol followed by 11.5 mL of 35% (v/v) ethanol solution. The radiolabeled product (18F-GE180) in the solid phase extraction cartridges was eluted into a formulation buffer vial using 55% (v/v) ethanol. The diluted product was collected through a 0.22-μm filter. Total synthesis time was about 44 min, the specific radioactivity was 250 ± 101 (mean ± SD) GBq/μmol (n = 5), and the yield was 22.0 ± 11.8 GBq (n = 5).
11C-PBR28 was manufactured in accordance with published procedures (23) but with slight modifications using GE Healthcare TRACERlab FX-MEI and FX-M modules. In brief, the 11C-CH3I from TRACERlab FX-M was passed through a silver triflate (mixed with Carbopack; Millipore Sigma) oven (395°F) to make 11C-methyltriflate. The phenolic precursor (∼1 mg dissolved in 200 μL of acetonitrile) was labeled with the 11C-methyltriflate in a reaction vessel under basic conditions (sodium hydride, 1–1.3 μg) at 35°C for 3 min. The crude product was purified by preparative high-performance liquid chromatography with a mobile phase of methanol and 26.3 mM aqueous ammonium formate (62:38, v/v) at a flow rate of 5.5 mL/min. The correct fraction was collected into a reservoir that had been prefilled with 50 mL of water. The mixed solution was passed through a C18 Light cartridge (Waters), in which PBR28 was trapped and eluted with 1 mL of ethanol followed by 9 mL of saline. The solution was transferred to the final product vial through a sterile 0.22-μm filter (Millex GV; Millipore Sigma). The total synthesis time was about 45 min, the specific radioactivity was 414 ± 94 GBq/μmol (n = 5), and the yield was 4.1 ± 1.6 GBq (n = 5).
Subjects
Five subjects (3 men and 2 women; 50.6 ± 17.6 y old) participated in the study. Four were healthy volunteers, and 1 was a patient with amyotrophic lateral sclerosis. Four subjects had mixed-affinity binding for TSPO radioligands, and 1 subject (a healthy control) had high-affinity binding. Healthy subjects were free of current medical and psychiatric disorders, as determined by physical examination, laboratory urine and blood tests (including blood count and serum chemistry), and electrocardiogram. The vital signs of each subject were recorded before tracer injection and after completion of the scan. All subjects had signed a written consent form for the study; the consent form had been approved by the local institutional review board.
Brain Imaging
PET images were acquired with a Philips Gemini TF 64 scanner. Subjects lay on the bed scanner with the head firmly held by a thermoplastic pillow and mask. After a CT scan of the head acquired for attenuation correction, the subjects were injected in the morning with 11C-PBR28 at 622 ± 122 MBq and in the afternoon with 18F-GE180 at 178 ± 16 MBq using an automated pump. The 2 injections were at least 3 h apart to allow for 11C decay and biologic removal. For both tracers, a dynamic scan was started at the moment of injection and stopped 90 min later. Each subject underwent T1-weighted structural MRI for PET image coregistration. MRI was performed using a 3-dimensional magnetization-prepared rapid gradient-echo pulse sequence with an echo time of 3.04 ms, a repetition time of 7.648 ms, an inversion time of 900 ms, and a flip angle of 8° on a 3-T whole-body scanner (Discovery; GE Healthcare) with a Nova 32-channel phased-array head coil. The frames of the PET dynamic scans were first realigned and then coregistered with the structural MRI scans. Using the automated anatomical labeling–merged atlas implemented in the PNEURO module of PMOD 3.8 (PMOD Technologies), 71 brain regions were defined for each subject, and a time–activity curve was obtained for each region. The brain time–activity curves were converted into SUVs by normalizing the activity concentration for the injected activity and body weight.
Measurement of Input Functions
Arterial blood samples for the PET scans performed with each tracer were drawn manually from the same catheter. For 11C-PBR28, 24 blood samples (whose volumes ranged from 1.5 to 6 mL) were drawn, initially every 15 s, and then at 4, 5, 6, 8, 10, 15, 20, 30, 40, 50, 60, 75, and 90 min. Each sample was centrifuged to separate the plasma from the blood cells, and the plasma was analyzed by high-performance liquid chromatography to separate the concentration of the parent from those of the radiometabolites. Chromatography was performed on the sample acquired at 5 min and then on all samples acquired from 10 min to the end of the scan. For 18F-GE180, 23–25 samples were drawn at volumes ranging from 1.5 to 3 mL. The sampling schedule was similar to that for 11C-PBR28, and chromatography was performed on at least 6 plasma samples per subject.
The measured fractions of the parent were fitted with an extended Hill function (24), expressed as:
The fraction of the parent was then multiplied by the total plasma activity to obtain the time–activity curves of the parent concentrations for both tracers. These curves were fitted with a triexponential function after relative weighting. The radioactivity concentration in whole blood was used to correct the brain activity that was due to the vascular compartment.
Finally, the plasma free fraction (fP) was measured in duplicate for both tracers by ultrafiltration (25) and normalized using a standard derived from donor plasma.
Kinetic Modeling
For both tracers, the input functions were fitted to the brain time–activity curves using a 2-tissue-compartment model (2TCM). Brain data were weighted by assuming that the SD of the data was proportional to the inverse square root of the counts in the whole gray matter. The delay between the arrival of the tracers in the brain and their arrival in the radial artery was considered by fitting the whole gray matter.
We evaluated 3 variants of the 2TCM: a model in which the cerebral blood volume was assumed to constitute 5% of the total brain volume (2TCM_fix), a model in which the blood volume (VB) was estimated along with the other microparameters (2TCM_VB), and a model in which an additional irreversible compartment took into account the trapping in the vascular walls (16). The models were compared statistically with the Akaike Information Criterion (26), according to which the model with the smallest value is the one that provides the best fit. Both tracers were also quantified using a Logan graphical analysis, with t* fixed at 30 min.
RESULTS
Plasma Input Functions
11C-PBR28 concentrations peaked in plasma about 1–1.5 min after injection, with an SUV of 18.0 ± 5.65, and then progressively decreased (the average SUV at 60 min was 0.19 ± 0.02) (Fig. 1A). 18F-GE180 concentrations peaked at about the same time, with an SUV of 35.4 ± 5.03, and decreased to 2.81 ± 0.19 at 60 min (Fig. 1B). The metabolism rate was much faster for 11C-PBR28 than for 18F-GE180; at 60 min, the percentages of nonmetabolized parent in plasma were 11.2% ± 1.90% and 74.9% ± 4.15%, respectively (Fig. 1C). Interestingly, although the SUV for 11C-PBR28 in whole blood was constantly higher than the SUV for the parent in plasma, the opposite was true for 18F-GE180. The average parent-to-whole blood ratio from 10 min to the end of the scan was 0.30 ± 0.07 for 11C-PBR28 and 1.25 ± 0.06 for 18F-GE180. The fP values were similar for both tracers: 3.5% ± 1.1% for 18F-GE180 (n = 5) and 4.1% ± 1.1% for 11C-PBR28 (n = 4, because the measurement in 1 subject failed).
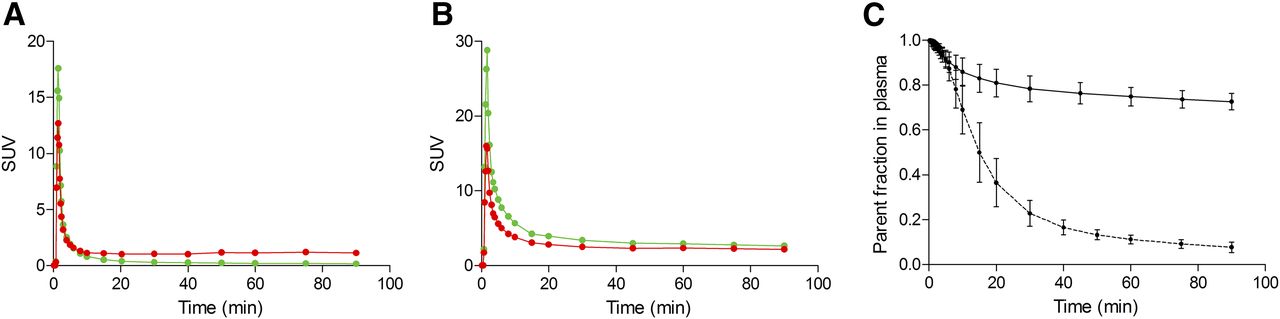
SUV concentrations of parent compound (green lines) and whole blood (red lines) for 11C-PBR28 (A) and 18F-GE180 (B) in representative subject. Although parent concentration of 11C-PBR28 is generally lower than whole-blood concentration, opposite is true for 18F-GE180. (C) Average and SD from all subjects of parent fraction in plasma for 11C-PBR28 (dashed line) and 18F-GE180 (solid line). Metabolism rate is much slower for 18F-GE180, as parent constitutes about 70%–80% of total plasma activity at end of 90-min scan.
Brain Uptake and Kinetic Modeling
Visually, the brain uptake in the 11C-PBR28 scans was much higher than that in the 18F-GE180 scans. The activity of the vascular structures and the skull was prominent even in the summed image of the 18F-GE180 scans, whereas no vascular activity was visible in the 11C-PBR28 scans. The time–activity curves for 11C-PBR28 showed good uptake in the brain, with an increasing phase that reached its peak at about 8 min after injection (the SUVpeak in the whole brain was 1.90 ± 0.26) and then a washout phase whose SUV at 90 min was 1.00 ± 0.20 (Fig. 2). In contrast, the highest value recorded in the 18F-GE180 time–activity curves occurred at about 1.5 min after injection (SUV, 0.74 ± 0.15) and was likely due to vascular activity. After the initial vascular peaks, the curves were almost flat until the end of the scan. The peak that seemed to be related to brain uptake occurred at about 7 min and had an SUV of 0.67 ± 0.14. The SUV at the end of the scan was 0.50 ± 0.09.

Time–activity curves, expressed in SUVs, of 3 representative regions from right hemisphere of brain of healthy volunteer with high-affinity binding. (A) Temporal cortex. (B) Putamen. (C) Cerebellum. SUVs of 18F-GE180 curves (○) were substantially lower (peak value of <1) than those of 11C-PBR28 curves (●) (peak value of >2), and curves were almost flat. Lines represented fitting by 2-tissue-compartment model.
2TCM_fix produced a good fit with 11C-PBR28; the fit converged in all regions of all subjects, and in only 7 regions (of 355 regions, 71 per subject) was the total volume of distribution (VT) estimated to have an SE of greater than 20%. With 18F-GE180, however, the fit was often poor in the initial part of the curve. Of 355 regions, 92 regions either had an SE for VT of greater than 20% or the model did not converge. Fit problems in the early part of the curve also were noted by Feeney et al. (21), who used a fixed VB, but not by Fan et al. (22), who estimated VB along with the other microparameters.
The fitting process was repeated by estimating VB (2TCM_VB). For 11C-PBR28, 4 regions of 355 had an SE of greater than 20%, and all regions converged; for 18F-GE180, 98 of 355 regions either had an SE of greater than 20% or the models did not converge. Although the Akaike scores did not change for 11C-PBR28 when VB was estimated (average values were 126.6 ± 20.1 with 2TCM_fix and 121.2 ± 22.6 with 2TCM_VB), they improved for 18F-GE180 (40.9 ± 21.6 with 2TCM_fix and −2.7 ± 24.7 with 2TCM_VB). These results are in contrast to those described by Feeney et al; in their study, the results obtained with variable VB did not outperform those obtained with fixed VB (21). We also tested a 2TCM with vascular trapping and estimated VB (16), but we found that for the 5 included subjects, the Akaike scores were very similar to those obtained with the simple 2TCM_VB (121.2 ± 24.7 for 11C-PBR28 and −0.74 ± 25.8 for 18F-GE180).
We therefore chose to compare the 2 tracers using a standard 2TCM_VB and only the regions in which the SE was less than 20% and in which the models converged. We averaged the parameters for all subjects, because the VT values in the amyotrophic patient were similar to those in the healthy volunteers and the VT values in the subject with high-affinity binding were close to those in the subjects with mixed-affinity binding. The average 11C-PBR28 VT value was 3.27 ± 0.66 mL/cm3, whereas the corresponding value for 18F-GE180 was more than 20 times smaller (0.15 ± 0.03 mL/cm3) (Table 1). In addition, the VT value of 11C-PBR28 was estimated with greater precision than the VT value of 18F-GE180. The average SEs (considering only those that were less than 20%) were 4.03% ± 2.32% for 11C-PBR28 and 7.00% ± 4.10% for 18F-GE180.
Comparison of Kinetic Modeling Parameters for 11C-PBR28 and 18F-GE180 Using 2-Tissue-Compartment Model
Regarding the other modeling parameters, the main difference between the 2 tracers was found with the plasma-to-tissue rate constant (K1), which was 10 times smaller for 18F-GE180 than for 11C-PBR28 (0.0070 ± 0.0016 vs. 0.0943 ± 0.0165 mL/min) (Table 1).
A similarly large difference in VT values between the 2 tracers was obtained using a Logan plot: 3.29 ± 0.61 mL/cm3 for 11C-PBR28 and 0.17 ± 0.03 mL/cm3 for 18F-GE180 (Fig. 3). The correlations between the 2TCM_VB and Logan VT values were similar for both tracers (R2 for 11C-PBR28 was 0.939; R2 for 18F-GE180 was 0.901), although the analysis was performed only with regions whose VT values were well estimated (i.e., 351 for 11C-PBR28 and 257 for 18F-GE180).

Parametric images of 11C-PBR28 and 18F-GE180, obtained with Logan plot, for healthy volunteer with high-affinity binding and corresponding MR images for anatomic reference. 18F-GE180 had very low uptake in brain; therefore, vascular structures are prominently visible.
DISCUSSION
The present study showed that 18F-GE180, a new TSPO tracer, has very low brain uptake. After kinetic modeling, the VT values of 18F-GE180 were more than 20 times smaller than those of the widely used 11C-PBR28. The low brain uptake was mostly due to low penetration into the brain from the vascular compartment. Indeed, high activity inside the vessels was visible throughout the scans, and the K1 values of 18F-GE180 were only about one-tenth those of 11C-PBR28.
Kinetic modeling was also more difficult with 18F-GE180 than with 11C-PBR28. First, although good results were obtained for 11C-PBR28 with both the 2TCM_fix model and the 2TCM_VB model, the fittings of the 18F-GE180 curves were sometimes of poor quality if VB was set at a fixed value. Second, good fittings were obtained for 11C-PBR28 in almost all regions and all subjects, but about one-third of the regions analyzed with 18F-GE180 had to be excluded because of a high SE or because the models did not converge. Third, the VT values were estimated with higher precision with 11C-PBR28 than with 18F-GE180.
There are several possible reasons why a TSPO tracer may have low uptake in the brain. First, although subjects with low-affinity binding do not show appreciable specific binding for most TSPO tracers, all subjects in the present study were genotyped for the TSPO polymorphism, and all showed either high- or mixed-affinity binding. Specific binding is proportional to the density of receptors and the affinity for the target. Each patient underwent both scans on the same day (11C-PBR28 in the morning and 18F-GE180 in the afternoon). This method was used not only to minimize invasiveness (only 1 arterial catheter was placed) but also to minimize intrasubject variability in TSPO expression. The same-day retest variability of TSPO, measured with 11C-PBR28, is about 16% (range, 5%–25%) (27); of course, this variability cannot explain the 20-fold reduction in VT values found between the 11C-PBR28 scans in the morning and the 18F-GE180 scans in the afternoon. Moreover, in vitro studies have shown that 18F-GE180 has a good affinity for TSPO (Ki, 0.87 nM) (17).
A low fP would limit the amount of free tracer available for tissue exchange. Indeed, this hypothesis to explain the low uptake of 18F-GE180 in the brain was put forward by Fan et al., who were unable to estimate fP reliably (22). In vitro experiments estimated the fP of 18F-GE180 to be about 2%–3% (22), and our own in vivo measurements showed the fP to be about 3%–4% of the parent activity in plasma, comparable to that of 11C-PBR28. However, even if the fP percentages were similar for both ligands, low brain uptake could have been caused by low exposure of the brain to the ligand—which ultimately depends on the amount of tracer present in the plasma. We therefore calculated a variable we called effective exposure, which is defined as the area under the curve of the input function during the first 20 min multiplied by the free fraction (fP) (28). Table 2 compares the effective exposures of 11C-PBR28 and 18F-GE180 with those of 5 other radioligands from the literature. Even in cases of high parent concentrations due to slow metabolism, an extremely low free fraction may result in low exposure. Likely, this was the reason why 11C-LY2428703, a metabotropic glutamate receptor 1 tracer with excellent imaging characteristics in rodents (29), turned out to be unsuitable for human imaging (28). A low effective exposure may be compensated for by a high density of receptors or a high affinity, as was probably the case for the CB1 ligand 18F-FMPEP-d2 (30). Because of the slow metabolism of 18F-GE180 in plasma, the effective exposure of 18F-GE180 was much higher than that of 11C-PBR28 (5.9 vs. 1.7) and more similar to those of the tracers 11C-NOP-1A and 11C-(R)-rolipram (Table 2), which have good brain uptake (31,32). In summary, compared with 11C-PBR28, 18F-GE180 had 20-fold-lower brain uptake despite more than 3-fold-higher effective exposure.
Comparison of Brain Exposures for 11C-PBR28, 18F-GE180, and 5 Other Radioligands
Finally, low brain uptake can be due to low penetration of the blood–brain barrier. Given that the logD of 18F-GE180 at pH 7.4 is 2.95 (21), which is in the optimal range for passive brain entry in vivo (33), low penetration due to low lipophilicity is unlikely. However, 18F-GE180 may be a substrate for the efflux proteins at the blood–brain barrier, such a P-glycoprotein. Although this is probably the most plausible hypothesis, the parent-to-whole blood ratio of the input function of 18F-GE180 was always higher than 1, suggesting that 18F-GE180 also cannot penetrate red cells well. The integrity of the blood–brain barrier nevertheless seems necessary to prevent 18F-GE180 from entering the brain. For instance, Albert et al. studied 18F-GE180 uptake in patients with grade III or IV glioma and found extraordinarily high tumor-to-background contrast (34). Such high uptake, in our opinion, is driven mainly by the destruction of the blood–brain barrier by the tumoral lesions. However, Albert et al. suggested that the accumulation of 18F-GE180 in lesions is independent of the integrity of the blood–brain barrier, especially because some peripheral areas of the lesions displayed 18F-GE180 uptake without MR contrast enhancement. Although it is more plausible that the contribution of TSPO expression to the overall uptake is higher in these peripheral areas, histologic validation was not performed and, as the authors correctly stated, it is known that the actual tumor volume exceeds the contrast enhancement on MRI (34–36). Indeed, the brain tumor area defined by various PET tracers is commonly larger than that defined by MRI (37–39). Small groups of glioma cells or even single invading cells are sufficient to cause a local breach of the blood–brain barrier, even far away from the main tumor mass (40). Given the known limitations of MRI in depicting areas with subtle permeability changes (41,42), the 18F-GE180–positive, MRI-negative areas at the periphery of the glioma lesions may well be due to a more limited loss of integrity of the blood–brain barrier, which would be visible thanks to the very low uptake of 18F-GE180 in the normal areas of the brain.
Three previous studies tested 18F-GE180 in humans, 2 in healthy volunteers (21,22) and 1 in glioma patients (34), and all of them recommended further evaluation of this tracer in patients with different inflammatory conditions. On the basis of our data, it is our contention that 18F-GE180 is obviously inferior to the well-established 11C-PBR28 for the study of brain inflammation, independently of breakdown of the blood–brain barrier.
Differential binding in subjects with mixed-affinity and high-affinity binding was found by Fan et al. (22) but not in the other 2 studies with comparable numbers of subjects (21,34)—despite an in vitro binding affinity ratio of 15:1 for subjects with high- and low-affinity binding (21). The lack of discrimination in vivo between genotype subgroups is likely due to the low brain uptake and the uncertainties in the quantification of noisy and almost flat brain time–activity curves with important vascular contaminations. If 18F-GE180 cannot reliably detect known differences in binding affinity, then it should not be trusted to assess unknown differences in TSPO expression in patients with inflammatory conditions. Notably, new TSPO tracers whose imaging properties are better even than those of 11C-PBR28 are now available. For instance, 11C-ER176, a new quinazoline analog of 11C-(R)-PK11195 (43), is characterized by such high specific binding that successful imaging is possible even for subjects with low-affinity binding (44).
The only advantage of 18F-GE180 over 11C-PBR28 is that labeling with 18F would allow the use of the tracer even in centers without a cyclotron. However, other 18F-labeled TSPO radioligands with better properties are already available. For instance, 18F-PBR06 is similar in terms of precision, sensitivity to accumulation of radiometabolites, and magnitude of in vivo binding to its carbonated analog 11C-PBR28 (45). Of course, using 18F instead of 11C would also deliver a higher radiation dose to the patient. Although the dosimetry of 18F-GE180 has never been reported, the dose delivered by 18F-tracers is about 4 times higher than that delivered by 11C-tracers (46,47). However, it is our contention that within this range of doses, dosimetry should not be a concern, and the choice of the tracer should be driven only by imaging quality.
Finally, although poorly suited for human imaging, 18F-GE180 has good imaging characteristics for preclinical models. Not only is it superior to 11C-(R)-PK11195 in rodents (18–20) but also it enables the detection of microglial activation in a mouse model of Alzheimer disease with greater sensitivity than 18F-PBR06 (48). These data suggest that 18F-GE180 may be a substrate for efflux proteins at the blood–brain barrier in humans but not in rodents (assuming that the blood–brain barrier is the reason for the poor uptake in humans). Species differences in permeability are not uncommon. More often, substances that are blocked by the rodents’ barrier are taken up by the human brain, but the opposite also happens (49). Besides preclinical imaging, 18F-GE180 may also be useful for imaging inflammation when there is no blood–brain barrier to cross (e.g., cardiovascular or peripheral oncologic diseases).
CONCLUSION
The VT of 18F-GE180 is about 20 times smaller than that of 11C-PBR28 because of low penetration into the brain from the vascular compartment. In addition, kinetic modeling of 18F-GE180 is more challenging than that of 11C-PBR28, as its parameters are identified with a lower precision and outlying values are more frequent. Therefore, compared with existing radioligands, 18F-GE180 has unfavorable characteristics for TSPO imaging in the human brain.
DISCLOSURE
This study was partially funded by ALS Finding a Cure and the ALS Association, as part of the TRACK ALS protocol, and the Harrison, Chao, Graham, and Nantz Funds of the Houston Methodist Foundation. Carter Randall is a GE employee. Joseph Masdeu is on a General Electric Healthcare advisory board and receives research support from GE, Eli Lilly, Biogen, Abbvie, and Novartis. No other potential conflict of interest relevant to this article was reported.
Footnotes
Published online Jan. 18, 2018.
- © 2018 by the Society of Nuclear Medicine and Molecular Imaging.
REFERENCES
- Received for publication October 2, 2017.
- Accepted for publication December 6, 2017.


Jump to section
Related Articles
Cited By...
- Imaging Neuroinflammation in Neurodegenerative Disorders
- Safety, Biodistribution, and Radiation Dosimetry of 18F-rhPSMA-7.3 in Healthy Adult Volunteers
- Quantification of Macrophage-Driven Inflammation During Myocardial Infarction with 18F-LW223, a Novel TSPO Radiotracer with Binding Independent of the rs6971 Human Polymorphism