


Abstract
Amyloid imaging by small-animal PET in models of Alzheimer disease (AD) offers the possibility to track amyloidogenesis and brain energy metabolism. Because microglial activation is thought to contribute to AD pathology, we undertook a triple-tracer small-animal PET study to assess microglial activation and glucose metabolism in association with amyloid plaque load in a transgenic AD mouse model. Methods: Groups of PS2APP and C57BL/6 wild-type mice of various ages were examined by small-animal PET. We acquired 90-min dynamic emission data with 18F-GE180 for imaging activated microglia (18-kD translocator protein ligand [TSPO]) and static 30- to 60-min recordings with 18F-FDG for energy metabolism and 18F-florbetaben for amyloidosis. Optimal fusion of PET data was obtained through automatic nonlinear spatial normalization, and SUVRs were calculated. For the novel TSPO tracer 18F-GE180, we then calculated distribution volume ratios after establishing a suitable reference region. Immunohistochemical analyses with TSPO antisera, methoxy-X04 staining for fibrillary β-amyloid, and ex vivo autoradiography served as terminal gold standard assessments. Results: SUVR at 60–90 min after injection gave robust quantitation of 18F-GE180, which correlated well with distribution volume ratios calculated from the entire recording and using a white matter reference region. Relative to age-matched wild-type, 18F-GE180 SUVR was slightly elevated in PS2APP mice at 5 mo (+9%; P < 0.01) and distinctly increased at 16 mo (+25%; P < 0.001). Over this age range, there was a high positive correlation between small-animal PET findings of microglial activation with amyloid load (R = 0.85; P < 0.001) and likewise with metabolism (R = 0.61; P < 0.005). Immunohistochemical and autoradiographic findings confirmed the in vivo small-animal PET data. Conclusion: In this first triple-tracer small-animal PET in a well-established AD mouse model, we found evidence for age-dependent microglial activation. This activation, correlating positively with the amyloid load, implies a relationship between amyloidosis and inflammation in the PS2APP AD mouse model.
Alzheimer disease (AD) is the most common cause of dementia, and with its exponentially increasing incidence as a function of age among the elderly, it is imposing an ever more onerous burden on health care (1). This state of affairs motivates a worldwide effort to find new biomarkers predicting future cognitive decline in patients with suspected early AD and likewise for use as outcome measures in clinical trials of innovative disease-modifying agents (2). Immunologically mediated neuroinflammation is implicated in the pathophysiologic processes of AD (3,4), which are classically characterized by accumulation of extracellular β-amyloid plaques and intracellular neurofibrillary tangles (5). Many aspects of the classic β-amyloid pathology are emulated in various transgenic rodent models for AD (6,7), and translational studies of these processes are facilitated by small-animal PET using radioligands for imaging of AD biomarkers in these rodent models (8). In particular, small-animal PET imaging of β-amyloid has been successfully established in the past few years (9,10). However, information regarding neuroinflammation in these models remains sparse and rather inconsistent (11–13).
Neuroinflammation can be assessed by molecular imaging with several 11C-labeled radiotracers targeting the 18-kD translocator protein (TSPO), which is highly expressed at the outer mitochondrial membrane of activated microglia (8,14); the brief physical half-life of 11C presents logistic difficulties for its widespread use. However, novel 18F-fluorinated second-generation TSPO radiotracers now offer a more practical means to undertake imaging also at sites lacking a cyclotron/radiochemistry facility. Among the various such compounds, 18F-GE180 has emerged as a TSPO ligand affording excellent signal-to-noise ratio and brain kinetics favorable for the detection of microglial activation (15,16). However, monitoring of neuroinflammation in AD mice by this agent remains to be established.
The aim of this study was to investigate the novel TSPO tracer 18F-GE180 in PS2APP mice, a well-established transgenic AD mouse model; we have previously characterized by 18F-florbetaben small-animal PET the progressive amyloid plaque formation with aging in this strain (17). Thus, we performed 18F-GE180 small-animal PET examinations in groups of transgenic (TG) and wild-type (WT) mice at various ages and also measured β-amyloid using 18F-florbetaben and glucose metabolism using 18F-FDG. With this multitracer approach we undertook to chart the interrelations of all 3 biomarkers in vivo during the life course of PS2APP mice to test the hypothesis of a potential coherence between neuroinflammation and amyloidosis. In particular, we anticipated that amyloidosis in TG PS2APP mice should result in greater inflammation, bringing in turn increased glucose metabolism. We confirmed the 18F-GE180 small-animal PET results relative to gold standard findings obtained by immunohistochemistry and additionally by autoradiography ex vivo in a subset of animals.
MATERIALS AND METHODS
Radiochemistry
18F-GE180
Radiosynthesis of 18F-GE180 was performed as previously described (16), with slight modifications as presented in the supplemental materials (available at http://jnm.snmjournals.org). This procedure yielded a radiochemical purity exceeding 98% and a specific activity of 1,400 ± 500 GBq/μmol at the end of synthesis.
18F-Florbetaben and 18F-FDG
Radiosynthesis of 18F-florbetaben was performed as previously described (10). This procedure yielded a radiochemical purity exceeding 98% and a specific activity of 80 ± 20 GBq/μmol at the end of synthesis. 18F-FDG was purchased commercially.
Animals
All experiments were performed in compliance with the National Guidelines for Animal Protection, Germany, and the approval of the regional animal care committee (Regierung Oberbayern), and were overseen by a veterinarian. Animals were housed in a temperature- and humidity-controlled environment with a 12-h light–dark cycle, with free access to food (Ssniff) and water.
The transgenic B6.PS2APP (line B6.152H) is homozygous for the human presenilin (PS) 2, N141I mutation and also the human amyloid precursor protein (APP) K670N, M671 L mutation. The APP and PS2 transgenes are driven by mouse Thy-1 and mouse prion promoters, respectively. This line had been created by coinjection of both transgenes into C57BL/6 zygotes (18). Homozygous B6.PS2APP (PS2APP) mice show first appearance of plaques in the cortex and hippocampus at 5–6 mo of age (19).
Study Overview
The study design consisted of a pilot study and the main study.
In the pilot study, autoradiography ex vivo and in vitro was performed with 18F-GE180, followed by immunohistochemistry in small groups of WT and TG mice at 10 and 22 mo of age.
In the main study, small-animal PET scans were obtained with the 3 radiopharmaceuticals described in groups of WT and TG mice aged 5, 8, 13, and 16 mo (±0.5 mo). Within 1 wk after completion of the PET session, mice were perfused with phosphate-buffered saline while deeply anesthetized before immunohistochemical analyses. A detailed overview for the main study of the different groups of mice is provided in Table 1. To investigate reproducibility of results with 18F-GE180, we undertook test–retest PET scans in a subset of 11 TG animals (age, 5–16 mo; n = 2–3 at each time point) at an interval of 1 wk to allow recovery from anesthesia.
Overview for Main Study
Small-Animal PET Data Acquisition, Reconstruction, and Coregistration
Details of the acquisition protocol and reconstruction algorithms as well as coregistration procedures are provided in the Supplemental Methods.
Small-Animal PET Data Analyses
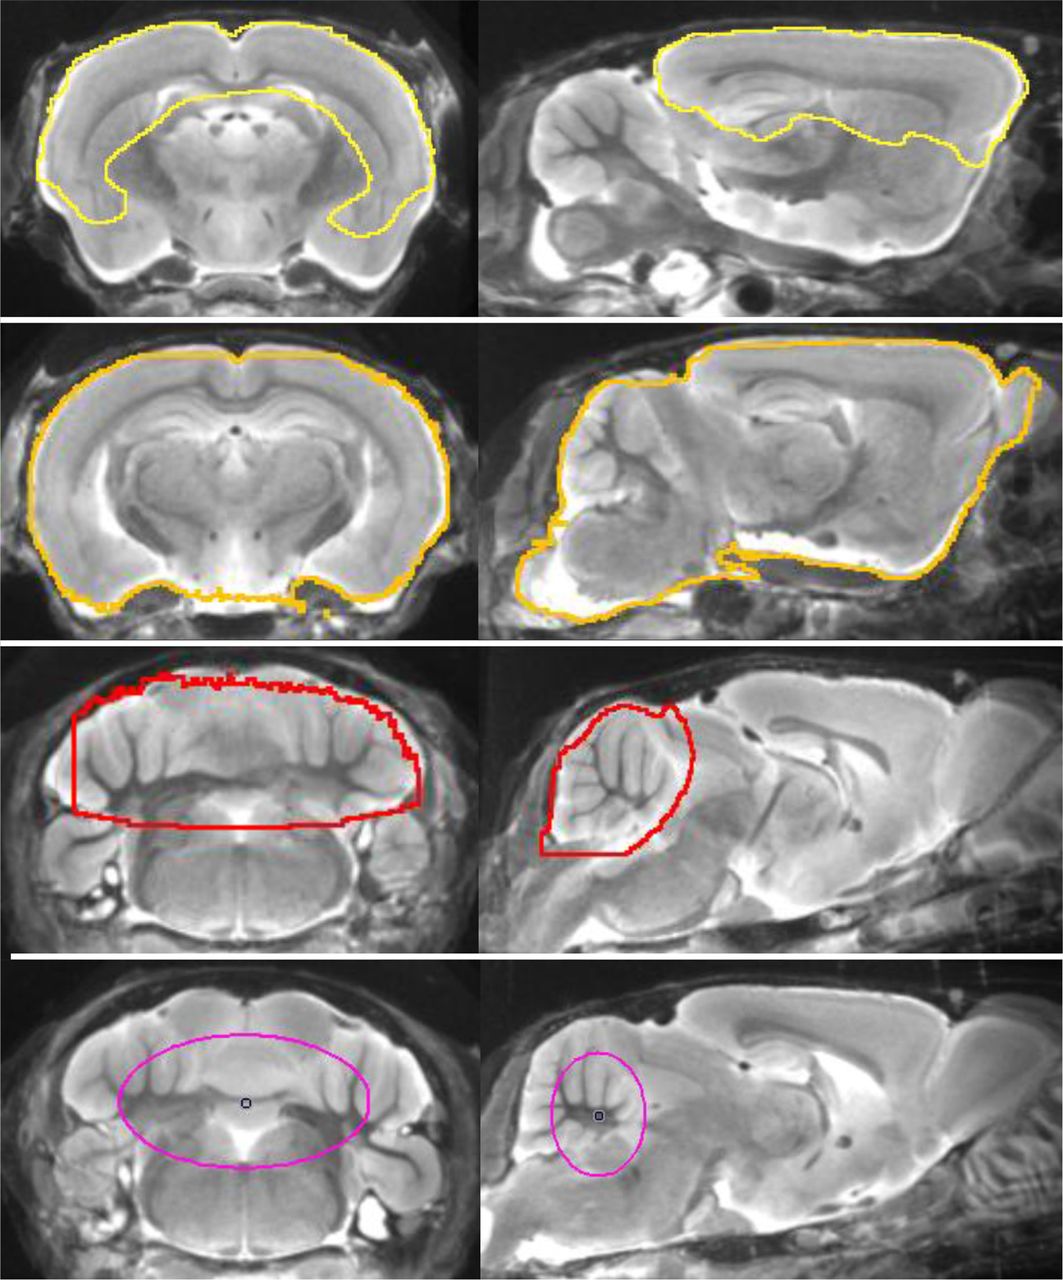
Volumes of interest (VOIs) were defined on the MRI mouse atlas (Fig. 1). A large forebrain target VOI (comprising 156 mm3), containing most of the frontal and parietal cortex as well as the hippocampus and the thalamus, was used for all tracers. For reference region analysis in the case of 18F-GE180 small-animal PET, we tested several different tissue compartments. The reference regions consisted of a whole-brain VOI (comprising 525 mm3) and a whole cerebellar VOI (comprising 65 mm3) as described previously (20). We also tested oval-shaped white matter VOIs mostly containing white matter tissue of the cerebellum and the brain stem (comprising 29 mm3), which emerged by voxelwise mapping of the contrast between WT and TG and WT groups, as described in detail in the Supplemental Methods and illustrated in Supplemental Figure 1.

Definitions of forebrain (yellow), whole brain (orange), cerebellar (red), and white matter (purple) volumes of interest projected on mouse brain MRI atlas in coronal and sagittal slices.
On the basis of our previous experience, the entire cerebellum was used for scaling of 18F-FDG data. For 18F-florbetaben, a different white matter reference region (67 mm3; pons, midbrain, hindbrain parts of the subcortical white matter) emerged superior to scaling by the cerebellum (21), such that we switched the amyloid PET analysis to this reference region. In animals receiving the full dynamic 18F-GE180 small-animal PET scan, distribution volume ratio maps were calculated using a linear graphic method (22), relative to a white matter VOI intended to serve as a pathology-free reference tissue. We extracted and compared time–activity curves of the several target and reference VOIs.
SUVs for target and reference VOIs were calculated by scaling to the injected dose and multiplying the body weight for 18F-GE180. Forebrain target-to-reference tissue SUVRs were used for calculation of SUVRFBR/REF for the case of dynamic 18F-GE180 scans and for the static frames for the cases of all of 18F-florbetaben and 18F-FDG.
Ex Vivo and In Vitro Autoradiography
In the pilot study, autoradiography experiments were performed to confirm the specificity of 18F-GE180 small-animal PET results to TSPO distribution. Autoradiography ex vivo was performed in 2 TG mice aged 22 mo at 60 min after injection of 9.2 MBq of 18F-GE180 (+150 μL saline). In vitro autoradiography with 18F-GE180 at a range of concentrations (with and without blocking by TSPO antibody) and 18F-florbetaben was performed in brain cryostat sections from the pilot study subset of aged TG mice. Details of the autoradiography procedures are provided in the Supplemental Methods.
Immunohistochemistry: Acquisition and Image Analysis
Plaque and microglial load were calculated as the summed area of all labeled plaques and microglia and reported as percentage densities relative to the entire cerebral cortex areas. These analyses were performed by an operator who was masked to the small-animal PET results. Methodologic details can be found in the Supplemental Methods.
Statistics
Group comparisons of VOI-based small-animal PET results between WT and TG mouse groups were assessed by 1-way ANOVA and Tukey post hoc test for multiple comparisons using IBM SPSS Statistics (version 22.0; SPSS). For correlation analyses, Pearson coefficients of correlation (R) were calculated. A threshold of P less than 0.05 was considered to be significant for rejection of the null hypothesis.
RESULTS
Validation of 18F-GE180 PET
VOI-based analyses were performed with the dynamic dataset to establish the kinetics of 18F-GE180 in target tissues of WT and TG animals and to define optimal time windows and reference tissue normalization for routine small-animal PET examinations.
Time–activity curves for 18F-GE180 in several reference tissues, calculated as SUV (mean ± SD) in TG mice at different ages, are shown in Figure 2A. Age dependence of the time–activity curves is conspicuous with whole brain and whole cerebellar scaling, whereas the white matter reference tissue yielded a distinctly higher congruence between animal groups. Mean white matter reference SUV in the interval 60–90 min after injection was similar in TG and WT of all ages (range of SUVmean, 2.98–3.16; range of SUV SD, 0.44–0.58; no significant intergroup differences).
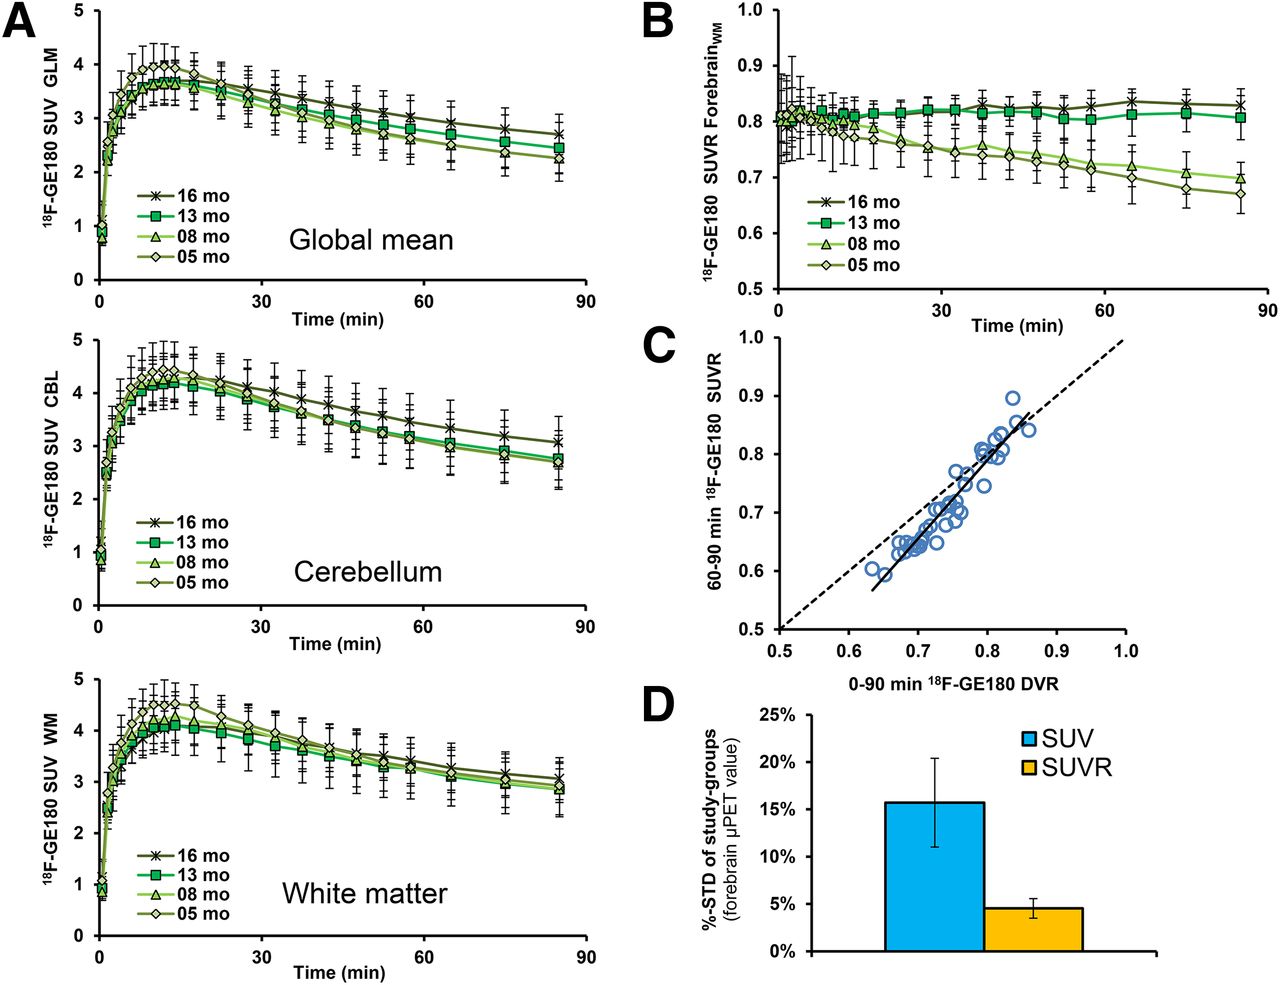
(A) Mean 18F-GE180 uptake reported as SUV for each of 3 reference regions as function of time after tracer administration in groups of PS2APP mice. Least evidence of pathology (i.e., stability between TG and WT) was detected for a white matter pseudo reference region. Error bars indicate SD for estimates in groups of 5–8 animals. (B) Target-to-reference ratios as functions of time after 18F-GE180 administration in groups of PS2APP mice. (C) Correlation of 18F-GE180 distribution volume ratio (DVR) calculated from 90-min dynamic small-animal PET recordings with corresponding SUVR (forebrain/white-matter) results from 60- to 90-min static frame. Dotted line represents a perfect line of identity (DVR = SUVR). (D) Stability of forebrain 18F-GE180 values after SUV calculation (blue) and pseudo reference tissue (orange) scaling as expressed by mean %-SD (± SD) in all 8 groups of TG and WT mice.
No relevant spill-in of extracerebral activity to the brain was observed during the entire 90-min emission sequences. The reference tissue ratio time–activity curves revealed an equilibrium binding in brain occurring by 20 min for the aged TG groups (13 and 16 mo), whereas younger TG groups (5 and 8 mo) indicated a slight but constant decline in cerebral activity, with a trend toward apparent equilibrium in the last 2 frames. Thus, as an alternative to kinetic modeling for 18F-GE180 quantification, the use of SUVR in a static frame recorded in the interval 60–90 min after injection provides a convenient surrogate marker for specific binding (Fig. 2B).
In this regard, there was excellent linear relationship between distribution volume ratio, calculated for the entire 90-min recording, and the 60- to 90-min static frame SUVR (R = 0.99, P < 0.001) (Fig. 2C). Test–retest analyses confirmed as well the robustness of 60- to 90-min SUVRFBR/WM for the forebrain target region in TG animals (best fit: R = 0.98, linear, P < 0.001; test–retest variability: 1.9%).
Variance in the forebrain 18F-GE180 SUVR for the 60- to 90-min static recording within groups of mice was distinctly lower in conjunction with a white matter reference region (mean SD, 4.5% ± 1.0%; range, 3.0%–5.9%) than the plain SUV (mean SD, 15.7% ± 4.7%; range, 8.8%–21.2%; Fig. 2D).
Triple-Tracer Small-Animal PET Analyses
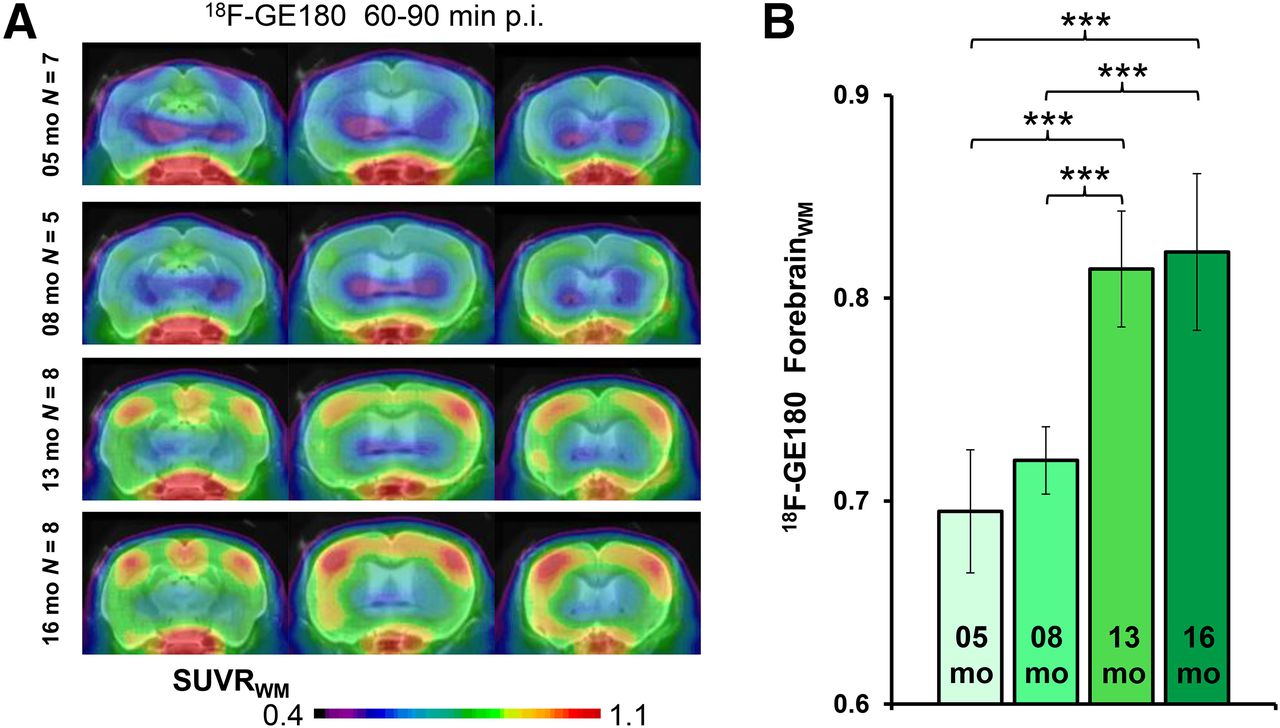
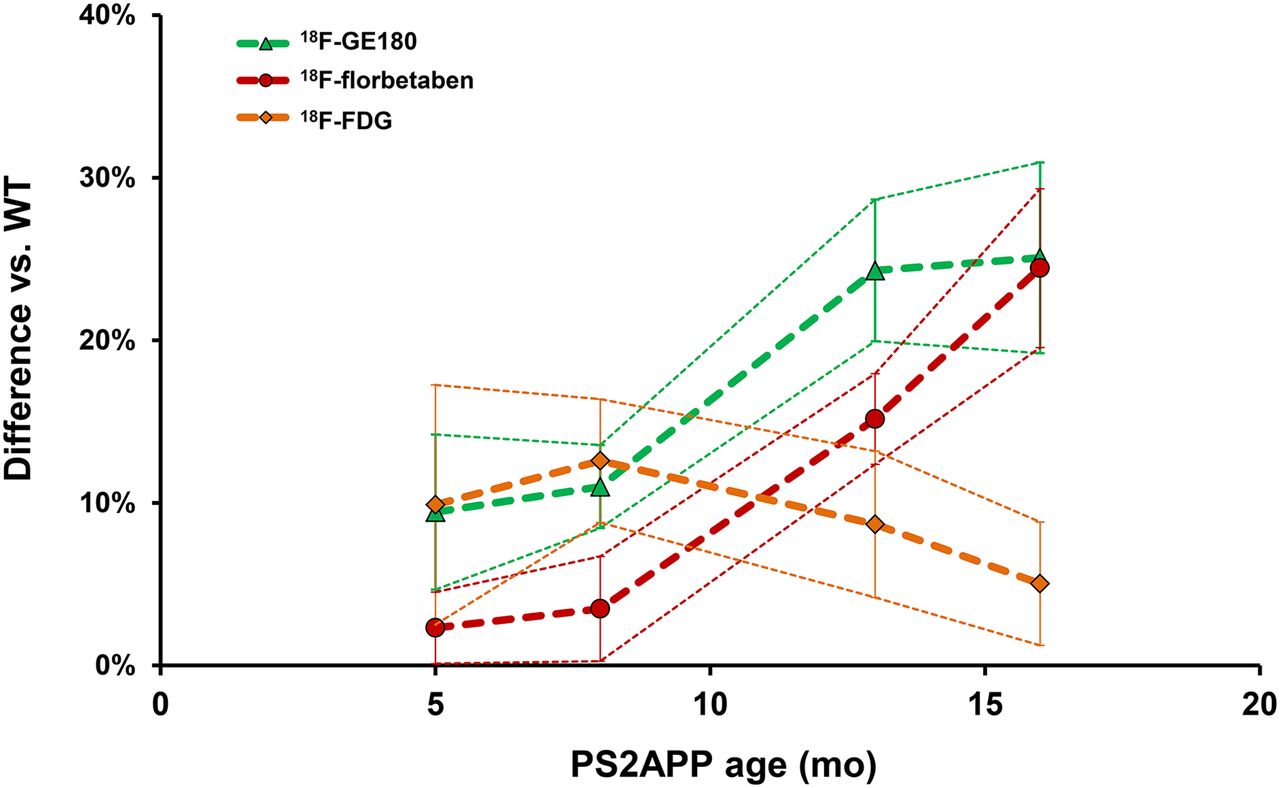
All small-animal PET results are provided in Table 1. TG mice already showed elevated SUVRFBR/WM 18F-GE180 uptake when compared with age-matched WT mice as early as 5 mo (+9%; P < 0.005), which increased substantially by 16 mo (+25%; P < 0.001) (Fig. 3). 18F-florbetaben SUVRFBR/WM in TG mice was near the WT level at 5 and 8 mo (+2%, +4%; P =not significant) and increased at 13 mo (+15%; P < 0.001) and 16 mo (+24%; P < 0.001) to age-matched WT mice. 18F-FDG SUVRFBR/CBL was significantly higher in PS2APP TG mice at all ages than in age-matched WT groups, with the peak increase at 8 mo (+12%; P < 0.001), which subsequently declined in the 16-mo group (+5%; P < 0.05).

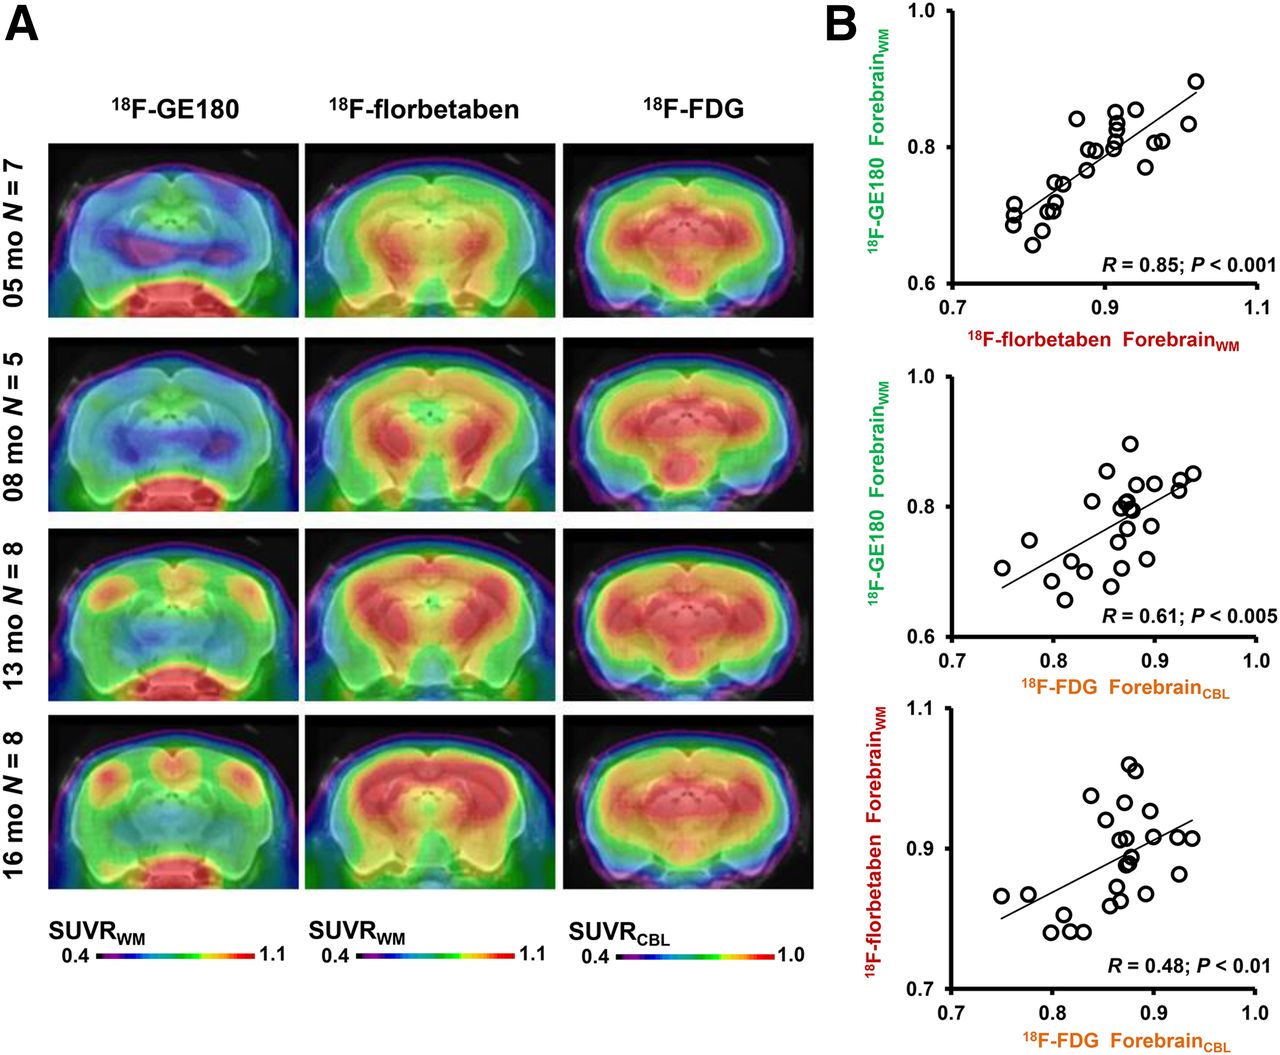
(A) Coronal planes of 18F-GE180 mean SUVR maps at different ages of PS2APP animals projected on an MRI mouse atlas (gray scale). (B) Mean (±SD) SUVR estimates for PS2APP animals at different ages. Significant differences between subgroups are marked by ***P < 0.001; 1-way ANOVA. p.i. = after injection.
There was an excellent positive correlation (R = 0.85; P < 0.001) between 18F-GE180 SUVRFBR/WM and 18F-florbetaben SUVRFBR/WM in the pooled PS2APP TG mice. Lesser correlations were seen between 18F-FDG SUVRFBR/CBL and 18F-GE180 SUVRFBR/WM (R = 0.61; P < 0.005) as well as between 18F-FDG SUVRFBR/CBL and 18F-florbetaben SUVRFBR/WM (R = 0.48; P < 0.01) (Fig. 4). WT indicated a high positive correlation between 18F-FDG SUVRFBR/CBL and 18F-GE180 SUVRFBR/WM (R = 0.55; P < 0.005). No significant associations between 18F-FDG SUVRFBR/CBL or 18F-GE180 SUVRFBR/WM with 18F-florbetaben SUVRFBR/WM were observed. The age dependence in the uptake of the 3 tracers is presented in Figure 5.

(A) Coronal planes of mean SUVR maps for all 3 different radiotracers at different ages of PS2APP animals, projected on an MRI mouse atlas (gray scale). (B) Correlations between the different forebrain radiotracer SUVR for all PS2APP mice.

Life-course kinetics for PS2APP mice as expressed by %-difference (±SD) versus C57BL/6 controls for the 3 different radiotracers.
Autoradiography and Immunohistochemistry
IBA-1 antibody in vitro quantitation (occupancy [%]) in the whole group of PS2APP mice showed a strong positive correlation with the 18F-GE180 uptake in vivo (R = 0.61; P < 0.005). 18F-florbetaben uptake and percentage plaque load (%) as assessed by methoxy-X04 histology had a high correlation finding (R = 0.80; P < 0.001), as in our previous β-amyloid-PET studies (10,17). Both immunohistochemical staining methods indicated a progression of pathophysiology with age in a manner congruent with the PET data (Supplemental Fig. 2).
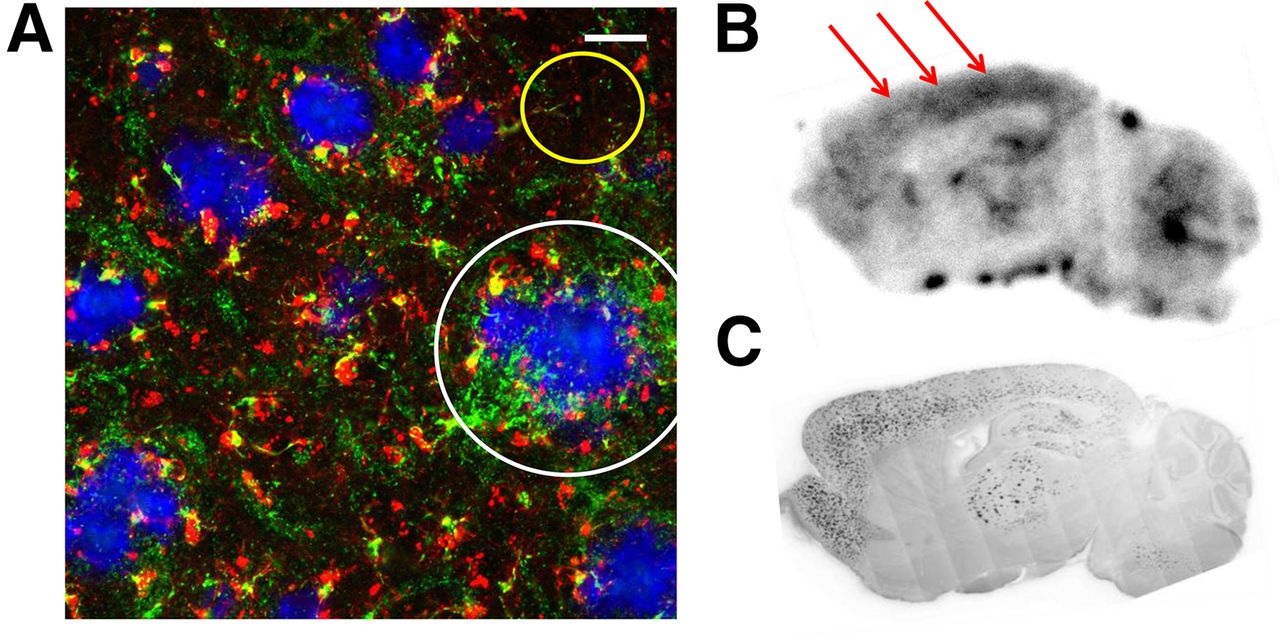
The pattern of 18F-GE180 binding seen by autoradiography ex vivo resembled the binding observed in the small-animal PET scan, and triple labeling in vitro showed colocalization of TSPO activation with fibrillar β-amyloid deposits (Fig. 6). Qualitatively, the 18F-GE180 autoradiography in vitro was more diffuse than for 18F-florbetaben, which showed a more focal pattern. Prior incubation of brain sections with TSPO antibody completely blocked 18F-GE180 labeling in the forebrain, thus indicating the specific association of increased TSPO expression and amyloid plaques (Supplemental Fig. 3).

(A) Immunohistochemical costaining shows IBA-1– (red) and TSPO- (green) positive cells adjacent (white circle) to fibrillar amyloid plaques (blue) in the frontal cortex of a PS2APP mouse aged 22 mo. Yellow circle indicates low IBA-1 and TSPO staining between amyloid plaques. Scale bar represents 20 μm. (B) Sagittal plane for 18F-GE180 autoradiography ex vivo (60 min after injection) in a 22-mo-old PS2APP mouse indicates extensive radiotracer uptake in neocortex (red arrows), hippocampus, and thalamus, which is colocalized with fibrillar amyloid as detected in corresponding methoxy-X04 staining in these brain regions (C). No specific binding is observed in cerebellum.
DISCUSSION
We present the first, to our knowledge, small-animal PET study with 3 different 18F-labeled radiotracers targeting distinct aspects of the pathophysiology in a transgenic mouse model of AD—that is, microglial activation, amyloid deposition, and brain energy metabolism. The novel TSPO ligand 18F-GE180 enabled a robust detection of activated microglia in the TG mouse brain, yielding results concurring closely with immunohistochemical findings and autoradiography in vitro. The consensus of our results clearly indicates coexistence of amyloidosis and neuroinflammation in PS2APP TG mice, together increasing in parallel with increasing age. These findings are seemingly accompanied by elevated glucose consumption.
18F-GE180 Reference Region
One key issue in detecting microglial activation by PET is the lack of an appropriate pathology-free reference tissue—that is, a region devoid of TSPO expression in the mouse brain (23). In the absence of a true reference region, a recent PET study of TSPO expression in AD patients showed clear benefits for an SUVR analysis with the cerebellum as a pseudoreference region, compared with quantitation relative to arterial blood input for 11C-PBR28 (24). Therefore, we tested several reference tissues for our novel ligand for TSPO, 18F-GE180. Our analyses revealed that a reference region composed of white matter voxels in the brain stem and cerebellum delivered comparable SUV results between TG and WT groups at different ages. In contrast, the whole brain and, to a lesser degree, the cerebellum showed elevated SUV in TG mice with marked pathology, thus being less suitable as a reference region. The white matter reference VOI was of a size (29 mm3) sufficient to minimize signal loss due to partial-volume effects (25). Furthermore, the SUVR approach distinctly minimized the intragroup variance in TSPO results compared with that with simple SUV calculation, which is in line with findings from the human study cited above (24). Thus, we see a clear advantage for a cerebral pseudoreference region in the semiquantitative analysis of preclinical TSPO imaging.
18F-GE180 Time Window
18F-GE180 small-animal PET showed uptake throughout the mouse brain and only minor uptake in extracerebral regions such as cranium or Harderian glands relative to the brain. Ratio analysis of the measured time–activity curves revealed attainment of stable values in aged TG animals as early as 20 min after injection, whereas ratio time–activity curves in younger TG animals tended to have a more delayed stabilization in late-acquisition frames after 50 min, favoring the use of a late static window in routine acquisitions. The distribution volume ratio results using the entire 90-min recordings had an excellent correlation with the SUVR in the 60- to 90-min static frame, which further supports the use of this time window for economic small-animal PET imaging in large study groups.
Neuroinflammation in TG Mouse Model of AD
Age-dependent increases in TSPO expression emerged as a clear surrogate for neuroinflammation in PS2APP mice and clearly reveal a temporal association with the amyloid cascade. Our findings of 25% elevated SUVRWM for 18F-GE180 in aged TG mice compared with WT mice indicates a satisfactory signal-to-noise ratio for 18F-GE180, whereas in vivo findings matched closely with TSPO immunohistochemistry in vitro. A recent study with the same radiotracer in another AD mouse model (APP/PS1dE9) found similar age-dependent microglial activation in the cortex and hippocampus matching with terminal immunohistochemistry findings (26). Present findings are also in line with a recent report of elevated neuroinflammation in the brains of aged APPswePS1-dE9 mice as examined by 18F-DPA-714 small-animal PET (13) as was also confirmed in autoradiographic and immunohistochemical analyses. Our results show a close correlation between accumulation of amyloid load and TSPO expression in PS2APP mice, about which the causal relationship is still under debate (3), and we speculate about this issue in the Supplemental Discussion. Remarkably, our PS2APP mice do not indicate a relevant neurodegeneration at 16 mo of age (18), even though they show severe neuroinflammation and amyloid pathology. Furthermore, normalized 18F-FDG uptake, a small-animal PET marker for glucose metabolism, was elevated in PS2APP mice, especially in the young group and to a lesser extent still at 16 mo of age, compared with findings in WT groups. This seems in line with previous reports of elevated relative glucose metabolism in amyloid models, such as APP/PS1 (27) and 5xFAD (28) mice, in which glial activation was discussed as a probable factor. However, this interpretation seems at odds with 18F-FDG findings in human AD and in prodromal patients with amnesic mild cognitive impairment (29). Nonetheless there is even evidence about metabolic compensation in AD (30), in which the synaptic dysfunction might mask inflammation-related hypermetabolism.
In Vivo Therapy Monitoring
In our hands, microglial activation and amyloid levels as assessed by small-animal PET had high interanimal variability as has been reported for other AD mouse models (7). Therefore, the sensitivity of terminal assessments of treatment effects on neuroinflammation or amyloidogenesis would likely be hampered by this variance. This circumstance emphasizes the value of a reliable noninvasive treatment monitoring, which offers the possibility to account for baseline pathology levels at therapy initiation, and also allows the detection of longitudinal changes in individual mice, as shown in our recent antiamyloid treatment small-animal PET study (31). Neuroinflammation constitutes an interesting therapy target in its own right, and present results with 18F-GE180 small-animal PET show considerable promise for this application.
Limitations
This was a cross-sectional study in groups of mice from the same breeding program; a true longitudinal setting would have entailed serial small-animal PET examinations for each biomarker in each mouse. This would have required 12 small-animal PET scans per mouse, likely resulting in an increased incidence of dropouts and without the possibility of performing immunohistochemical validation in each mouse for all ages. Additionally, we feel that this limitation is balanced by the adequately powered sample sizes, which yielded results sufficiently robust to detect significant differences even between mouse groups at 5 mo of age.
CONCLUSION
In vivo imaging of neuroinflammation by small-animal PET with the novel TSPO ligand 18F-GE180 is feasible, and results correlate strongly with immunohistochemical gold standard assessment, with further support by autoradiographic findings ex vivo. Single-frame recordings at 60–90 min after injection yield robust and reproducible SUVRs that shall bring considerable economy to small-animal PET studies with large group size. In PS2APP mice, age-dependent amyloid accumulation, revealed by 18F-florbetaben, occurs in conjunction with inflammation as assessed by 18F-GE180 small-animal PET. Glucose metabolism as assessed by 18F-FDG small-animal PET correlated positively with inflammation, but hypermetabolism relative to WT mice was pronounced in young TG mice, illustrating a concomitant inflammatory process in association with the amyloidosis in this transgenic AD mouse model.
DISCLOSURE
The costs of publication of this article were defrayed in part by the payment of page charges. Therefore, and solely to indicate this fact, this article is hereby marked “advertisement” in accordance with 18 USC section 1734. The study was financially supported by the SyNergy Cluster and by the “Verein zur Förderung von Wissenschaft und Forschung,” LMU Munich. No other potential conflict of interest relevant to this article was reported.
Acknowledgments
A part of this paper originated from the doctoral thesis of Federico Probst. We thank Karin Bormann-Giglmaier and Rosel Oos for excellent technical assistance. Florbetaben precursor was provided by Piramal Imaging. GE180 cassettes were received from GE. We acknowledge textual revisions by Inglewood Biomedical Editing.
Footnotes
↵* Contributed equally to this work.
Published online Feb. 18, 2016.
- © 2016 by the Society of Nuclear Medicine and Molecular Imaging, Inc.
REFERENCES
- Received for publication October 6, 2015.
- Accepted for publication February 2, 2016.


Jump to section
Related Articles
Cited By...
- Early brain neuroinflammatory and metabolic changes identified by dual tracer microPET imaging in mice with acute liver injury
- Remote Neuroinflammation in Newly Diagnosed Glioblastoma Correlates with Unfavorable Clinical Outcome
- Hippocampal purinergic P2X7 receptor level is increased in Alzheimers disease patients, and associated with amyloid and tau pathologies
- Western diet increases brain metabolism and adaptive immune responses in a mouse model of amyloidosis
- Deciphering sources of PET signals in the tumor microenvironment of glioblastoma at cellular resolution
- Tracking Innate Immune Activation in a Mouse Model of Parkinsons Disease Using TREM1 and TSPO PET Tracers
- Chronic PPAR{gamma} Stimulation Shifts Amyloidosis to Higher Fibrillarity but Improves Cognition
- Loss of TREM2 reduces hyperactivation of progranulin deficient microglia but not lysosomal pathology
- Pre-therapeutic Microglia Activation and Sex Determine Therapy Effects of Chronic Immunomodulation
- In vivo Assessment of Neuroinflammation in 4-Repeat Tauopathies
- Asymmetry of Fibrillar Plaque Burden in Amyloid Mouse Models
- Increased Neurite Orientation-Dispersion and Density in the TgCRND8 Mouse Model of Amyloidosis: Inverse Relation with Functional Connectome Clustering and Modulation by Interleukin-6
- Longitudinal PET Monitoring of Amyloidosis and Microglial Activation in a Second-Generation Amyloid-{beta} Mouse Model
- Opposite microglial activation stages upon loss of PGRN or TREM2 result in reduced cerebral glucose metabolism
- Early and Longitudinal Microglial Activation but Not Amyloid Accumulation Predicts Cognitive Outcome in PS2APP Mice
- Neuroinflammation Appears Early on PET Imaging and Then Plateaus in a Mouse Model of Alzheimer Disease
- Time Courses of Cortical Glucose Metabolism and Microglial Activity Across the Life Span of Wild-Type Mice: A PET Study
- Evaluation of Small-Animal PET Outcome Measures to Detect Disease Modification Induced by BACE Inhibition in a Transgenic Mouse Model of Alzheimer Disease
- The FTD-like syndrome causing TREM2 T66M mutation impairs microglia function, brain perfusion, and glucose metabolism