


Abstract
Neuroinflammation has been associated with various neurologic diseases, including Alzheimer disease (AD). In AD, the translocator protein 18 kDa (TSPO) is overexpressed in the activated microglia that surround the β-amyloid plaques. In the current longitudinal study using a mouse model of AD, we evaluated the association between β-amyloid deposition and neuroinflammation in AD. Methods: To monitor the longitudinal changes in β-amyloid deposition and neuroinflammation, we used in vivo PET imaging and ex vivo autoradiography with Pittsburgh compound B (11C-PIB) and a TSPO tracer, flutriciclamide (18F-GE-180), in the APP23 mouse model of AD. We also applied immunohistochemistry to study β-amyloid and activated microglia in the mouse brain tissue. Results: From 17 to 26 mo of age, the mice showed robust increased binding of 11C-PIB with aging in the frontal cortex, parietotemporal cortex, hippocampus, and thalamus whereas the increase in 18F-GE-180 binding with aging was minimal in areas of early amyloidosis such as the frontal cortex and hippocampus. A clear positive correlation between β-amyloid deposition and neuroinflammation was detected with 11C-PIB and 18F-GE-180 only in the parietotemporal cortex and thalamus. Conclusion: The neuroinflammation increase detected with 18F-GE-180 is less than the increase in amyloidosis detected with 11C-PIB. Furthermore, binding of 18F-GE-180 plateaus at an earlier stage of pathogenesis whereas amyloidosis continues to increase. We suggest that TSPO can be a good marker for early pathogenesis detection but not for tracking long-term disease progression.
Many of the pathologic hallmarks of Alzheimer disease (AD), such as β-amyloid deposition, neuroinflammation, and changes in different neurotransmitter systems and glucose metabolism, can be investigated noninvasively using PET. PET allows both investigation of the pathologic processes and diagnosis and evaluation of the efficacy of AD treatments (1,2). Pittsburgh compound B (11C-PIB), the most used amyloid radioligand in PET studies of AD, enables the in vivo detection of Aβ-deposits in the human brain (3–5) and in some animal models (6–10).
Neuroinflammation caused by microglial activation has been suggested as an important factor affecting cognitive decline in AD (11) and as a pathologic event. Pathologic triggers activate microglia, which migrate to the injury site, initiating an innate immune response. The microglial activation increases expression of the mitochondrial 18-kDa translocator protein (TSPO), which has been the main target for in vivo PET imaging ligands for neuroinflammation with various radiotracers, including 11C-PK-11195, 11C-PBR28, 11C-AC5216, 18F-PBR06, 18F-DPA-714, and 18F-GE-180 (12–17).
18F-GE-180 (flutriciclamide) is a novel high-affinity fluorinated TSPO-binding radiotracer (18). In recent studies, 18F-GE-180 showed higher binding affinity than 11C-PK-11195 in a rat model of stroke (19) and in acute neuroinflammation (20,21). This tracer also has been used to study microglial activation in an animal model of multiple sclerosis (22) and in the APPswe-PS1dE9 and PS2APP mouse models of AD (17,23). Furthermore, the first kinetic analysis in the human brain in healthy subjects has been performed (24).
In this study, we assessed the association of β-amyloid deposition and neuroinflammation in a longitudinal study using 11C-PIB and 18F-GE-180 in the APP23 mouse model of AD.
MATERIALS AND METHODS
Tracer Synthesis
11C-PIB and 18F-GE-180 were synthesized at the Radiopharmaceutical Chemistry Laboratory of Turku PET Centre. For 11C-PIB, desmethyl-PIB was labeled with 11C-methyl triflate, produced from 11C-CO2. 11C-PIB was formulated for injection in propylene glycol/ethanol/0.1 M phosphate buffer (2:1:14, v:v:v). The radiochemical purity exceeded 95% in all syntheses (n = 25).
18F-GE-180 was synthesized according to a previously published method (25). The molar activity of 18F-GE-180 was 2.0 ± 0.5 TBq/μmol at the end of synthesis (n = 13). Radiochemical purity was at least 98%.
Animals
All animal experiments were approved by the Regional State Administrative Agency for Southern Finland (ESAVI/4499/04.10.07/2016 and ESAVI/3899/04.10.07/2013). APP23 mice (n = 36; 30 female and 6 male) (Novartis Inc.) express human APP751swe driven by the neuron-specific mouse Thy-1.2 gene fragment as a promoter. Aβ-immunoreactive plaques develop progressively in the neocortex and hippocampus and are associated with dystrophic neurites and gliosis (26,27). All animals were group-housed under standard conditions (temperature, 21°C ± 3°C; humidity, 55% ± 15%; lights on from 6:00 a.m. until 6:00 p.m.) and had ad libitum soy-free chow (RM3 (E) soya-free, 801710; Special Diet Services) and tap water.
In Vivo Binding of 11C-PIB and 18F-GE-180
The in vivo pilot study was performed with 6 transgenic and 6 wild-type (WT) 26-mo-old mice. Both groups were studied using 11C-PIB and 18F-GE-180.
The in vivo longitudinal study from 17 to 23 mo of age started with 5 transgenic and 6 WT mice. Both groups were studied using 11C-PIB and 18F-GE-180. These mice were imaged at 17, 20, and 23 mo of age.
The mice were anesthetized with a 2.5% isoflurane–oxygen mixture 30 min before injection and then were injected intravenously with either 11C-PIB (injected dose, 10.05 ± 0.87 MBq) or 18F-GE-180 (injected dose, 10 ± 0.65 MBq) for scanning by an Inveon multimodality PET/CT scanner (Siemens Medical Solutions). A few drops of Oftagel (2.5 mg/g; Santen) were applied to the eyes of the animals to prevent eye dryness. The scanner has a 12.7-cm axial field of view and a 10-cm transaxial field of view, generating images from 159 transaxial slices. The mice were scanned for 10 min with CT for attenuation correction and anatomic reference, and immediately afterward the tracer was injected and a 60-min dynamic PET scan was started (51 frames: 30 × 10s, 15 × 60s, 4 × 300, and 2 × 600 s).
Analysis of PET Data
Image registration and analysis were performed using Inveon Research Workplace, version 3.0 (Siemens Medical Solutions). The dynamic PET images were coregistered with the CT images using the first 12 frames of the PET scan (2 min), and automatic rigid registration was applied. Registration was always assessed and manually corrected if needed. Afterward, the PET/CT images were manually coregistered with an averaged mouse MRI template, and standardized volumes of interest were placed in the frontal cortex (FC), parietotemporal cortex (PTC), cerebellum, hippocampus, and thalamus using the template as an anatomic reference (28). Different brain region volume-of-interest–to–cerebellum ratios were calculated for the late washout phase (50–60 min). Also, SUVs were calculated for the cerebellum to study changes over time in order to validate its use as a reference region (Supplemental Fig. 1; supplemental materials are available at http://jnm.snmjournals.org).
Ex Vivo Binding of 11C-PIB– and 18F-GE-180–Derived Radioactivity in Mouse Brain
For the ex vivo studies with 11C-PIB, 6 WT and 6 transgenic 26-mo-old mice were used (injected dose, 10.3 ± 1.0 MBq); for the ex vivo studies with 18F-GE-180, 4 WT and 6 transgenic 26-mo-old mice were used (injected dose, 10 ± 0.9 MBq). The mice lay on a heating pad and were kept under 2.5% isoflurane–oxygen anesthesia during the study.
The mice were sacrificed with cardiac puncture under deep anesthesia 10 min after 11C-PIB injection or 60 min after 18F-GE-180 injection. The whole intact brain was dissected and weighed, and the radioactivity in the brain was measured in the γ-counter (Wizard2 3″; PerkinElmer). The brain was then quickly frozen in isopentane (2-methylbutane; Sigma-Aldrich) on dry ice. Ten to sixteen coronal sections (20 μm thick) per studied area from each brain were obtained using a cryomicrotome (Leica CM3050S) and collected on a glass slide (Superfrost Ultra Plus; Thermo Fisher). The slides were exposed to an image plate (Fuji BAS Imaging Plate TR2025; Fuji Photo Film Co., Ltd.) for about 2 half-lives of the radioisotope in question.
After the exposure, the imaging plates were scanned using a BAS-5000 reader (Fuji) with a resolution of 25 μm, and the saved images on the computer were analyzed with AIDA Image Analyzer 4.5 software (version 4.5; Raytest). The regions of interest were manually drawn on the FC, PTC, striatum, thalamus, and cerebellum following a Franklin and Paxinos mouse brain atlas. The regions of interest were analyzed as photostimulated intensity per square millimeter and presented as ratios to cerebellum.
Immunohistochemical Staining
The β-amyloid deposits were visualized using an antibody for Aβ40-peptide (Anti-β-amyloid 1-40, rabbit polyclonal antibody; Millipore). Ionized calcium-binding adaptor molecule 1 (Iba1), an inflammation marker, is a microglia- and macrophage-specific calcium-binding protein. Iba1 was visualized with a specific Iba1 antibody (Wako Ltd.).
The fresh-frozen brain slides were thawed and fixed in 4% paraformaldehyde in phosphate-buffered saline, and the sections were incubated 10 min with 99% formic acid for the Aβ40-staining. They then were incubated for 30 min with the blocking agent and subsequently for 48 h with the primary antibody (dilution of 1:400). After a wash with 1 × phosphate-buffered saline + 0.3% Triton X-100, the slides were incubated for 1 h with the secondary antibody (biotin-goat anti-rabbit IgG [Invitrogen]; dilution of 1:400). An avidin–biotin complex kit (Vectastain Elite ABC-HRP Kit; Vector Laboratories) was used to effectively visualize the biotinylated antibodies in the stained tissues. The tissues were incubated with the avidin–biotin complex mix for 30 min followed by washing twice with 1× phosphate-buffered saline plus 0.3% Triton X-100 and once with only 1× phosphate-buffered saline. Finally, the brain sections were stained with SigmaFast 3,3′-diaminobenzidine tablets (Sigma-Aldrich) to develop a brownish color that is resistant to alcohol. The slides were afterward dehydrated in an alcohol series, dipped in xylene, and mounted with distrene plasticizer xylene (DPX Mountant for histology; Sigma). Images of the stained slides were taken with a Panoramic 250 slide scanner (3DHISTECH).
Data Analysis and Statistics
The results are reported as average ± SD when n was at least 3. All statistical analyses were calculated using Prism programs (version 5.01; GraphPad Software). Differences in 11C-PIB and 18F-GE-180 binding between APP23 transgenic and WT animals were analyzed using the nonparametric Mann–Whitney U test because of the small sample size. Correlation between 11C-PIB and 18F-GE-180 binding was tested using the Pearson correlation coefficient. Differences were considered statistically significant if the P value was less than 0.05.
RESULTS
In Vivo 11C-PIB and 18F-GE-180 Imaging
The study was initiated as a pilot using 26-mo-old mice. Because significant differences were detected in these animals, a longitudinal study starting at 17 mo and continuing until 23 mo was initiated, and these results were combined with the pilot results. 11C-PIB and 18F-GE-180 showed a good brain penetration in the in vivo studies as observed in time–activity curves (Supplemental Fig. 2).
In vivo 11C-PIB binding was clearly observed in cortical areas of transgenic mice (Fig. 1A). Ratios of FC, PTC, hippocampus, and thalamus to cerebellum in WT and transgenic mice at 17, 20, 23, and 26 mo were calculated. At 17 mo, the FC-to-cerebellum (P < 0.01), PTC-to-cerebellum (P < 0.05), and hippocampus-to-cerebellum (P < 0.05) ratios were already significantly higher in transgenic than in WT mice. These ratios increased significantly in transgenic mice until 26 mo, compared with WT mice (P < 0.001). The thalamus-to-cerebellum ratios were higher in transgenic than in WT mice only at 26 mo of age (P < 0.001) (Figs. 1B–1E).

(A) In vivo PET images of 11C-PIB in 26-mo-old transgenic (TG) and WT APP23 mice. (B–E) Ratios of FC (B), PTC (C), hippocampus (HIPPO) (D), and thalamus (THA) (E) to cerebellum (CB) from 17 to 26 mo of age. Dotted line separates data of pilot study from data of longitudinal study (n = 32). *P < 0.05. **P < 0.01. ***P < 0.001.
In vivo 18F-GE-180 PET binding was clearly observed in cortical areas of transgenic mice (Fig. 2A). At 17 mo, the FC-to-cerebellum (P < 0.05) and PTC-to-cerebellum (P < 0.05) ratios were already significantly higher in transgenic than in WT mice. These ratios increased significantly in transgenic mice until age 26 mo, compared with WT mice (P < 0.001). The hippocampus-to-cerebellum ratios were higher in transgenic than in WT mice starting at age 20 mo (P < 0.01), whereas the thalamus-to-cerebellum ratios were higher in transgenic than in WT mice only at age 26 mo (P < 0.05) (Figs. 2B–2E).

(A) In vivo PET images of 18F-GE-180 in 26-mo-old transgenic (TG) and WT APP23 mice. (B–E) Ratios of FC (B), PTC (C), hippocampus (HIPPO) (D), and thalamus (THA) (E) to cerebellum (CB) from 17 to 26 mo of age. Dotted line separates data of pilot study from data of longitudinal study (n = 30). *P < 0.05. **P < 0.01. ***P < 0.001.
The correlation between 11C-PIB and 18F-GE-180 for the FC-to-cerebellum, PTC-to-cerebellum, hippocampus-to-cerebellum, and thalamus-to-cerebellum ratios in transgenic mice, combining all the studied time points, was subsequently calculated. Significant correlations were found between 11C-PIB and 18F-GE-180 binding for the PTC-to-cerebellum (Pearson r = 0.7475, P = 0.0006) and thalamus-to-cerebellum (Pearson r = 0.6446, P = 0.0052) ratios. In contrast, the FC-to-cerebellum (r = 0.2034, P = 0.43) and hippocampus-to-cerebellum (r = 0.1485, P = 0.5871) ratios showed only a poor correlation (Fig. 3). Furthermore, we calculated the ratio and percentage increase from 17 to 20, 23, and 26 mo in the transgenic mice for 11C-PIB and 18F-GE-180, as shown in Table 1. In this table, we can observe that the 11C-PIB percentage increase is progressive in all regions, reaching over a 100% increase for the FC-to-cerebellum, PTC-to-cerebellum, and hippocampus-to-cerebellum ratios and close to 100% for the thalamus-to-cerebellum ratio at 26 mo. The 18F-GE-180 increases in the same period were much smaller, at 1% and 2% for the hippocampus-to-cerebellum and FC-to-cerebellum ratios, respectively, and 14% and 23% for the PTC-to-cerebellum and thalamus-to-cerebellum ratios at 26 mo.
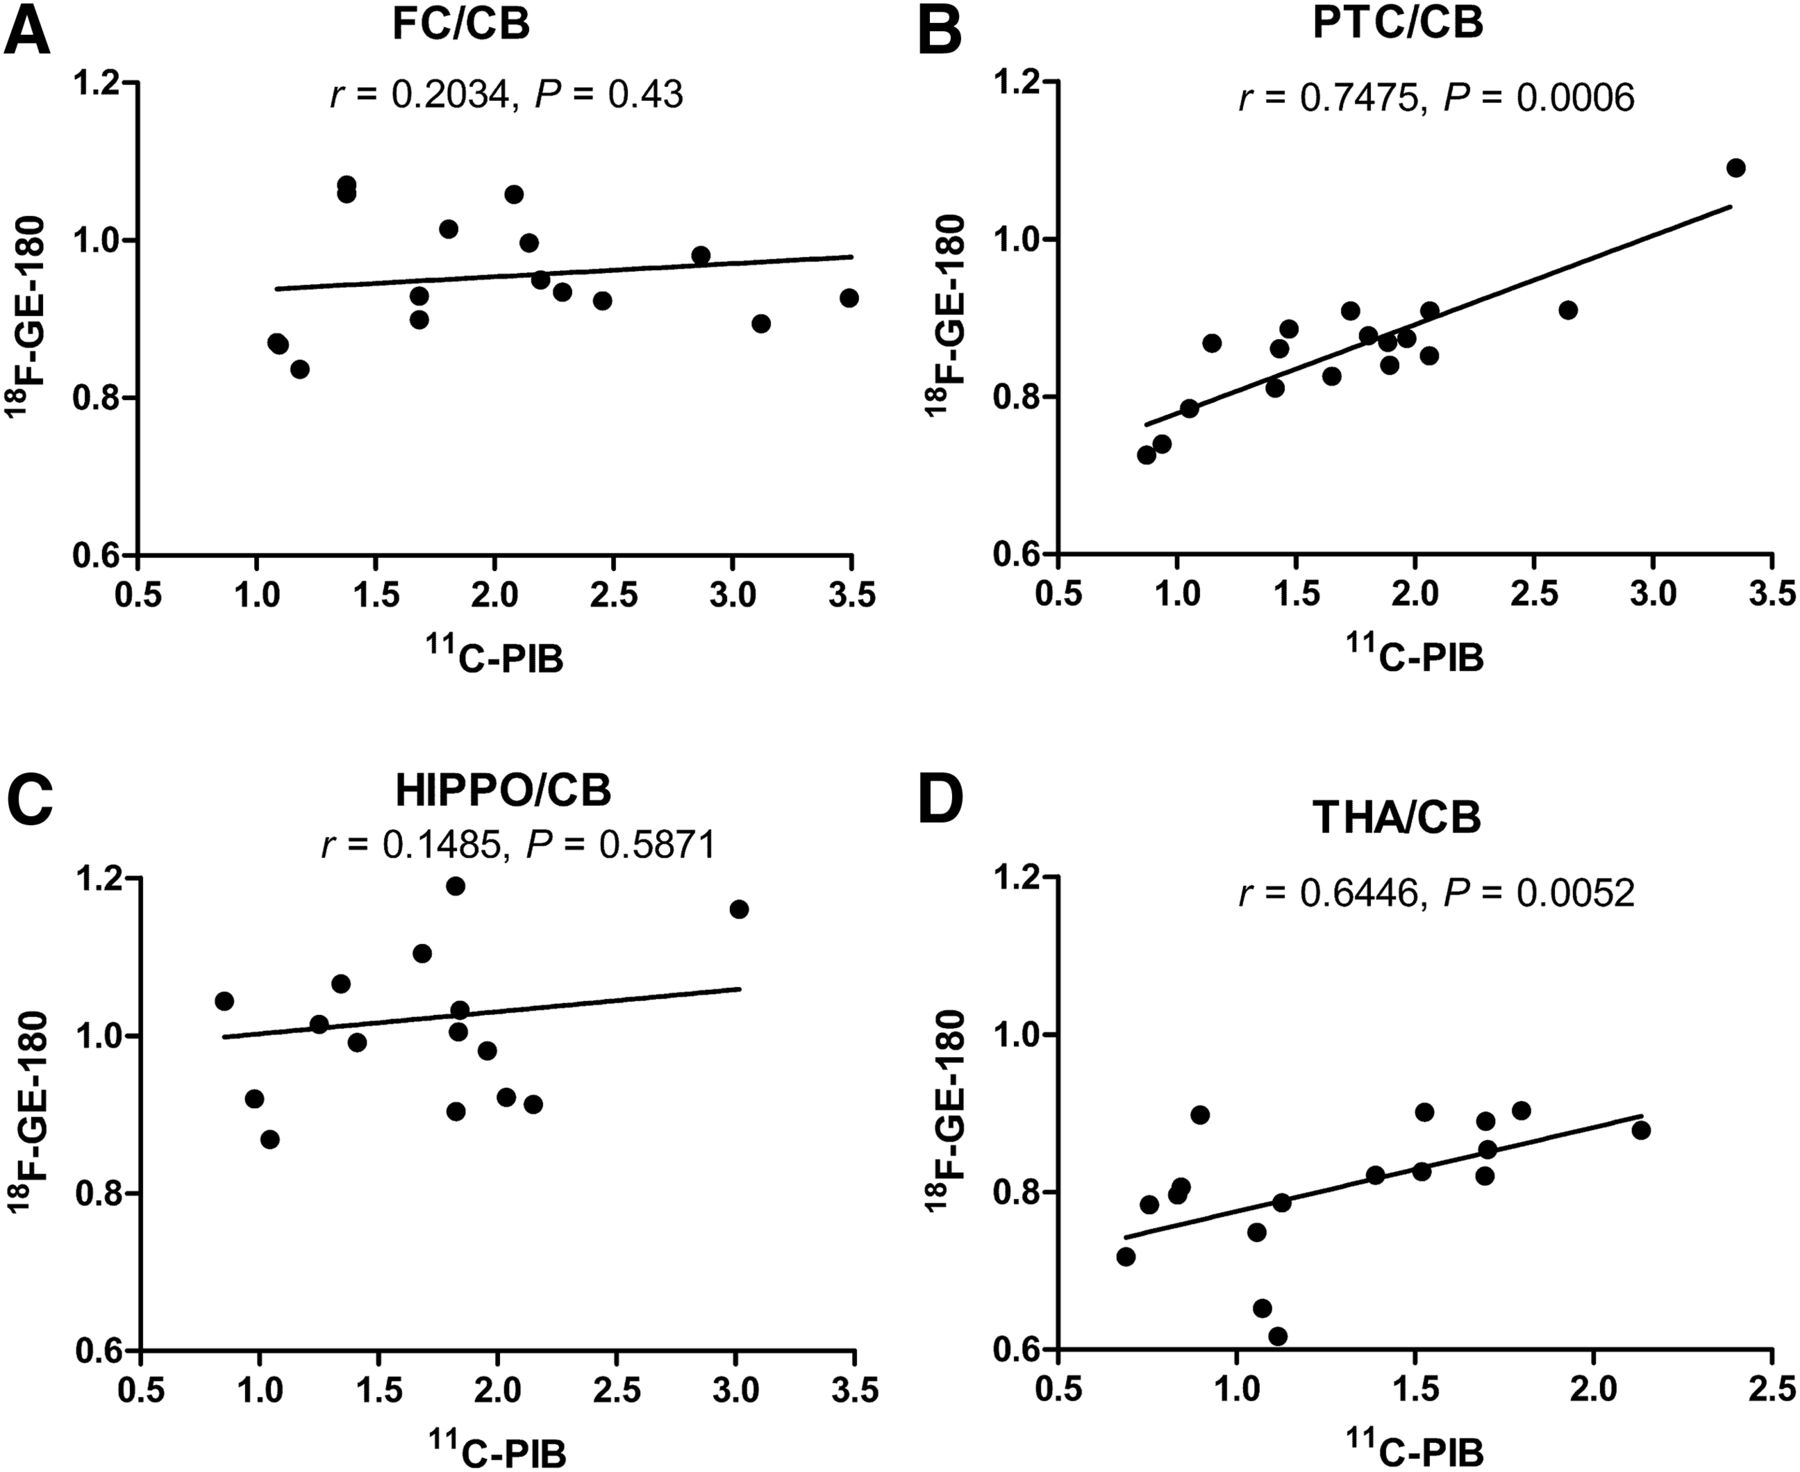
Correlation of the ratios of FC (A), PTC (B), hippocampus (HIPPO) (C), and thalamus (THA) (D) to cerebellum (CB) between 11C-PIB and 18F-GE-180 in transgenic APP23 mice from 17 to 26 mo of age, calculated with Pearson correlation (n = 17).
Ratio and Percentage Increase from 17 to 20, 23, and 26 Months in APP23 Transgenic Mice
Ex Vivo 11C-PIB Binding and Immunohistochemistry
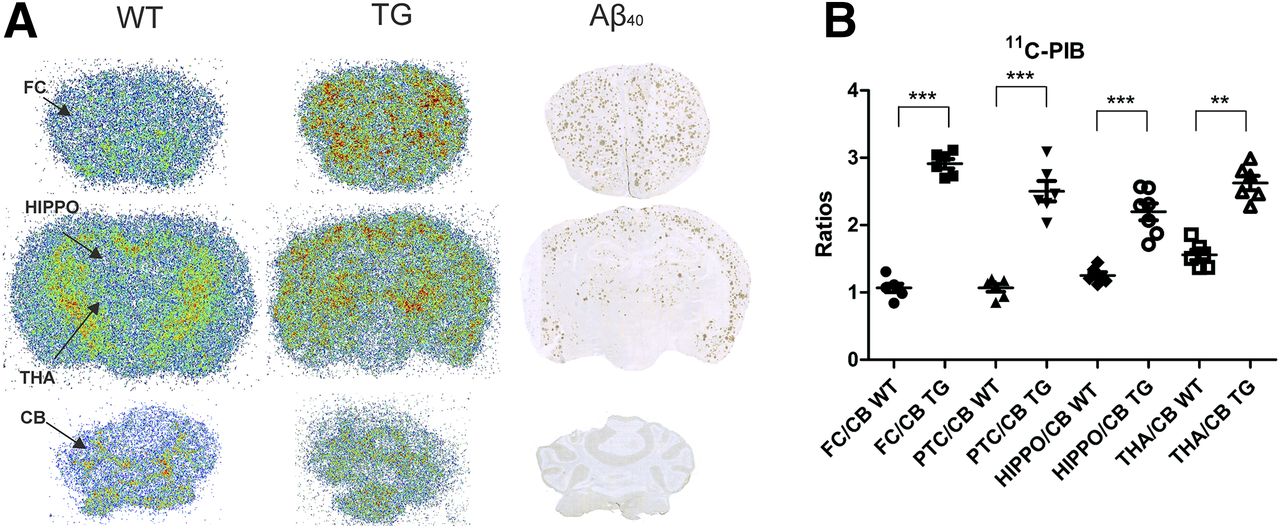
Autoradiographic images of 26-mo-old WT and transgenic 11C-PIB–injected mice and immunohistochemical staining of Aβ40 in the same transgenic mouse showed the colocalization of 11C-PIB binding and Aβ40-deposition in cortical areas, hippocampus, and thalamus. Neither specific 11C-PIB binding nor Aβ40-deposition could be detected in the cerebellum (Fig. 4A). FC-to-cerebellum (P < 0.001), PTC-to-cerebellum (P < 0.001), hippocampus-to-cerebellum (P < 0.001), and thalamus-to-cerebellum (P < 0.01) ratios were higher in transgenic than in WT mice (Fig. 4B).

(A) Representative ex vivo autoradiography images of 11C-PIB binding in 26-mo-old transgenic (TG) and WT APP23 mice together with Aβ40-immunostaining (A). (B) Ratios of FC, PTC, hippocampus (HIPPO), and thalamus (THA) to cerebellum (CB). **P < 0.01. ***P < 0.001.
Ex Vivo 18F-GE-180 Binding and Immunohistochemistry
Autoradiographic images of 26-mo-old WT and transgenic 18F-GE-180–injected mice and immunohistochemistry staining of Iba1 in the same transgenic mice showed colocalization of 18F-GE-180 binding and Iba1 expression in cortical areas, hippocampus, and thalamus (Fig. 5A). FC-to-cerebellum, PTC-to-cerebellum, hippocampus-to-cerebellum (P < 0.01), and thalamus-to-cerebellum (P < 0.05) ratios were significantly higher in transgenic than in WT mice (Fig. 5B).
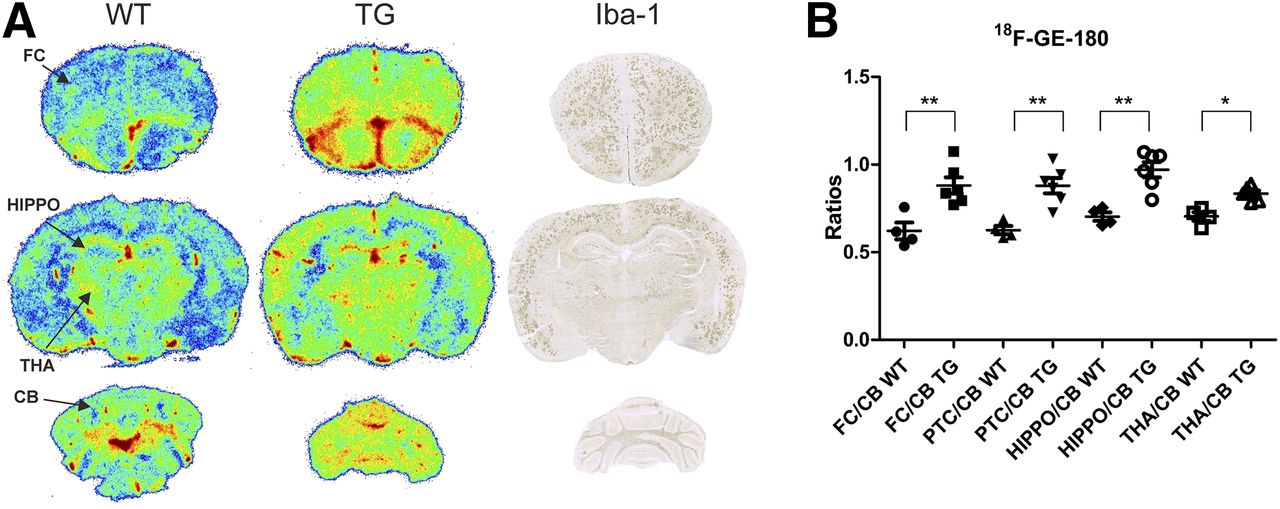
(A) Representative ex vivo brain autoradiography images of 18F-GE-180 binding in 26-mo-old transgenic (TG) and WT APP23 mice together with Iba1 immunostaining. (B) Ratios of FC, PTC, hippocampus (HIPPO), and thalamus (THA) to cerebellum (CB). *P < 0.05. **P < 0.01.
The increased 11C-PIB and 18F-GE-180 uptake in 26-mo-old transgenic versus WT mice in vivo and ex vivo was also compared (Supplemental Table 1). The in vivo and ex vivo results were similar for the cortical areas, whereas some variation was found in hippocampus and thalamus uptake between in vivo and ex vivo studies.
DISCUSSION
Although the findings from preclinical imaging studies cannot be directly extrapolated to humans, they are valuable when evaluating novel tracers and transgenic animal models and performing preclinical drug efficacy studies. Small-animal PET imaging of β-amyloid with 11C-PIB has proved difficult, with major differences among AD animal models. The differences in the quantity and type of β-amyloid plaques has been suggested to be a key factor in 11C-PIB binding in different animal models of AD, as shown by Snellman et al. (10), with APP23 mice having very high 11C-PIB binding compared with the very low 11C-PIB binding observed in Tg2576 and APPswe-PS1dE9 (APP/PS1) animals despite a similar total plaque load. For this reason, we decided to use the APP23 mouse model for this study.
11C-PIB and 18F-GE-180 In Vivo Binding Association
Here, we studied the association between β-amyloid deposition measured with 11C-PIB and neuroinflammation measured with 18F-GE-180 in the FC, PTC, hippocampus, and thalamus of APP23 transgenic mice from 17 to 26 mo of age. The results showed a good positive correlation between 11C-PIB and 18F-GE-180 binding ratios calculated for PTC and thalamus. In contrast, the obtained binding ratios for FC and hippocampus showed a poor correlation; whereas the 11C-PIB binding ratios increased significantly over the time of the study in FC and hippocampus, a similar increase was not observed with 18F-GE-180, as shown in Table 1. These results indicate a plateau of 18F-GE-180 binding in the FC and hippocampus, regions where the β-amyloid deposition starts in this mouse model, whereas in the PTC and thalamus, 18F-GE-180 binding continued to increase, matching the delayed β-amyloid deposition in these areas (29). Previously, Maeda et al. found a good correlation between the binding of an older TSPO tracer (11C-AC5216) and increased age in the hippocampus of APP23 mice, but no correlation between the binding potentials of 11C-AC5216 and 11C-PIB in the same brain region (14). The difference with our study could be explained by the lack of a detectable TSPO increase with 11C-AC5216 at very early stages of the disease (12–15 mo) and by the higher affinity of the 18F-GE-180 used in the current study than of 11C-AC5216. A recent clinical study with AD patients showed a clear 18F-DPA-714 binding in 11C-PIB–positive prodromal patients, without a further increase of the 18F-DPA-714 binding in AD-demented patients (30). This outcome is in accordance with our current results showing no increase in 18F-GE-180 binding in the FC and hippocampus.
11C-PIB and 18F-GE-180 Binding
In the current study, the 11C-PIB binding ratios in the APP23 transgenic mice reached a value of between 2 and 3 at the older age groups in the cortical areas, in accordance with previous studies with the same mouse model (6). In similar studies using 18F-AV-45 in APP/PS1 and APP/PS1-21 mice, however, the maximum ratio was approximately 1.1 (31,32), making the ratio increase in APP23 mice 20–30 times higher. These 3 mouse models have a similar amount of β-amyloid deposition in old age, but the types of plaque differ. The broad range of β-amyloid detection in the APP23 mouse with 11C-PIB makes this combination of model and tracer a good choice for testing antiamyloid therapies.
Increased microglial activation has also been reported in postmortem brain samples of AD patients, although the role of microglia in AD is still controversial (33,34). In the APP23 animal model, previous studies have been performed with older TSPO radiotracers, showing increased binding in the cortical regions (14,35). In the APP/PS1 model, increased neuroinflammation has been observed in 16- to 19-mo-old mice with 11C-PK-11195 (36) whereas neuroinflammation was not detected in younger (13- to 15-mo-old) mice with 11C-PK-11195 (12). Studies with 11C-PBR28 have shown inflammation in the brains of 6-mo-old 5XFAD mice (13).
In addition to the 18F-GE-180, used in this study, several 18F-labeled TSPO tracers, such as 18F-PBR06 and 18F-DPA-714, have been used to detect neuroinflammation in different animal models of β-amyloid deposition. In vivo studies using 18F-PBR06 differentiated 15- to 16-mo-old APPL/S mice from age-matched WT mice (15) whereas longitudinal studies with 18F-DPA-714 in APP/PS1 and APP/PS1-21 mouse models have shown increased TSPO tracer binding compared with WT littermates at different ages (16,32). Furthermore, recent studies have used 18F-GE-180 to detect neuroinflammation in APP/PS1 and PS2APP mice (17,23).
Cerebellum as a Reference Region for Analysis
In our study, we used the cerebellum as the reference region for in vivo and ex vivo analyses of 11C-PIB and 18F-GE-180 binding. Use of the cerebellum as the reference region is well established for 11C-PIB, but the choice is more controversial for analyzing the binding of TSPO tracers. Our use of the cerebellum as the reference region for 18F-GE-180 was based on our PET imaging data showing no differences in 18F-GE-180 SUVs in the cerebellum between transgenic and WT mice at any age (Supplemental Fig. 1).
It has been previously demonstrated that use of a pseudoreference region for TSPO tracer binding analyses increases the sensitivity of the PET analysis if no differences are found in the SUVs in the reference area (37). In 2 recent animal imaging studies, use of the cerebellum as a reference region decreased intragroup variability (16,38).
CONCLUSION
The neuroinflammation increase detected in the APP23 model using the TSPO radiotracer 18F-GE-180 was relatively modest compared with the increase in β-amyloid detected with 11C-PIB. Furthermore, the signal increase of 18F-GE-180 plateaued at an earlier stage of pathogenesis, whereas the amyloidosis continued to increase. Given these findings, we suggest that TSPO-binding radiotracers are good tools for early pathogenesis detection in AD but might not be so suitable for long-term monitoring of disease progression.
DISCLOSURE
This study was supported by the EC 7th Framework Programs HEALTH-F2-2011-278850 (INMiND), by clinical grants from the Turku University Hospital (ERVA, grants 13250 and 13464), and by the Academy of Finland (grant 266891). Novartis Inc. provided the APP23 mice for this study. No other potential conflict of interest relevant to this article was reported.
Footnotes
Published online Oct. 6, 2017.
- © 2018 by the Society of Nuclear Medicine and Molecular Imaging.
REFERENCES
- Received for publication July 4, 2017.
- Accepted for publication September 13, 2017.


