


Abstract
Experimental and clinical evidence suggests that neuroinflammation, triggered by epileptogenic insults, contributes to seizure development. We used translocator protein–targeted molecular imaging to obtain further insights into the role of microglial activation during epileptogenesis. Methods: As epileptogenic insult, a status epilepticus (SE) was induced in rats by lithium pilocarpine. Rats were subjected to 11C-PK11195 PET scans before SE; at 4 h after SE; at 1, 2, 5, 7, 14, and 22 d after SE; and at 14–16 wk after SE. For data evaluation, brain regions were outlined by coregistration with a standard rat brain atlas, and percentage injected dose/cm3 and binding potential (simplified reference tissue model with cerebellar gray matter as a reference region) were calculated. For autoradiography and immunohistochemical evaluation, additional rats were decapitated without prior SE or 2, 5, or 14 d after SE. Results: After SE, increases in 11C-PK11195 uptake and binding potential were evident in epileptogenesis-associated brain regions, such as the hippocampus, thalamus, or piriform cortex, but not in the cerebellum beginning at 2–5 d and persisting at least 3 wk after SE. Maximal regional signal was observed at 1–2 wk after SE. Autoradiography confirmed the spatiotemporal profile. Immunohistochemical evaluation revealed microglial and astroglial activation as well as neuronal cell loss in epileptogenesis-associated brain regions at all investigated time points. The time course of microglial activation was consistent with that demonstrated by tracer techniques. Conclusion: Translocator protein–targeted PET is a reliable tool for identifying brain inflammation during epileptogenesis. Neuroinflammation mainly affects brain regions commonly associated with seizure generation and spread. Definition of the time profile of neuroinflammation may facilitate the development of inflammation-targeted, antiepileptogenic therapy.
Brain insults such as traumatic brain injury, stroke, or status epilepticus (SE) may initiate a cascade of alterations in the brain, mediating the development of epilepsy (1,2). Because the mechanisms involved in epileptogenesis remain poorly understood, neither predictive biomarkers to stratify patients at risk of developing epilepsy nor epilepsy-preventive therapies have been identified to date (3,4). Accumulating evidence suggests that neuroinflammation, initiated by brain injury and sustained because of insufficient control by endogenous antiinflammatory mechanisms, contributes to epileptogenesis (5,6). Several immunohistochemical studies in post-SE animal models have demonstrated prolonged activation of brain resident microglia and astrocytes and release of proinflammatory mediators by these cells during both epileptogenesis and the chronic phase of epilepsy (7,8). Similar findings have been reported in surgically resected brain tissue of patients with temporal lobe epilepsy (TLE) (7,9).
Continuous progress in preclinical imaging modalities such as dedicated small-animal PET enables repeated quantifiable evaluation of brain inflammation and other epileptogenesis-associated processes by means of longitudinal noninvasive in vivo imaging, holding potential for translation into the clinic (10). The translocator protein (TSPO), also known as the peripheral benzodiazepine receptor, is upregulated by activated microglia and macrophages and thus represents a suitable target for PET imaging of neuroinflammation after brain insults (11). PET imaging in TLE patients identified increased TSPO binding of the radioligand 11C-PBR28 in temporal structures both ipsilateral and contralateral to the seizure focus (12). Initial PET imaging studies in a post-SE rat model have revealed elevated distribution volume of the TSPO radiotracer 18F-PBR111 in epilepsy-associated brain regions, such as the hippocampus and the amygdala, at 1–6 wk after kainate-induced SE (8,13). However, to our knowledge no experimental TSPO in vivo imaging studies assessing the complete time course of brain inflammation during insult-induced epileptogenesis have been published to date. Establishing such data may be important for the subsequent development of image-guided antiepileptogenic interventions. Accordingly, we sought to obtain further insights using a post-SE rat model, longitudinal PET imaging with the gold-standard TSPO tracer 11C-PK11195, autoradiography with the novel TSPO ligand 18F-GE180, and immunohistology for validation.
MATERIALS AND METHODS
Animals
Female Sprague–Dawley rats (n = 34) were purchased from Harlan Italy at a body weight of 200–220 g and housed either in pairs in individually ventilated biocontainment units under a 14–10 h light–dark cycle (rats used for imaging experiments) or in groups of 5 in open cages under a 12–12 h light–dark cycle (rats used for immunohistochemical analyses and autoradiography). Standard laboratory chow (Altromin 1324) and water were freely accessible. Before being subjected to experiments, animals were allowed to adapt to housing conditions and repetitive handling for at least 1 wk. Experiments were conducted in accordance with European Communities Council Directives 86/609/EEC and 2010/63/EU and were formally approved by the responsible local authority.
SE Induction
Unless stated otherwise, all chemicals were of analytic grade and purchased from Sigma-Aldrich or Merck. SE was induced in rats (n = 31) as described elsewhere (14). Shortly, 14–16 h, after the administration of lithium chloride (127 mg/kg, orally) and 30 min after methyl scopolamine (1 mg/kg, intraperitoneally), injection of pilocarpine (30 mg/kg, followed by up to 3 times 10 mg/kg, intraperitoneally) was repeated until SE, which was characterized by the onset of repetitive generalized convulsive seizures (stage 4 or 5) (15) without intermediate recovery of normal behavior. SE was interrupted after 90 min by administration of diazepam (10 mg/kg intraperitoneally; Ratiopharm). If needed, diazepam injection was repeated up to 2 times (second repetition, 5 mg/kg) at 15-min intervals. Twenty-nine of 31 animals developed self-sustaining SE, requiring an average pilocarpine dose of 39.6 ± 1.2 mg/kg. The 2 rats in which SE could not be induced were excluded from all further experiments. The overall mortality rate was 13.8%, with deaths occurring within the first 48 h after SE. Age-matched control rats (n = 3) for histologic analysis were treated identically but received saline instead of pilocarpine. After SE, rats were hand-fed with mashed laboratory chow and received injections of glucose electrolyte solution (Sterofundin HEG-5 [Braun]; 5 mL subcutaneously). All rats exhibited spontaneous seizures at least 10 wk after SE, monitored by visual inspection during routine presence of experimenters in the room.
PET Imaging Procedure
11C-PK11195 was synthetized by transfer of 11C-CH3I into a reaction mixture of 2 mg of precursor ((R)-N-desmethyl-PK11195; ABX GmbH) and 2 mg of NaH (60% in mineral oil) in 400 μL of dimethylformamide, followed by heating to 60°C for 4 min. The mixture was diluted with 1.5 mL of high-performance liquid chromatography eluent (60% aqueous ethanol solution) at room temperature and injected into a semipreparative reversed-phase chromatography system (Luna column; Phenomenex). The purified fraction was mixed with water and trapped on a tC18 SepPak cartridge (Waters, preconditioned with ethanol and water). The product was eluted using pure ethanol. For formulation, the ethanol solution of 11C-PK11195 was diluted with saline, reaching a final ethanol concentration of 28.4% ± 2.6%.
Rats (n = 16) were subjected to 11C-PK11195 PET scans before SE (n = 8); at 4 h after SE (n = 6); at 1 (n = 6), 2 (n = 5), 5, 7, 14 (n = 6, respectively), and 22 d (n = 7) after SE; and at 14–16 wk (n = 4) after SE. Because of the availability of 11C-PK11195, not all animals could be scanned at all time points. Repeated scans within the same animals were performed wherever possible. All imaging procedures were performed under isoflurane anesthesia including humidification (1.5%–2.5% at an oxygen flow of 1.0 L/min). Animals were continuously warmed and monitored for heart and respiration rate (BioVet; m2m imaging). PET images were acquired using a dedicated small-animal PET camera (Inveon PET; Siemens). Rats were positioned prone in the imaging bed (Minerve), with the brain at the center field of view. 11C-PK11195 (21.01 ± 0.87 MBq) was injected via a catheter inserted into a lateral tail vein, and a dynamic 60-min PET acquisition was started. List-mode data were histogrammed to 32 frames of 5 × 2, 4 × 5, 3 × 10, 8 × 30, 5 × 60, 4 × 300, and 3 × 600 s. Images were reconstructed using an iterative algorithm (3-dimensional ordered-subset expectation maximization/fast maximum a priori [MAP] algorithm) with standard corrections for decay, randoms, and scatter. For attenuation correction, 20-min 57Co transmission scans were used. To obtain anatomic information for image analysis, a standard low-resolution CT scan (Inveon CT; Siemens) was obtained after PET imaging.
PET Image Analyses
PET images were coregistered to an MRI template using PMOD software (PMOD Technologies), and an atlas based on Schwarz et al. (16) was applied. 11C-PK11195 uptake was calculated as percentage injected dose per cubic centimeter of tissue in the dorsal and ventral hippocampus, piriform and motor cortices, amygdala, thalamus, caudate putamen, substantia nigra, and cerebellum. For kinetic modeling, the simplified reference tissue model (17) with cerebellar gray matter as a reference tissue and an average χ2 of 5.02 ± 0.22 as validation value was used to assess the TSPO binding potential (BPND) (18,19).
Coregistered images were further used for statistical parametric mapping (SPM). Differences in 11C-PK11195 uptake between baseline and each time point after SE were analyzed by a 2-sample unpaired t test using MATLAB software (The MathWorks) and SPM12 (University College London). A significance level threshold of 0.001 (uncorrected for multiple comparisons) and a minimum cluster size of 100 voxels were selected. T-maps resulting from each comparison were loaded into PMOD, and the threshold was set individually depending on the group size for each time point.
Autoradiography
Because of insufficient availability of 11C-labeled tracers during the course of the study, for autoradiography we used the novel TSPO ligand 18F-GE180 (20). Compared with 11C-PK11195, 18F-GE180 shows a comparable distribution pattern, but higher specific binding, as shown in lipopolysaccharide-induced brain inflammation (18). For producing 18F-GE180, kryptofix 2.2.2 (4 mg, 10 μmol), potassium bicarbonate (1 mg, 10 μmol), and acetonitrile (0.5 mL) were mixed with 18F in water. This reaction mixture was dried under a stream of argon at 100°C. Subsequently, without prior cooling of the mixture, mesylate precursor (GE Healthcare; 0.5–1.0 mg) dissolved in 1 mL of acetonitrile was added, followed by 10 min of heating at 100°C. After being cooled, the crude product was purified by high-performance liquid chromatography (ACE 5 C18 column; Hichrom). The purified fraction was diluted with water, adsorbed on a tC18 Sep-Pak SPE cartridge (Waters), and eluted with ethanol.
Brain sections were preincubated for 30 min at room temperature in 50 mM phosphate-buffered saline (pH 7.4), followed by incubation with 18F-GE180 (∼2 MBq per 100 mL phosphate-buffered saline) for 30 min. Slides were then washed with ice-cold phosphate-buffered saline and rinsed in ice-cold distilled water 3 times to remove buffer salts. Subsequently, slides were dried under a stream of air at room temperature, placed in a cassette, and exposed to a high-resolution phosphor imaging plate (PerkinElmer) for 15 min. A calibration curve was obtained by including a dilution series with known activity concentrations (range, 100–450 kBq/mL in 1.5 μL) on paper squares mounted to a microscope slide during each exposure (Supplemental Fig. 1; supplemental materials are available at http://jnm.snmjournals.org). The plate was then digitized in a Cyclone scanner (PerkinElmer). Images were coregistered to a 3-dimesional volume of interest atlas, using PMOD software. Gray-scale values were quantified in dorsal and ventral hippocampus, entorhinal and piriform cortices, amygdala, and thalamus. Activity concentration (Bq/pixel) was calculated by interpolating these values to the calibration curve.
Immunohistochemistry
Rats were decapitated 2 (n = 4), 5 (n = 5), or 14 d (n = 4) after SE or without prior SE (controls, n = 3). Brains were immediately removed, covered with tissue-freezing medium (Jung), and snap-frozen. Coronal slices (14-μm-thick) at 0.0, −3.6, and −5.2 mm relative to bregma (21) were cut and mounted on Histobond slides (Marienfeld) using a cryostat (HM560; Microm). Brain tissue was stained for microglia (mouse-antirat CD11b; Serotec), astrocytes (rabbit-antiglial-fibrillary-acidic-protein [GFAP]; Dako), and neurons (mouse-antineuronal-nuclear-antigen [NeuN]; Millipore) using a standard protocol (22).
Microglial and astroglial activation in CD11b- and GFAP-stained sections of piriform and entorhinal cortices, hippocampus (CA1, CA3a, CA3c), thalamus, and amygdala were semiquantitatively analyzed according to a slightly modified version of a ranking scale described elsewhere (23): 0, resting, <10% activated cells; 1, mostly resting, approximately 30% activated cells; 2, approximately 60% activated cells, some resting; 3, >90% activated cells, densely packed. The severity of neuronal damage in NeuN-stained sections was semiquantitatively assessed as described recently (22): 0, no obvious neuronal cell loss; 1, <20% neuronal cell loss; 2, 20%–50% neuronal cell loss; 3, >50% neuronal cell loss. Microglial, astroglial, and neuronal scores were each averaged for the hippocampal subregions as well as for the different brain sections. All immunohistochemical analyses were performed in a masked fashion at 100× magnification.
Statistical Analysis
All data are mean ± SEM. Statistical analyses were performed using Prism 5 software (GraphPad Software). 11C-PK11195 in vivo uptake and BPND as well as 18F-GE180 in vitro binding were analyzed by 1-way ANOVA, followed by Dunnett multiple-comparison test comparing baseline to each time point after SE. The Pearson correlation test was used to test for correlation between 11C-PK11195 in vivo data and 18F-GE180 in vitro binding. Nonparametric data resulting from semiquantitative analysis of immunohistochemical stainings were analyzed by Kruskal–Wallis test, followed by Dunn post hoc test comparing the control group with the SE groups at each time point. The Spearman rank correlation test was used to test for correlation of immunohistochemistry scores with 11C-PK11195 in vivo BPND and 18F-GE180 in vitro binding, respectively. If not stated otherwise, values of P less than 0.05 were considered statistically significant.
RESULTS
Time Profile of 11C-PK11195 PET During Epileptogenesis
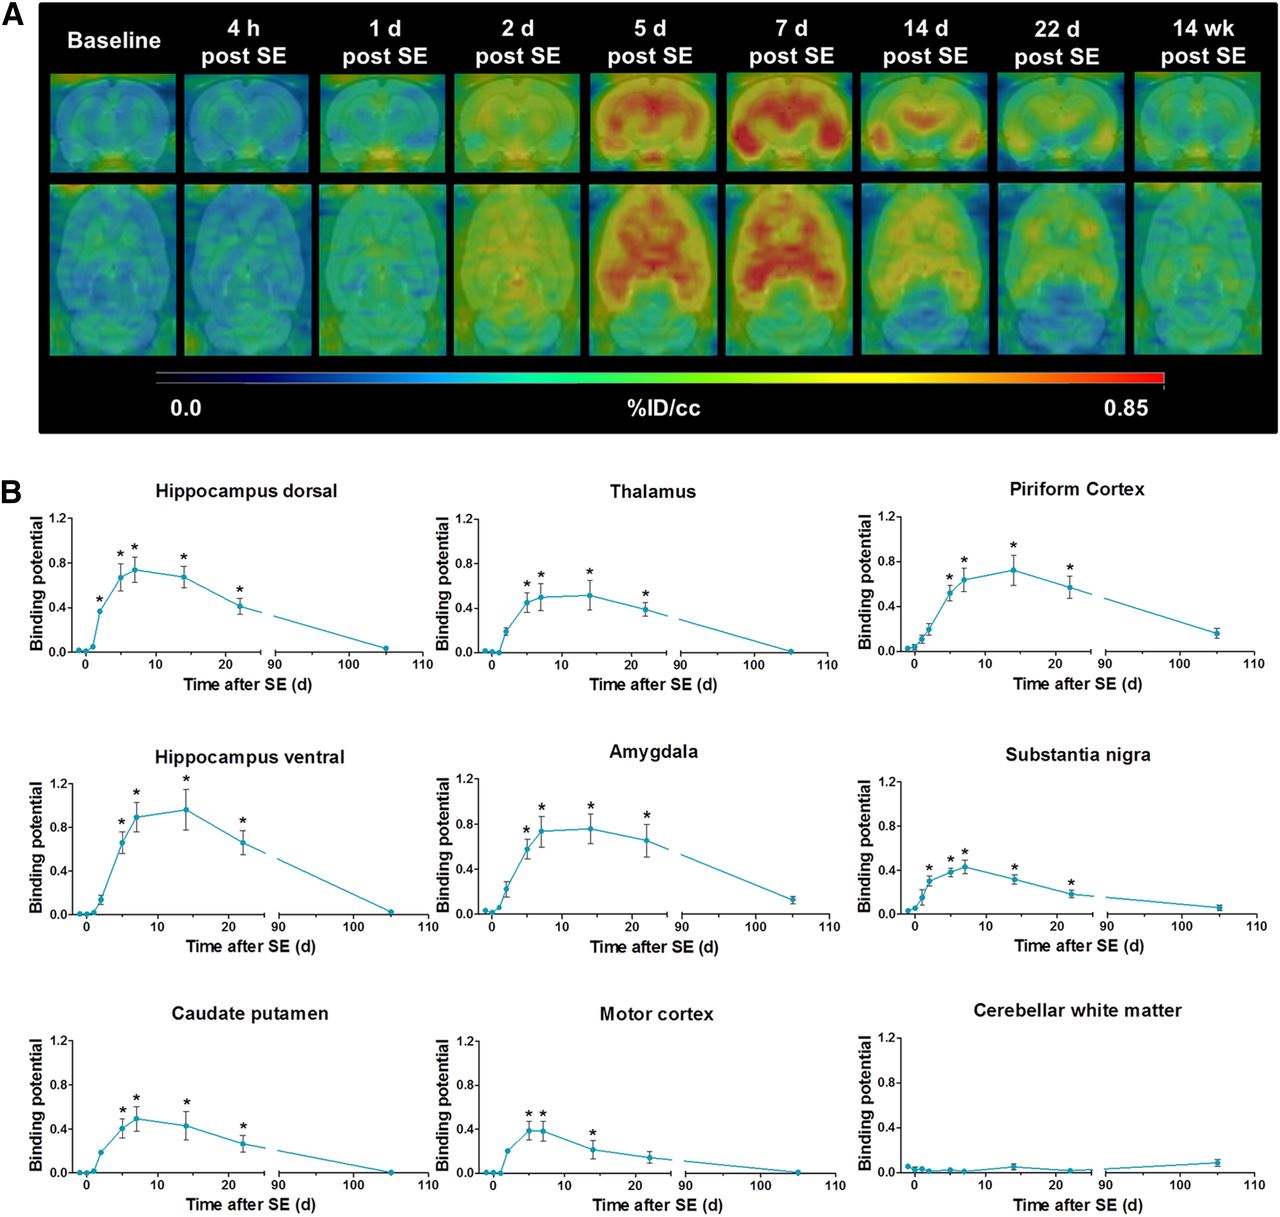
At baseline, regional brain 11C-PK11195 uptake values ranged from 0.276 ± 0.020 %ID/cm3 in the motor cortex to 0.383 ± 0.027 %ID/cm3 in cerebellar white matter (Supplemental Table 1). After SE, 11C-PK11195 uptake was elevated in most brain regions, including those associated with epileptogenesis (hippocampus, amygdala, piriform cortex, thalamus) but not the cerebellum (Fig. 1A; Supplemental Table 1). The increase in TSPO binding was initially observed 2 d after SE (ranging from 1.34-fold increase compared with baseline in the piriform cortex, P < 0.01, to 1.64-fold increase in the motor cortex, P < 0.001) and reached its peak approximately 7 d after SE (ranging from 1.43-fold increase compared with baseline in the substantia nigra to 2.08-fold increase in the ventral hippocampus, P < 0.001, respectively). In affected regions, 11C-PK11195 uptake remained significantly above baseline values up to 3 wk after SE and subsequently declined toward baseline at 14–16 wk after SE.

(A) Representative coronal and horizontal brain images of 11C-PK11195 uptake (%ID/cm3) before and at different time points during epileptogenesis. (B) 11C-PK11195 BPND analyzed by simplified reference tissue model using cerebellar gray matter as reference. Data are mean ± SEM, with a group size of n = 4–8 per time point. Statistical analysis was performed by 1-way ANOVA and Dunnett post hoc test. *Significant differences compared with baseline (P < 0.05).
TSPO BPND values of 11C-PK11195 tended to zero in all analyzed regions at baseline (Fig. 1B). Over the course of epileptogenesis, BPND was elevated in all analyzed regions except cerebellar white matter. The time course of 11C-PK11195 BPND was generally comparable to 11C-PK11195 uptake. Interestingly, peak BPND was later than that of uptake values, with maximal BPND observed at 14 d in the ventral hippocampus and piriform cortex. Maximum BPND values increased up to 0.96 ± 0.18 in the ventral hippocampus (P < 0.001). BPND remained significantly elevated until at least 3 wk after SE and receded to baseline levels over the following weeks. No increases in BPND values were observed in cerebellar white matter at any investigated time points.
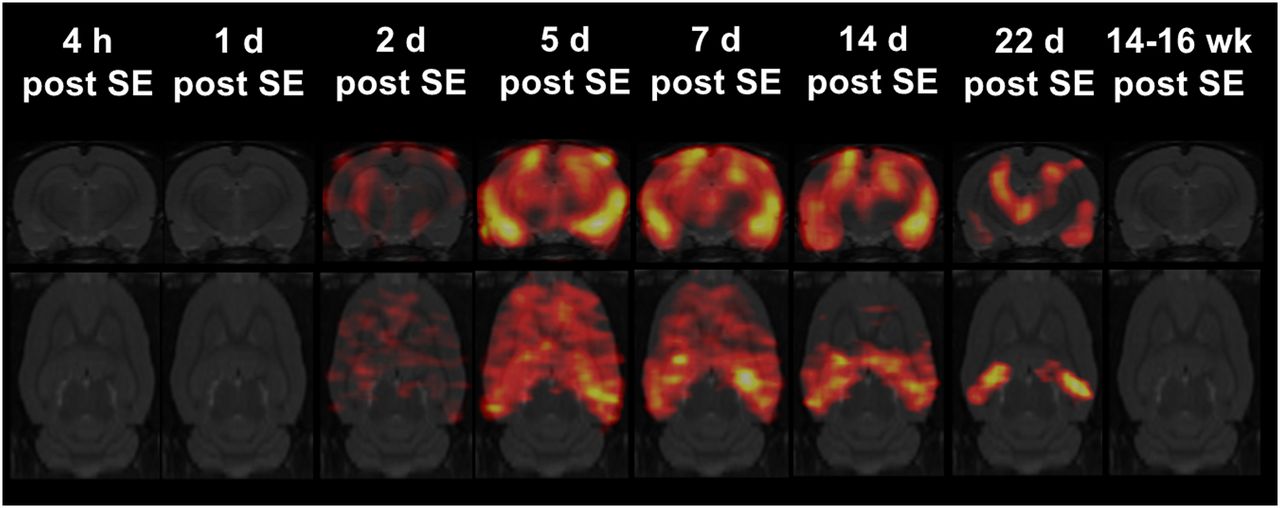
Statistical parametric mapping of 11C-PK11195 uptake during epileptogenesis revealed a spatiotemporal profile corresponding to that demonstrated by region-of-interest analysis (Fig. 2). Significant changes were present only between 2 d and 3 wk after SE. At approximately 7 d, increased TSPO uptake was observed in all brain regions except the cerebellum. Subsequently, 11C-PK11195 uptake remained prominent in epileptogenesis-associated brain regions such as the hippocampus, the amygdala, or the piriform cortex but was clearly decreased in other regions (Fig. 2).

Statistical parametric mapping analysis of 11C-PK11195 uptake during epileptogenesis using SPM12 software. Coronal and horizontal t-maps resulting from comparisons of 11C-PK11195 uptake between baseline and each time point after SE (at baseline [n = 8]; at 4 h [n = 6] after SE; at 1 [n = 6], 2 [n = 5], 5, 7, 14 [n = 6, respectively], and 22 d [n = 7] after SE; and at 14–16 wk [n = 4] after SE; t test, P < 0.001, minimum cluster size of 100 voxels).
In individual animals, but not on a group level, visual analysis of PET uptake images at 14–16 wk after SE (chronic epilepsy) revealed moderately increased 11C-PK11195 signal in the hippocampus, amygdala, piriform, and entorhinal cortices (2/4 rats), and thalamus (1/4 rats).
18F-GE180 In Vitro Autoradiography
Correlation analysis between activity concentrations of the calibration curve and activity counts measured by phosphor imaging resulted in an r-value of 0.98 (P < 0.0001, Supplemental Fig. 1). Test–retest variability was 3.10% ± 0.78%. In brain sections of control animals, 18F-GE180 in vitro binding to TSPO ranged from 2.44 ± 0.16 Bq/pixel in the piriform cortex to 3.65 ± 0.22 Bq/pixel in the hippocampus. During epileptogenesis, increased tracer binding was first evident 2 d after SE (Figs. 3A and 3B). The highest binding was observed at 14 d after SE, ranging from 2.54-fold increase in the thalamus to 5.02-fold increase in the piriform cortex. 18F-GE180 in vitro autoradiography directly correlated with in vivo 11C-PK11195 BPND (r = 0.96, P < 0.001) and uptake measurements (r = 0.90, P < 0.001; Fig. 3C).

(A) Representative coronal in vitro 18F-GE180 autoradiography brain images (−3.6 mm relative to bregma) during epileptogenesis. (B) Time course of 18F-GE180 in vitro binding (Bq/pixel). Data are mean ± SEM, with a group size of n = 3–5 per time point. Statistical analysis was performed by 1-way ANOVA and Dunnett post hoc test. *Significant differences compared with baseline (P < 0.05). (C) Correlation of 11C-PK11195 in vivo BPND and 18F-GE180 in vitro binding (Pearson, P < 0.001) and correlation of 11C-PK11195 in vivo uptake and 18F-GE180 in vitro binding (Pearson, P < 0.001).
Immunohistochemistry
Only sporadic activation of microglia and astrocytes were present in brain sections of control animals. During epileptogenesis, both CD11b and GFAP staining demonstrated increased microglial or astroglial activation, respectively, at 5 and 14 d after SE in all analyzed regions (Figs. 4A and 4B). Neuronal cell loss shown by NeuN staining was elevated 2 d after SE and remained at later stages (Figs. 4A and 4B).
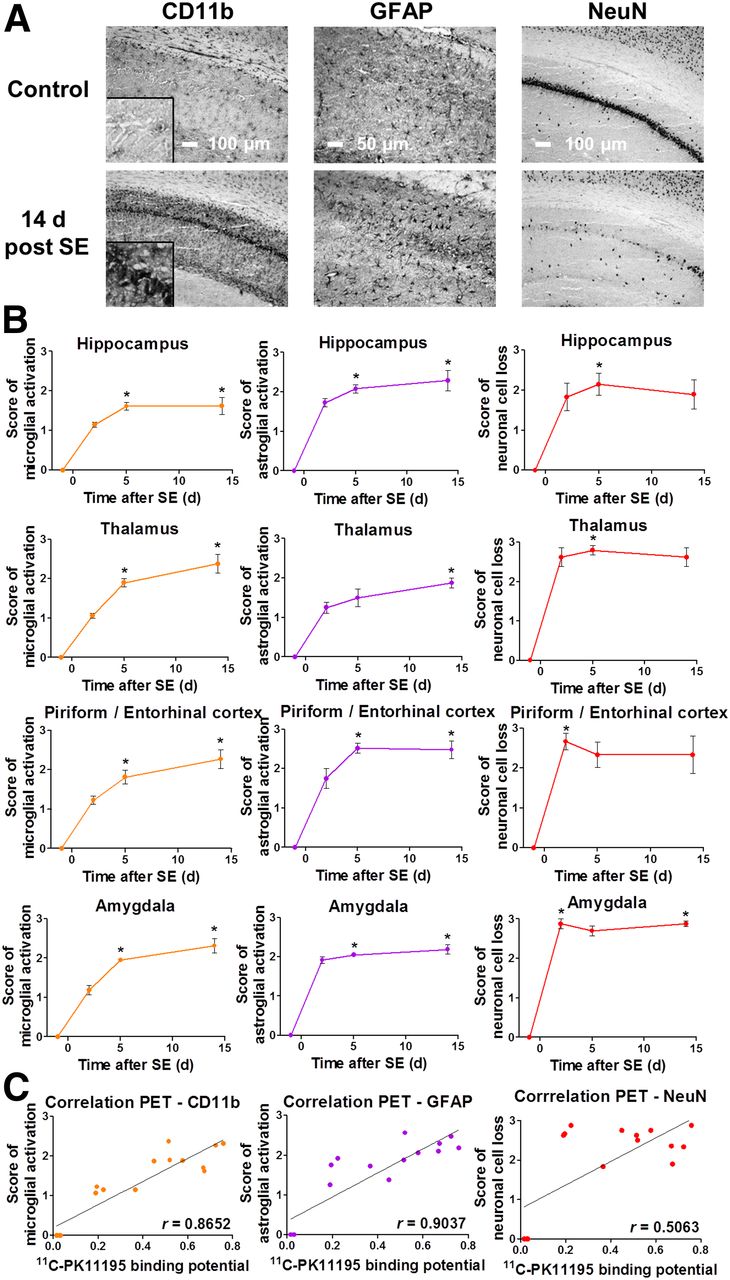
(A) Representative images of CD11b, GFAP, and NeuN staining in control and 14-d post-SE rats (CA1 region of hippocampus; insert for CD11b displays 4-times-higher magnification of pyramidal cell layer). (B) Semiquantitative evaluation of microglial and astroglial activation as well as neuronal cell loss during epileptogenesis. Data are mean ± SEM, with a group size of n = 3–5 per time point. Statistical analysis was performed by Kruskal–Wallis test and Dunn post hoc test. *Significant differences compared with baseline (P < 0.05). (C) Correlation of 11C-PK11195 in vivo BPND and immunohistochemistry scores (Spearman, P < 0.001 for CD11b and GFAP, P < 0.05 for NeuN).
Microglial and astroglial activation scores strongly correlated with 11C-PK11195 BPND (P < 0.001, r = 0.87 for CD11b; r = 0.90 for GFAP; Fig. 4C). There was a weaker correlation between neuronal cell loss score and 11C-PK11195 BPND (P < 0.05, r = 0.51). Similar correlations between immunohistochemistry and 18F-GE180 in vitro binding were observed (data not shown).
DISCUSSION
We have demonstrated a detailed time course of brain inflammation during lithium-pilocarpine SE-induced epileptogenesis by longitudinal 11C-PK11195 PET imaging. In vivo data were corroborated by 18F-GE180 in vitro autoradiography and CD11b immunohistochemistry at selected time points during epileptogenesis, revealing increased TSPO in vitro binding and microglial activation, respectively. Microglial activation was paralleled by astroglial activation and neuronal cell loss.
Interestingly, 1 wk after SE, microglial activation was present throughout the brain except the cerebellum. This finding may be caused by generalized SE as an initial brain insult, which is associated with widespread neuronal firing and induction of inflammatory mediators (24). Subsequently, inflammation became more focused at epileptogenesis-associated brain regions, such as the hippocampus, piriform cortex, amygdala, and thalamus (Fig. 1A). These brain regions represent typical sites of seizure initiation and spread in human TLE (25,26). The spatiotemporal profile of epileptogenesis-associated brain inflammation revealed by serial in vivo quantitative TSPO PET imaging corresponds to findings of previous semiquanitative or qualitative immunohistochemical studies in the pilocarpine model (7,27). In accordance with our findings, a recent study reported increased 3H-PK11195 TSPO in vitro binding in temporal brain regions during epileptogenesis, peaking at 2 wk after kainate-induced SE in rats (8). Limited in vivo 18F-PBR111 PET data in a small subset of rats (n = 2–4) at 2, 4, and 6 wk after kainate-induced SE in the same study indicated a progressive decrease of microglial activation (8).
The concordance of our results with previous studies emphasizes the potential of in vivo TSPO imaging to reliably assess epileptogenesis-associated brain inflammation. Antiepileptogenic treatments including various antiinflammatory approaches are currently under preclinical evaluation (1). The detailed time course of microglial activation described in our study may contribute to optimizing the timing of antiinflammatory treatment schemes. Moreover, TSPO PET allows monitoring of treatment effects on brain inflammation in individual animals (28). The animal model used in this study reflects clinical hallmarks of TLE, such as seizure characteristics, histopathology, or behavioral and cognitive comorbidities, and is widely used in antiepileptic drug development (1). Because no clinically proven antiepileptogenic treatment exists, the respective translational value of post-SE models remains to be shown. To facilitate the evaluation of TSPO PET as a prognostic biomarker for epileptogenesis, our next step is to use a modified post-SE rat model in which only part of the animals becomes chronically epileptic.
A recent TSPO PET imaging study in TLE patients, detected increases in tracer volume of distribution in temporal structures compared with healthy control subjects (12). In line with this, a study in rats with chronic epilepsy after electrically induced SE observed increased TSPO PET signals only in those rats resistant to chronic phenobarbital treatment, which also exhibited higher baseline seizure frequency (29). We did not perform electroencephalographic videomonitoring to correlate seizure frequency to TSPO PET signal in the present study. Nevertheless, we did observe microglial activation in individual rats in the chronic phase of epilepsy, which may be indicative of single animals with high seizure frequency.
The spatiotemporal profile of in vivo TSPO upregulation was confirmed by 18F-GE180 in vitro autoradiography, with BPND showing a stronger correlation to TSPO in vitro binding than uptake values alone. This difference may be attributed to the fact that BPND represents a direct measure of specific ligand–receptor interaction (30), whereas tracer uptake accounts for both specifically bound and free ligand. In addition, uptake is influenced by other factors such as tissue perfusion or tracer metabolism, confounders for which the kinetic modeling process compensates (31). Taken together BPND appears to be a more accurate measure of TSPO expression.
CD11b staining for activated microglial activation correlated strongly to 11C-PK11195 in vivo PET. This finding was expected because microglia are known to upregulate TSPO expression on activation (32). Interestingly, scores of astroglial activation also correlated strongly to our TSPO PET data. The extent to which activated astrocytes contribute to the increased TSPO signal associated with neuroinflammation remains contentious (11), but there is increasing evidence that activated microglia most distinctly contributes to increased brain TSPO levels. In a rat model of neuroinflammation induced by intracerebral injection of lipopolysaccharides, the area of microglial activation corresponded TSPO in vitro binding whereas the area of astroglial activation was considerably smaller than, albeit still located within, the area of TSPO binding (18). In the same animal model, double immunostaining revealed prominent TSPO expression by reactive microglia and low levels of TSPO expression by reactive astrocytes (33). Activated microglia and astroglia were both found to express TSPO in a rat model of stroke; however, the PET-derived time profile of in vivo TSPO expression corresponded to microglial and not astroglial activation (34).
CONCLUSION
Longitudinal PET measurements of TSPO in vivo BPND effectively defined the spatiotemporal profile of epileptogenesis-associated brain inflammation. The time course of neuroinflammation revealed by this study may facilitate improved timing of antiepileptogenic treatments targeting brain inflammation. Ongoing longitudinal imaging studies will elucidate whether TSPO imaging is a predictive biomarker of epilepsy development.
DISCLOSURE
The costs of publication of this article were defrayed in part by the payment of page charges. Therefore, and solely to indicate this fact, this article is hereby marked “advertisement” in accordance with 18 USC section 1734. This study was funded by the European Union Seventh’s Framework Programme (FP7/2007-2013) under grant agreement no. 602102 (EPITARGET), and Mirjam Brackhan received support from a scholarship from the Konrad-Adenauer-Stiftung e.V. This manuscript is part of a doctoral thesis that was submitted to the University of Veterinary Medicine Hannover (January 12, 2016). No other potential conflict of interest relevant to this article was reported.
Acknowledgments
We thank James Thackeray, Alexander Kanwischer, Silvia Eilert, Petra Felsch, Michael Weißing, Heike Breuer, Ina Leiter, Martin Mamach, Ulrike Kretschmer, Thomas Harms, and Nathalie Hildebrandt for skillful assistance. We thank William Trigg and GE Healthcare, Amersham, U.K., for providing the general method and access to the precursor for 18F-GE180 synthesis.
Footnotes
Published online Apr. 7, 2016.
- © 2016 by the Society of Nuclear Medicine and Molecular Imaging, Inc.
REFERENCES
- Received for publication January 11, 2016.
- Accepted for publication March 8, 2016.


