


Abstract
We evaluated the amino acid and glucose metabolism of brain tumors by using PET with 3,4-dihydroxy-6-18F-fluoro-l-phenylalanine (18F-FDOPA) and 18F-FDG. Methods: Eighty-one patients undergoing evaluation for brain tumors were studied. Initially, 30 patients underwent PET with 18F-FDOPA and 18F-FDG within the same week. Tracer kinetics in normal brain and tumor tissues were estimated. PET uptake was quantified by use of standardized uptake values and the ratio of tumor uptake to normal hemispheric tissue uptake (T/N). In addition, PET uptake with 18F-FDOPA was quantified by use of ratios of tumor uptake to striatum uptake (T/S) and of tumor uptake to white matter uptake. The accuracies of 18F-FDOPA and 18F-FDG PET were determined by comparing imaging data with histologic findings and findings of clinical follow-up of up to 31 mo (mean, 20 mo). To further validate the accuracy of 18F-FDOPA PET, 18F-FDOPA PET was performed with an additional 51 patients undergoing brain tumor evaluation. Results: Tracer uptake in tumors on 18F-FDOPA scans was rapid, peaking at approximately 15 min after intravenous injection. Tumor uptake could be distinguished from that of the striatum by the difference in peak times. Both high-grade and low-grade tumors were well visualized with 18F-FDOPA. The sensitivity for identifying tumors was substantially higher with 18F-FDOPA PET than with 18F-FDG PET at comparable specificities, as determined by simple visual inspection, especially for the assessment of low-grade tumors. Using receiver-operating-characteristic curve analysis, we found the optimal threshold for 18F-FDOPA to be a T/S of greater than 1.0 (sensitivity, 96%; specificity, 100%) or a T/N of greater than 1.3 (sensitivity, 96%; specificity, 86%). The high diagnostic accuracy of 18F-FDOPA PET at these thresholds was confirmed with the additional 51 patients (a total of 81 patients: sensitivity, 98%; specificity, 86%; positive predictive value, 95%; negative predictive value, 95%). No significant difference in tumor uptake on 18F-FDOPA scans was seen between low-grade and high-grade tumors (P = 0.40) or between contrast-enhancing and nonenhancing tumors (P = 0.97). Radiation necrosis was generally distinguishable from tumors on 18F-FDOPA scans (P < 0.00001). Conclusion: 18F-FDOPA PET was more accurate than 18F-FDG PET for imaging of low-grade tumors and evaluating recurrent tumors. 18F-FDOPA PET may prove especially useful for imaging of recurrent low-grade tumors and for distinguishing tumor recurrence from radiation necrosis.
Imaging of brain tumors with 18F-FDG was the first oncologic application of PET (1–4). However, recent studies demonstrated its diagnostic limitations (5,6). Because of the high physiologic rate of metabolism of glucose by normal brain tissue, the detectability of tumors with only modest increases in glucose metabolism, such as low-grade tumors and, in some cases, recurrent tumors, is difficult. The best cutoff level for 18F-FDG uptake in the differentiation of high-grade from low-grade tumors was reported to be 1.5 for the ratio of tumor uptake to white matter uptake (T/W) (7). 18F-FDG uptake of low-grade tumors is usually similar to that of normal white matter, and high-grade tumor uptake can be lower than or similar to that of normal gray matter; these properties decrease the sensitivity of lesion detection. Further, there can be great variability in 18F-FDG uptake in that high-grade tumors may actually have uptake that is only similar to or slightly higher than white matter uptake. This is especially true in high-grade tumors after treatment (4,8). Moreover, 18F-FDG uptake can increase in inflammatory lesions, a property that limits the specificity of 18F-FDG PET for tumor detection.
Amino acid and amino acid analog PET tracers constitute another class of tumor imaging agents (9,10). They are particularly attractive for imaging of brain tumors because of the high uptake in tumor tissue and the low uptake in normal brain tissue. The best studied amino acid tracer is 11C-methionine (MET; 11). Because of the short half-life of 11C (20 min), 18F-labeled aromatic amino acid analogs have been developed for tumor imaging (12). Tumor uptake of O-2-18F-fluoroethyl-l-tyrosine and 3,4-dihydroxy-6-18F-fluoro-l-phenylalanine (18F-FDOPA) has been reported to be similar to that of MET (13–17). Recently, the 18F-FDOPA metabolite 3-O-methyl-6-18F-fluoro-l-DOPA (18F-OMFD) also was used for brain tumor imaging by PET (18).
This study had several aims. First, we evaluated the amino acid and glucose metabolism of primary, recurrent, or metastatic brain tumors by using PET with 18F-FDOPA and 18F-FDG. Second, using histologic and clinical follow-up findings as gold standards, we determined the diagnostic accuracies of 18F-FDOPA and 18F-FDG PET. Finally, we attempted to verify the accuracy of 18F-FDOPA-PET for brain tumor imaging in a larger population of patients.
MATERIALS AND METHODS
Patients
Initially, 30 patients with brain tumors, newly diagnosed or previously treated (18 men, 12 women; mean age ± SD, 45.2 ± 14 y; range, 23–68 y), were prospectively studied. The distribution of cases on the basis of the World Health Organization histopathologic classification was as follows: 7 patients had newly diagnosed gliomas (grade II, n = 3; grade III, n = 1; grade IV, n = 3), and 23 had tumors that were previously treated by surgical resection or radiation (original primary tumors: grade II, n = 2; grade III, n = 3; grade IV, n = 15; metastatic brain tumors: n = 3 [breast, lung, and melanoma]). Eleven patients were being treated with corticosteroids at the time of the PET scans (dexamethasone at 1–24 mg daily; mean, 11 mg). All patients underwent 18F-FDOPA PET and 18F-FDG PET within the same week. MRI studies of the brain, including T2- and T1-weighted images, before and after the administration of gadolinium-diethylenetriaminepentaacetic acid, were acquired for all patients within 1 wk before the PET scans. The accuracies of the imaging data were validated by histologic findings (15 patients; average time to surgery, 20 d) or subsequent clinical follow-up findings (15 patients; mean follow-up time, 20 mo). For clinical follow-up, tumor progression within 6 mo after the PET study was the criterion used as clinical evidence of an aggressive tumor. Six patients died, with an average time to death of 7 mo; all had tumors that progressed within 6 mo after the PET study. The remaining 9 patients were alive at 20 mo of follow-up: 3 had radiation necrosis that was found to be resolved at follow-up MRI without treatment, 5 patients remained stable at 27 mo, and 1 patient had tumor shrinkage.
18F-FDOPA PET (without 18F-FDG PET) was subsequently expanded to a larger population of 51 patients (34 men, 17 women). There were 3 newly diagnosed gliomas (grade II, n = 2; grade III, n = 1), and 47 patients were evaluated for recurrence (original primary tumors: grade II, n = 13; grade III, n = 13; grade IV, n = 21). One newly identified lesion was subsequently found to be benign reactive changes.
All patients gave written consent to participate in this study, which was approved by the Office for Protection of Research Subjects, University of California Los Angeles.
18F-FDOPA Synthesis
18F-FDOPA synthesis was performed by use of a previously reported procedure (19,20). The chemical and radiochemical purities of the product isolated from the semipreparative high-pressure liquid chromatography system were further confirmed by an analytic high-pressure liquid chromatography method (specific activity, ∼18.5 × 10¹⁰ Bq/mmol [5 Ci/mmol]) and were both greater than 99%. The product was made isotonic with sodium chloride and sterilized by passage through a 0.22-μm Millipore filter into a sterile multidose vial.
PET Imaging
PET was performed with a high-resolution full-ring scanner (ECAT HR or ECAT HR+; Siemens/CTI), which acquired 47 or 63 contiguous slices simultaneously. For 18F-FDOPA PET, patients were instructed to consume a low-protein diet after the previous evening meal. 18F-FDOPA PET and 18F-FDG PET were performed in the same week for 30 patients. Patients were instructed to drink plenty of water before and after PET to accelerate renal tracer excretion.
For 18F-FDOPA PET, a dynamic emission acquisition sequence in the 3-dimensional mode over 75 min (8 × 15 s, 2 × 30 s, 2 × 60 s, 14 × 300 s) was started with an intravenous injection of 18F-FDOPA at 3.5 MBq/kg. This dynamic acquisition was used to characterize the time–activity curve of 18F-FDOPA uptake and for kinetic modeling (Christiaan Schiepers et al., unpublished data, 2005). After an intravenous injection of 18F-FDG at 2.4 MBq/kg and after an uptake period of 60 min, static 18F-FDG PET images were acquired for 30 min. To minimize a patient's head motion, hypoallergenic medical tape was applied across the forehead and head cushion before the PET acquisition. To correct for photon attenuation, 5-min transmission scans were acquired after the 18F-FDOPA and 18F-FDG emission scans for all patients. PET emission data corrected for photon attenuation, photon scatter, and random coincidences were reconstructed by use of iterative reconstruction with ordered-subset expectation maximization and a gaussian filter with a full width at half maximum of 4 mm. 18F-FDOPA PET images were summed from 10 to 30 min after tracer injection. For 18F-FDG PET, one 30-min static image was obtained 60 min after tracer injection.
Image Analysis
Standard visual image interpretation was performed independently by 2 nuclear medicine physicians for 18F-FDOPA PET and 18F-FDG PET studies with MRI as a reference. Clinical information was available to the interpreting physicians. Any tracer activities above background levels were considered abnormal for both 18F-FDOPA PET and 18F-FDG PET scans.
For semiquantitative image analysis (region of interest [ROI]), ROIs were drawn over 3 consecutive slices. Tumor ROIs were placed on the summed scans by drawing an 80% peak-voxel-intensity isocontour on the slices with maximal tumor uptake to avoid cysts and resection cavities. For tumors that did not show visible PET uptake, MRI was used as a reference through image fusion (MIM Workstation; MIMVISTA) of T1-weighted gadolinium-enhanced MR images for lesions that were contrast enhancing and T2-weighted MR images for lesions that were not contrast enhancing.
The normal reference brain region was defined by drawing an ROI involving the entire contralateral hemisphere at the level of the centrum semiovale. For the determination of tracer uptake in normal gray matter and white matter, 3 circular ROIs with 8-mm diameters were placed along the cortical band of the contralateral frontal and parietal cortices (gray matter) and in the centrum semiovale (white matter) (7). The ROIs from the frontal and parietal cortices then were averaged to generate the gray matter data. ROIs also were drawn over the contralateral striatum and the entire cerebellum.
Activity counts in the ROIs were normalized to injected dose per kilogram of patient body weight (standardized uptake value [SUV]). The peak pixel SUV (SUVmax) and the mean SUV of the voxels falling within the 80% peak-voxel-intensity isocontour (SUVmax20) were generated. Ratios of tumor uptake to normal tissue uptake were generated by dividing the tumor SUVmax20 by the SUV of the contralateral normal hemispheric brain tissue (T/N), the normal striatum (T/S), and the normal white matter (T/W).
To determine the time course of tracer uptake in tumor ROIs and the time to reach the optimal ratio of tumor activity to background activity, time–activity curves over the entire acquisition period were generated. ROIs were copied to dynamic 18F-FDOPA PET image sets. Uptake curves for the tumor, cerebellum (as the blood-pool reference), normal gray and white matter, and the striatum were generated over the 75 min after injection.
Statistical Analysis
18F-FDG and 18F-FDOPA PET scan parameters were compared by use of the Wilcoxon nonparametric test. The Student t test was used to compare the 18F-FDG and 18F-FDOPA SUVs of high-grade versus low-grade tumors, contrast-enhancing versus nonenhancing tumors, and tumors versus radiation necrosis. Sensitivity and specificity were calculated by comparing the PET data with histologic and clinical follow-up data. Data are presented with 95% confidence intervals (CIs). Receiver-operating-characteristic (ROC) curve analysis for the first group of 30 patients undergoing 18F-FDOPA PET was used to determine the optimal thresholds for the uptake ratios (T/N, T/S, and T/W). The optimal thresholds identified then were applied and tested with the second 18F-FDOPA study patient population (n = 51) as well as with the entire population (the first and second groups of patients together; n = 81).
RESULTS
Time–Activity Curves for 18F-FDOPA PET Scans
Representative decay-corrected time–activity curves for the tumor, the cerebellum, and the striatum were averaged over the first 11 patients undergoing 18F-FDOPA PET (Fig. 1A). This information was used in this study to select the time window for obtaining the highest tumor uptake while maintaining a good ratio of tumor uptake to normal tissue uptake. The highest tracer uptake in the tumor and cerebellum generally occurred between 10 min and 30 min after injection. SUVs (mean ± SD) were 3.24 ± 0.39 at 15 min. Mean tumor uptake reached 98% of peak activity (SUV, 3.17 ± 0.41) at 10 min and still averaged 93% of peak activity (SUV, 3.00 ± 0.30) at 30 min. There was no difference in time–activity curve patterns between high-grade and low-grade tumors. The cerebellum had lower uptake than tumor (peak SUV, 1.92 ± 0.11). At the end of the study at 75 min, tumor uptake had declined to 73% of its peak activity (SUV, 2.35 ± 0.26), and cerebellar uptake had declined to 67% of its peak activity (SUV, 1.28 ± 0.09). Tracer activity in the striatum did not reach a peak until 50 min after injection (SUV, 2.93 ± 0.70), and there was no significant decline at 75 min after injection (SUV, 2.86 ± 0.70; 98% peak activity). Thus, tumor uptake from 10–30 min after injection is nearly maximal and occurs sufficiently early to avoid peak uptake in the striatum. SUVs were higher in normal gray matter (SUV, 1.69 ± 0.11) than in normal white matter (SUV, 1.21 ± 0.07) (P = 0.0001) (Fig. 1B). Gray matter uptake declined to 67% of peak activity at 75 min, whereas white matter uptake declined to 83% of peak activity at 75 min.
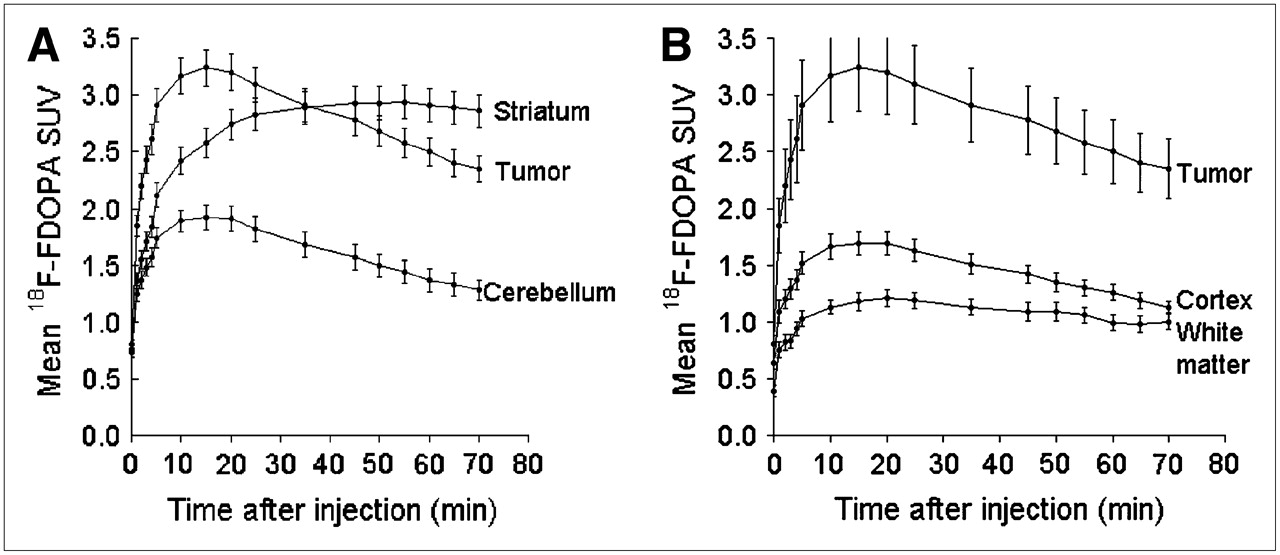
Time–activity curves for tracer uptake on 18F-FDOPA PET scans summarized for 11 patients over 75 min from time of injection. (A) Time course of tracer accumulation in tumor tissue, cerebellum, and striatum. Tumor uptake is expressed as mean values of voxels with top 20% SUVs. Error bars denote 1 SE from mean uptake. (B) Time course of tracer accumulation in tumor tissue, cortex, and white matter. Error bars denote 1 SE from mean uptake.
Visual Image Analysis
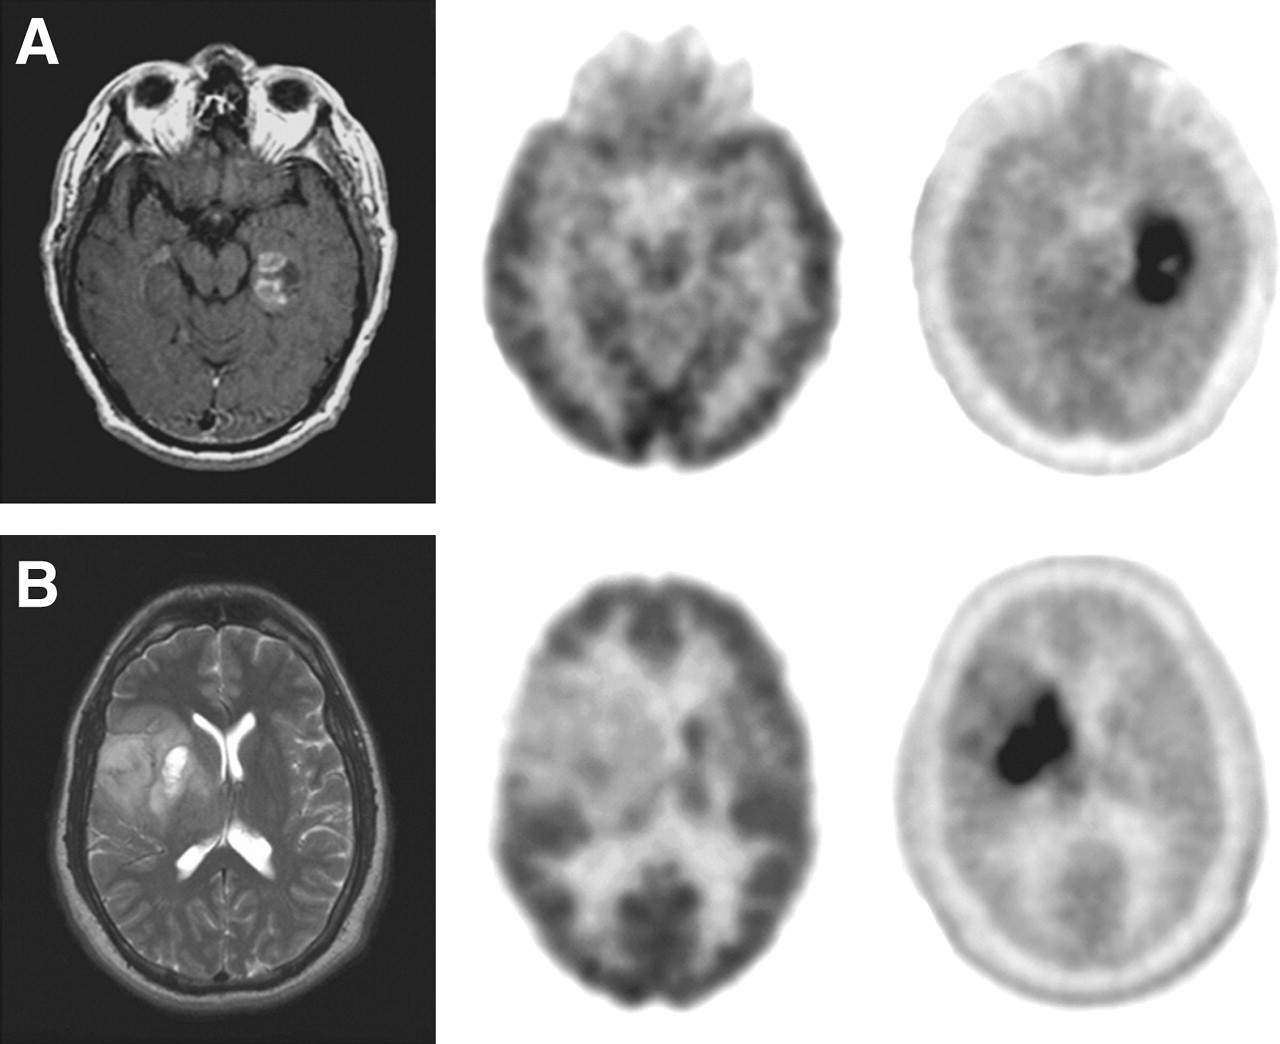
With the criterion that any tracer activity above the background should be considered abnormal, 22 of 23 high-grade and low-grade tumors were visualized by 18F-FDOPA PET (Fig. 2); there was 1 false-negative result in a patient with a residual low-grade tumor. All 3 patients without active disease (in long-term remission) lacked any visible uptake on 18F-FDOPA PET scans. Four patients with radiation necrosis had very low but visible 18F-FDOPA uptake. Thus, 18F-FDOPA had a sensitivity of 96%, a specificity of 43%, and an overall accuracy of 83% (95% CI, 70%–97%). These data corresponded to a positive predictive value (PPV) of 85% and a negative predictive value (NPV) of 75% (Table 1).

MRI (left), 18F-FDG PET (middle), and 18F-FDOPA PET (right) of newly diagnosed tumors. (A) Glioblastoma. (B) Grade II oligodendroglioma.
Sensitivity and Specificity of 18F-FDOPA and 18F-FDG, as Determined by Simple Visual Analysis
Using the same visual criterion, 14 of 23 tumors were visualized by 18F-FDG PET (sensitivity, 61%) (Table 1). Eight of the 9 tumors that were negative on 18F-FDG scans were clearly visible on 18F-FDOPA scans (Fig. 3). One of these patients had had a grade II oligodendroglioma resected 5 y before and began experiencing seizures. 18F-FDOPA PET demonstrated the recurrent tumor, which was subsequently localized by intraoperative electroencephalography and resected (Fig. 3B). The other 7 patients suffered tumor progression within 1–3 mo after the PET study. Similar to the results obtained for 18F-FDOPA uptake, there was no visible 18F-FDG uptake in 3 stable patients in long-term remission, and there was low-level 18F-FDG uptake in 4 patients with radiation necrosis (specificity, 43%). These data corresponded to a PPV for 18F-FDG of 78%, an NPV of 25%, and an overall accuracy of 57% (95% CI, 39%–74%). Thus, 18F-FDOPA PET was more sensitive (sensitivity, 96%; 95% CI, 87%–100%) in identifying tumors overall than 18F-FDG PET (sensitivity, 61%; 95% CI, 41%–81%).
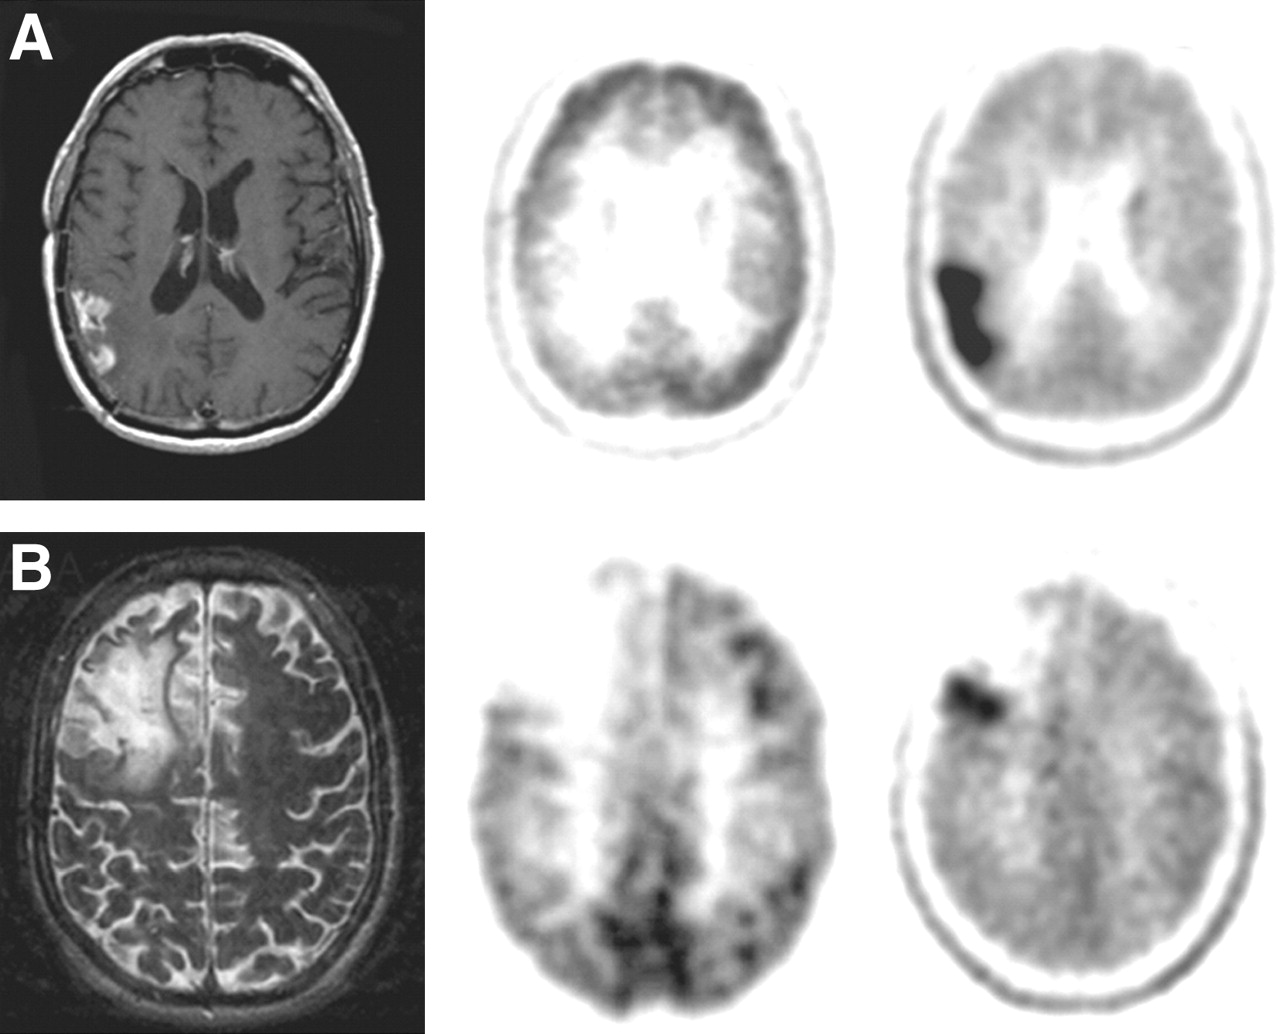
MRI (left), 18F-FDG PET (middle), and 18F-FDOPA PET (right) for evaluating recurrent tumors. (A) Recurrent glioblastoma. (B) Recurrent grade II oliogodendroglioma.
Four patients were evaluated for radiation necrosis suspected by clinical assessment (3 with metastatic cancers: breast, lung, and melanoma; 1 with grade III glioma). Three of these patients were determined to have radiation necrosis on the basis of the observation of spontaneous regression of contrast-enhanced lesions in the subsequent months without treatment; 1 was found to have a recurrent tumor (breast cancer) on the basis of biopsy and was subsequently treated. 18F-FDOPA correctly identified the recurrent tumor, and 18F-FDG yielded false-negative results.
Comparison of 18F-FDOPA and 18F-FDG PET Scans for High-Grade and Low-Grade Tumors
For the 23 confirmed tumors, 18F-FDOPA had an SUVmax of 4.39 ± 2.10 and a T/N of 2.50 ± 0.73 for high-grade tumors (n = 18) and an SUVmax of 3.07 ± 1.65 and a T/N of 1.95 ± 0.69 for low-grade tumors (n = 5) (Table 2). The 7 patients with changes after treatment had an SUVmax of 1.50 ± 0.35 and a T/N of 1.11 ± 0.25. Among these 7 patients, the 4 radiation necrosis lesions had an SUVmax of 1.57 ± 0.47 and a T/N of 1.25 ± 0.23.
18F-FDOPA and 18F-FDG Parameters in High-Grade and Low-Grade Tumors and Post-Treatment Changes
18F-FDG had higher absolute SUVs than 18F-FDOPA, with SUVmax values of 5.49 ± 3.16 and 2.48 ± 0.85 for the 19 high-grade and 5 low-grade tumors. However, the T/N values of 18F-FDG were 1.23 ± 0.69 for high-grade tumors and 0.66 ± 0.33 for low-grade tumors. Thus, the contrast for imaging of tumors was higher with 18F-FDOPA. The difference between 18F-FDOPA and 18F-FDG T/N values was statistically significant (P < 0.001).
ROC Analysis of 18F-FDOPA Sensitivity and Specificity
As described above, standard visual analysis of 18F-FDOPA PET seemed adequate in that it provided a high sensitivity for identifying tumors. However, the specificity was low, as radiation necrosis lesions all had low but visible tracer uptake. Therefore, ROC analysis was used to identify the optimal thresholds for various ratios of tumor uptake to normal tissue uptake: T/N, T/S, and T/W.
A T/S of 0.75 or 1.0, a T/N of 1.3, and a T/W of 1.6 were found to provide the best sensitivity and specificity (Table 3). A T/S of 0.75 provided a sensitivity of 100% and a specificity of 86%, a T/S of 1.0 provided a sensitivity of 96% and a specificity of 100%, a T/N of 1.3 provided a sensitivity of 96% and a specificity of 86%, and a T/W of 1.6 provided a sensitivity of 96% and a specificity of 86%.
ROC Analysis of 30 18F-FDOPA PET Studies to Generate Optimal Thresholds for Sensitivity and Specificity
Prospective Application of Thresholds to Larger Patient Population
An additional 51 patients were studied by 18F-FDOPA PET to test the thresholds for sensitivity and specificity generated from the ROC analysis of the first group of 30 patients studied. This second group of patients included more post-treatment patients being monitored for disease status (n = 47) (Table 4). 18F-FDOPA data were compared with pathology findings (10 patients; mean time to surgery: 25 d) and clinical follow-up findings (41 patients; mean follow-up time: 11 mo). Fourteen patients died during the follow-up period, with the mean time to death of 4.5 mo.
Clinical Characteristics of Group 1 and Group 2 Patients
A T/S of 0.75 or 1.0, a T/N of 1.3, and a T/W of 1.6 were used in this group of patients to evaluate sensitivity, specificity, PPV, and NPV (Table 5). As shown in Table 5, a T/S of 0.75 provided a similar sensitivity (97% vs. 100%) and the same specificity (86%) for the second group of patients as for the first group of patients. Likewise, a T/N of 1.3 provided a similar sensitivity (95% vs. 96%) and the same specificity (86%) for the second group of patients as for the first group of patients. When the 2 groups of patients were considered together (n = 81), a T/S of 0.75 and a T/N of 1.3 again yielded the best diagnostic accuracy (T/S of 0.75: sensitivity, 98%; specificity, 86%; PPV, 95%; NPV, 95%; accuracy, 95%; T/N of 1.3: sensitivity, 95%; specificity, 86%; PPV, 95%; NPV, 86%; accuracy, 93%).
Diagnostic Accuracy of 18F-FDOPA PET at Various Thresholds for Ratios of Tumor Uptake to Normal Tissue Uptake in Group 1 and Group 2 Patients
There was no statistically significant difference between uptake levels in 48 high-grade tumors and 18 low-grade tumors (P = 0.40) (Fig. 4A). Furthermore, contrast-enhancing tumors (n = 37) and nonenhancing tumors (n = 23) had similar SUVmax values (3.57 ± 1.74 versus 2.88 ± 1.14) (P = 0.97) (Fig. 4B), supporting the notion that a blood–brain barrier breakdown is not a prerequisite for uptake into tumors. There was a statistically significant difference in uptake levels between contrast-enhancing tumors and radiation necrosis lesions (n = 4) (P < 0.00001).
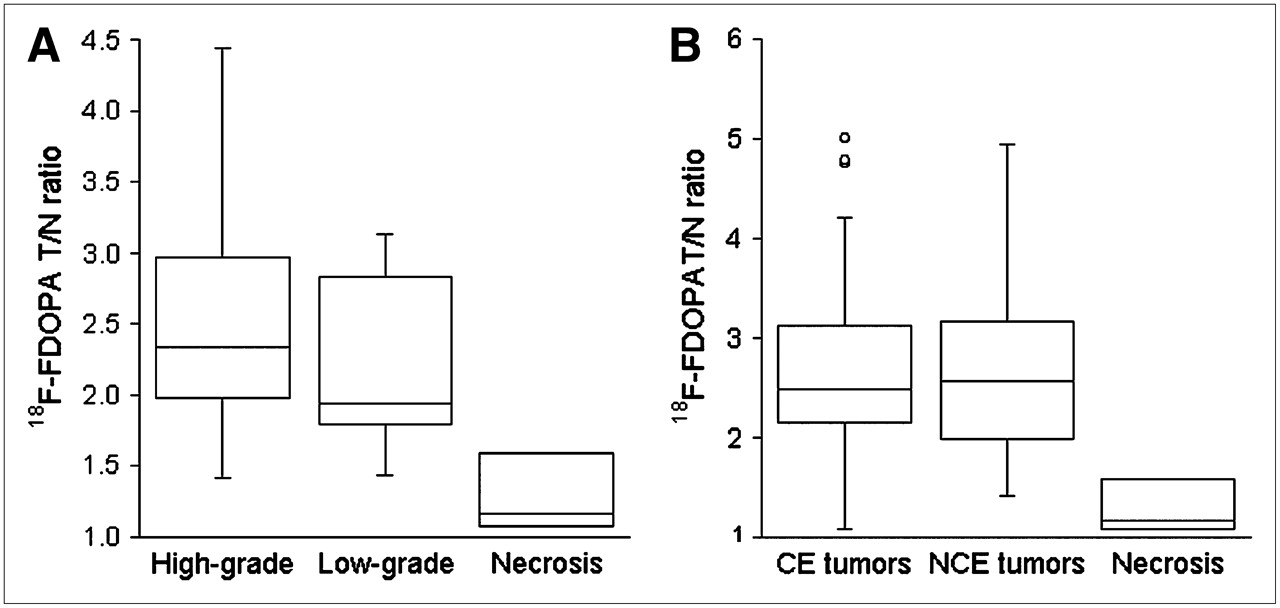
(A) Box plots of 18F-FDOPA T/N values in high-grade and low-grade brain tumors and radiation necrosis. There was no statistically significant difference between high-grade and low-grade tumors (P = 0.40). There was a statistically significant difference between tumors and radiation necrosis (P < 0.00001). Error bars indicate SEs. (B) Box plots of 18F-FDOPA T/N values in brain tumors that were contrast enhancing on MRI (CE) and those that did not take up contrast material on MRI (NCE). No statistical difference was seen between CE and NCE tumors (P = 0.40). Statistically significant difference was seen between CE tumors and radiation necrosis (P < 0.00001). Error bars indicate SEs.
DISCUSSION
To our knowledge, this is the first clinical study to systematically compare 18F-FDOPA PET with 18F-FDG PET of brain tumors and to evaluate the diagnostic accuracy of 18F-FDOPA PET for a relatively large number of patients with pathologic and clinical follow-up findings. Our results suggest that 18F-FDOPA PET is superior to 18F-FDG PET for visualizing low-grade tumors, evaluating recurrent tumors, and differentiating tumor recurrence from radiation necrosis.
18F-FDOPA PET of gliomas demonstrated lower SUVs than did 18F-FDG PET. However, the contrast between tumor tissue and normal tissue was higher with 18F-FDOPA than with 18F-FDG because of the low normal brain tissue uptake in 18F-FDOPA PET scans. This property proved useful in detecting low-grade tumors as well as recurrent tumors. For example, 8 of 9 patients with recurrent tumors had negative 18F-FDG PET results but positive 18F-FDOPA PET results. Of these 9 patients, 5 had low-grade tumors and 4 had high-grade tumors. If only high-grade tumors were considered, then 18F-FDG sensitivity for detecting recurrent tumors would be 78% (14/18) rather than 61% (14/23), compared with 96% (22/23) for 18F-FDOPA. Eleven of 30 patients were receiving various doses of dexamethasone at the time of 18F-FDG PET. This treatment could very well decrease 18F-FDG uptake (21). However, because steroids are commonly used in clinical settings, this finding further indicates the difficulty of using 18F-FDG for brain tumor patients. 18F-FDOPA PET therefore may help to detect low-grade and recurrent tumors with greater sensitivity than 18F-FDG PET.
It was shown previously that 18F-FDG SUVs in brain tumors were not a reliable measure for grading or evaluating recurrent tumors (22); we obtained similar findings in the present study. In addition, it was also shown that there was an overlap of 18F-FDG uptake in recurrent tumors and radiation necrosis, in that even high-grade recurrent tumors could have uptake similar to or slightly above that of white matter and that necrosis could have uptake higher than that of normal white matter (5,6). In the present study, standard visual inspection of images with the criterion that any uptake above the background should be considered abnormal provided a higher sensitivity with 18F-FDOPA PET than with 18F-FDG PET. However, the specificity of 18F-FDOPA PET was as poor as that of 18F-FDG PET with the visual criterion.
We used ROC analysis to identify optimal ratios of tumor uptake to normal tissue uptake that would give the best sensitivity and specificity for 18F-FDOPA and applied these thresholds to a second, larger group of patients. Our results showed that the specificity of 18F-FDOPA brain tumor imaging could be greatly increased by using the following thresholds: T/S of 0.75 or 1.0, T/N of 1.3, and T/W of 1.6.
Although a T/S of 0.75 resulted in a slightly higher accuracy of 95% and a sensitivity of 98%, a ratio of 1.0 provided a slightly lower sensitivity of 92% but a higher specificity of 95%. The latter is clinically more practical, as it does not require quantitative measurement, is visually more obvious, and is still highly accurate (accuracy, 93%; PPV, 98%; NPV, 80%). We therefore suggest the use of a T/S of 1.0 as a first-line assessment tool and the use of a T/S of 0.75 in inconclusive cases. In addition, a T/S of 1.0 could be used when there is a higher clinical suspicion of radiation necrosis, and a T/S of 0.75 could be used when there is a higher clinical suspicion of recurrent tumor.
Tumor grade did not significantly affect tracer uptake in 81 lesions in our 18F-FDOPA PET studies, a finding that is consistent with the results of most studies with amino acid tracers (14,17,18). Likewise, no statistically significant difference in uptake levels between tumors that were contrast enhancing and those that were nonenhancing was seen, in agreement with the notion that, like the tumor accumulation of other amino acid tracers, the tumor accumulation of 18F-FDOPA most likely is mediated through a specific transport system rather than requiring the breakdown of the blood–brain barrier (23).
18F-FDOPA has been used in evaluating patients with movement disorders for many years through imaging of the integrity of the striatal dopamine pathway (24–26). However, 18F-FDOPA is also an amino acid analog and was shown to be taken up at the blood–brain barrier in normal brain by the neutral amino acid transporter (27,28). Although the mechanism of tumor-specific 18F-FDOPA uptake has not been firmly established, other amino acid tracers, including a closely related metabolite of 18F-FDOPA, 18F-OMFD, as well as O-2-18F-fluoroethyl-l-tyrosine and 11C-methionine, have been shown to be taken up by tumors through the neutral amino acid transporter (29–33). In the present study, tumor uptake most likely included a combination of 18F-FDOPA and its metabolite 18F-OMFD, as 18F-OMFD uptake in brain tumors has been demonstrated to have a similar kinetic profile and to achieve a similar ratio of tumor uptake to normal tissue uptake (18). Carbidopa was not considered necessary for the clinical purpose studied here, because both 18F-OMFD and 18F-FDOPA most likely are taken up by tumors in similar ways.
A highly significant difference was seen between contrast-enhancing tumors and radiation necrosis on 18F-FDOPA PET scans. Larger studies would be helpful to further address the usefulness of 18F-FDOPA PET in distinguishing between recurrent tumors and radiation necrosis.
CONCLUSION
18F-FDOPA PET demonstrated excellent visualization of high-grade and low-grade tumors. It was more sensitive and specific for evaluating recurrent tumors than was 18F-FDG PET. It may prove particularly valuable for examining recurrent low-grade gliomas, because these tumors are difficult to evaluate by MRI and are usually not visible on 18F-FDG PET scans. Our data also suggest that 18F-FDOPA may be valuable for distinguishing recurrent tumors from radiation necrosis, although a larger series of radiation necrosis cases is needed to confirm this suggestion.
Acknowledgments
The authors thank Amber Luke for administrative support, Michael Quinn for MRI database support, the University of California Los Angeles Cyclotron staff for PET tracer production, and University of California Los Angeles Ahmanson Biological Imaging Center technologists Larry Pang and Jean-Richard Eugene for their support in PET acquisition. This study was supported by grant P50 CA086306 from the National Cancer Institute, National Institute of Health, and by U.S. Department of Energy contract DE-FC03-87-ER60615.
References
- Received for publication November 7, 2005.
- Accepted for publication February 11, 2006.


Jump to section
Related Articles
Cited By...
- Distinguishing Progression from Pseudoprogression in Glioblastoma Using 18F-Fluciclovine PET
- A Clinical PET Imaging Tracer ([18F]DASA-23) to Monitor Pyruvate Kinase M2-Induced Glycolytic Reprogramming in Glioblastoma
- Voxelwise and Patientwise Correlation of 18F-FDOPA PET, Relative Cerebral Blood Volume, and Apparent Diffusion Coefficient in Treatment-Naive Diffuse Gliomas with Different Molecular Subtypes
- 18F-Branched-Chain Amino Acids: Structure-Activity Relationships and PET Imaging Potential
- Although Non-diagnostic Between Necrosis and Recurrence, FDG PET/CT Assists Management of Brain Tumours After Radiosurgery
- Can an 18F-ALF-NOTA-PRGD2 PET/CT Scan Predict Treatment Sensitivity to Concurrent Chemoradiotherapy in Patients with Newly Diagnosed Glioblastoma?
- Multimodality Brain Tumor Imaging: MR Imaging, PET, and PET/MR Imaging
- The Role of PET [18F]FDOPA in Evaluating Low-grade Glioma
- Comparison of the Amino Acid Tracers 18F-FET and 18F-DOPA in High-Grade Glioma Patients
- Clinical Impact of Amino Acid PET in Gliomas
- Treatment Response Evaluation Using 18F-FDOPA PET in Patients with Recurrent Malignant Glioma on Bevacizumab Therapy
- A Meta-Analysis on the Diagnostic Performance of 18F-FDG and 11C-Methionine PET for Differentiating Brain Tumors
- Value of 18F-3,4-Dihydroxyphenylalanine PET/MR Image Fusion in Pediatric Supratentorial Infiltrative Astrocytomas: A Prospective Pilot Study
- 18F-FDOPA PET for Differentiating Recurrent or Progressive Brain Metastatic Tumors from Late or Delayed Radiation Injury After Radiation Treatment
- Correlation of MRI-Derived Apparent Diffusion Coefficients in Newly Diagnosed Gliomas with [18F]-Fluoro-L-Dopa PET: What Are We Really Measuring with Minimum ADC?
- Multimodal Magnetic Resonance Imaging and 18F-L-Dihydroxyphenylalanine Positron Emission Tomography in Early Characterization of Pseudoresponse and Nonenhancing Tumor Progression in a Pediatric Patient With Malignant Transformation of Ganglioglioma Treated With Bevacizumab
- Nuclear medicine functional imaging of the brain
- Accurate Differentiation of Recurrent Gliomas from Radiation Injury by Kinetic Analysis of {alpha}-11C-Methyl-L-Tryptophan PET
- Impact of 3,4-Dihydroxy-6-18F-Fluoro-L-Phenylalanine PET/CT on Managing Patients with Brain Tumors: The Referring Physician's Perspective
- Multimodality Assessment of Brain Tumors and Tumor Recurrence
- Correlation of 6-18F-Fluoro-L-Dopa PET Uptake with Proliferation and Tumor Grade in Newly Diagnosed and Recurrent Gliomas
- End Point Assessment in Gliomas: Novel Treatments Limit Usefulness of Classical Macdonald's Criteria
- Relative Cerebral Blood Volume Values to Differentiate High-Grade Glioma Recurrence from Posttreatment Radiation Effect: Direct Correlation between Image-Guided Tissue Histopathology and Localized Dynamic Susceptibility-Weighted Contrast-Enhanced Perfusion MR Imaging Measurements
- Tumor Cell Metabolism Imaging
- Diagnostic Accuracy of 11C-Methionine PET for Differentiation of Recurrent Brain Tumors from Radiation Necrosis After Radiotherapy
- 6-L-18F-Fluorodihydroxyphenylalanine PET in Neuroendocrine Tumors: Basic Aspects and Emerging Clinical Applications
- 18F-FDOPA Kinetics in Brain Tumors
- Clinical Applications of PET in Brain Tumors
- PET/CT of Skull Base Meningiomas Using 2-18F-Fluoro-L-Tyrosine: Initial Report