


Abstract
High-grade gliomas (HGGs) are the most common malignant primary tumors of the central nervous system. PET probes of amino acid transport such as O-(2-18F-fluoroethyl)-l-tyrosine (18F-FET), 3,4-dihydroxy-6-18F-fluoro-l-phenylalanine (18F-DOPA), and 11C-methionine (11C-MET) detect primary and recurrent tumors with a high accuracy. 18F-FET is predominantly used in Europe, whereas amino acid transport imaging is infrequently done in the United States. The aim of this study was to determine whether 18F-FET and 18F-DOPA PET/CT provide comparable information in HGG. Methods: Thirty 18F-FET and 18F-DOPA PET/CT scans were obtained before surgery or biopsy in 27 patients with high clinical suspicion for primary or recurrent HGG (5 primary, 22 recurrent tumors). 18F-FET and 18F-DOPA PET/CT images were compared visually and semiquantitatively (maximum standardized uptake value [SUVmax], mean SUV [SUVmean]). Background (SUVmax and SUVmean) and tumor-to-background ratios (TBRs) were calculated for both PET probes. The degree of 18F-DOPA uptake in the basal ganglia (SUVmean) was also assessed. Results: Visual analysis revealed no difference in tumor uptake pattern between the 2 PET probes. The SUVmean and SUVmax for 18F-FET were higher than those of 18F-DOPA (4.0 ± 2.0 and 4.9 ± 2.3 vs. 3.5 ± 1.6 and 4.3 ± 2.0, respectively; all P < 0.001). TBRs for SUVmean but not for SUVmax were significantly higher for 18F-FET than 18F-DOPA (TBR SUVmean: 3.8 ± 1.7 vs. 3.4 ± 1.2, P = 0.004; TBR SUVmax: 3.3 ± 1.6 and 3.0 ± 1.1, respectively; P = 0.086). 18F-DOPA uptake by the basal ganglia was present (SUVmean, 2.6 ± 0.7) but did not affect tumor visualization. Conclusion: Whereas visual analysis revealed no significant differences in uptake pattern for 18F-FET and 18F-DOPA in patients with primary or recurrent HGG, both SUVs and TBRs for SUVmean were significantly higher for 18F-FET. However, regarding tumor delineation, both tracers performed equally well and seem equally feasible for imaging of primary and recurrent HGG. These findings suggest that both PET probes can be used based on availability in multicenter trials.
High-grade gliomas (HGGs) are the most common malignant primary tumors of the central nervous system, accounting for 45%–50% of all gliomas with an incidence of about 3–4 per 100,000 inhabitants per year (1). Despite multimodality treatment approaches, 5-y survival is abysmal at 5% (2).
Patients are followed clinically for neurologic symptoms and through neuroimaging with MR imaging, the current clinical gold standard. One major diagnostic problem is the differentiation between contrast enhancement due to radiation necrosis (so-called pseudoprogression) and tumor recurrence (3). Nonspecific contrast enhancement also complicates therapy monitoring (4).
PET/CT with various probes of glucose metabolism and amino acid transport can contribute to improved posttreatment assessment (5). 18F-FDG PET was first used for imaging brain tumors (6,7). However, later studies demonstrated limitations mainly due to the high normal gray matter 18F-FDG activity (7,8). As an alternative, labeled amino acid analogs have been introduced (9,10). Among them, 11C-methionine (11C-MET) has been studied most extensively (11). However, because of the short physical half-life of 11C of only 20 min, the use of 11C-MET PET has been limited to PET centers with access to an on-site cyclotron. To overcome this limitation, several 18F-labeled amino acids have been introduced (10,12). 3,4-dihydroxy-6-18F-fluoro-l-phenylalanine (18F-DOPA) has been used for imaging brain tumors (13–16), neuroendocrine tumors (17), and movement disorders (18) for more than 20 y. However, the synthesis of 18F-DOPA is laborious, and its availability is limited.
More recently, O-(2-18F-fluoroethyl)-l-tyrosine (18F-FET) has been introduced for PET brain tumor imaging (19). Similar to 18F-DOPA, it can detect low-grade gliomas and HGGs (20–22). As an advantage, its radiosynthesis is straightforward, and it can thus be delivered via commercial radiopharmacies. Therefore, 18F-FET has become the most commonly used radiotracer for brain tumor imaging with PET in Europe.
However, 18F-FET is not approved by the Food and Drug administration for brain tumor imaging in the United States. Few sites in the United States are using 18F-DOPA for brain imaging under an Investigational New Drug application.
Clinical studies have demonstrated a comparable accuracy for 11C-MET PET and 18F-FET or 18F-DOPA PET in detecting primary and recurrent brain tumors (13,20). However, only 1 study has compared 18F-FET with 18F-DOPA (23). Such comparisons are important because comparable diagnostic information would greatly facilitate multicenter studies, which could include patients studied with one or the other PET probe of amino acid transport. The aim of this prospective study was therefore to determine whether 18F-DOPA and 18F-FET provide comparable diagnostic information visually and semiquantitatively.
MATERIALS AND METHODS
Subjects
This prospective clinical study included patients with suspected primary or recurrent HGGs. The patients’ Karnofsky score had to be at least 80% when they entered the study. All patients had to be able to understand the study procedures and to provide informed consent. The study adhered to the standards established in the Declaration of Helsinki. This study was reviewed by the Institutional Review Board of the Medical Faculty of the University of Würzburg (local ethics committee), and all patients signed a written informed consent form.
From August 2012 to December 2013, 27 patients (18 men and 9 women; mean age ± SD, 54 ± 14 y; range, 25–80 y) were enrolled. Five patients presented with suspected primary HGG, whereas 22 patients had suspected tumor recurrence (Table 1). Three patients were investigated twice, leading to a total of 30 pairs of 18F-FET and 18F-DOPA PET/CT scans.
Patients’ Characteristics
All patients with suspected recurrence (n = 22) had undergone surgical resection. In addition to surgery, 20 of 22 patients had received chemotherapy and radiation (91%), whereas 2 of 22 patients had undergone radiation only (9%). The time from completion of radiation to the PET scan was more than 12 wk in all subjects. Recurrent disease was verified by tumor biopsy or surgery. All patients with primary tumors underwent tumor surgery.
MR imaging was done within 5 wk before surgery or tumor biopsy (mean, 15 d; median, 14 d; range, 1–35 d). 18F-FET PET scans were obtained within a mean interval of 8 d (median, 6 d; range, 1–22 d), 18F-DOPA PET scans within a mean interval of 6 d (median, 3 d; range, 1–18 d) before surgery. Histopathology served as a gold standard in all patients to verify diagnosis and the presence of viable tumor tissue. The study design is shown in Figure 1.

Schematic outline of study. Within 35 d before tumor surgery or biopsy, MR imaging (mean, 15 d prior) and 18F-FET PET/CT (mean, 8 d) and 18F-DOPA PET/CT (mean, 6 d) were performed. Histopathology served as gold standard. Mean intervals to surgery are noted in time scale.
Tracer Synthesis and PET/CT
18F-FET was synthesized in-house on a TRACERlab FX-FN synthesis module (GE Healthcare) as previously described (23). 18F-FET was obtained at a 37% ± 5% radiochemical yield (non–decay-corrected), with a radiochemical purity of greater than 99%, as assessed by high-performance liquid chromatography and thin-layer chromatography analysis. 18F-DOPA was purchased from IASON GmbH.
PET was performed on a dedicated PET/CT scanner (Biograph mCT 64; Siemens). 18F-DOPA (175 ± 39 MBq) and 18F-FET (217 ± 13 MBq) were injected intravenously. CT scans for attenuation correction were acquired after 15 min (18F-DOPA) and 10 min (18F-FET), respectively, using a low-dose protocol (80 mAs, 120 kV, a 512 × 512 matrix, 5-mm slice thickness, increment of 30 mm/s, rotation time of 0.5 s, and pitch index of 0.8). PET emission data were acquired in 3-dimensional mode with a 200 × 200 matrix for 20 min (18F-DOPA) and 10 min (18F-FET), respectively. After decay and scatter correction, PET data were reconstructed iteratively with attenuation correction using dedicated software (Esoft; Siemens).
Image Analysis
Images were analyzed as described by Fueger et al. (15). In brief, images were first inspected visually. Then the axial PET image slice displaying the maximum tumor uptake was selected. Tumor regions of interest (ROIs) were defined in 2 ways. First, a standardized 10-mm circular region was placed over the area with the peak activity. This first ROI was used to derive maximum standardized uptake values (SUVmax) and mean SUVs (SUVmean). A normal reference brain region was defined by drawing an ROI (diameter, 25 mm) involving the entire contralateral hemisphere at the level of the centrum semiovale to derive tumor-to-background ratios. For 18F-DOPA PET, the basal ganglia were assessed by an additional ROI (diameter, 10 mm) in the contralateral striatum. The radiotracer concentration in the ROIs was normalized to the injected dose per kilogram of patient’s body weight to derive the SUVs.
Histopathology and Immunohistochemistry
The biopsy samples were formalin-fixed and paraffin-embedded. All tumor samples were histologically assessed and graded using standard hematoxylin and eosin sections (3–4 μm) according to the criteria of the World Health Organization (24). The astrocytic origin of the tumors was confirmed by positive immunoreaction for the glial fibrillary acidic protein (1:200; Dako). Oligodendroglial features were assured by the distinct pattern of microtubule-associated protein 2 immunoreactivity (1:250; Dako). In addition, to determine the proliferation activity of each tumor, a labeling index (%) was calculated after immunostaining for MIB-1 (Ki67 1:50; Dako) by determining the number of positive nuclei among 100 tumor cells per high power field (HPF) in 10 HPFs.
Statistical Analysis
Quantitative data are presented as median, range, and mean ± SD. The Wilcoxon signed-rank test and the Mann–Whitney test were used for paired and unpaired comparisons of quantitative parameters. Corresponding accuracies for recurrence detection were calculated using histopathology and clinical follow-up for validation. The χ2 or Fisher exact test was conducted for comparison of frequency data between independent subgroups. Receiver-operating-characteristic curves were used to determine optimal cutoff values for defining disease recurrence and for the prediction of survival. The Fisher exact test was used to assess the association of 2 categoric variables.
Statistical analyses were performed using SPSS Statistics software for Windows (version 22.0; IBM, SPSS Inc.). All statistical tests were performed 2-sided, and a P value of less than 0.05 was considered to indicate statistical significance. No correction of P values was applied to adjust for multiple tests (25).
RESULTS
Tumor Characteristics
In 26 of 27 patients (96%), the brain lesions were located supratentorially. Ten subjects (37%) presented with temporal (temporooccipital) lesions, 7 (26%) with frontal lesions, 6 (22%) had parietal (parietooccipital) tumors, and 2 (7%) had multifocal disease. In 1 patient, the glioma involved the basal ganglia. The only infratentorial HGG was located in the cerebellum.
Final diagnosis was established by histopathology of surgical or biopsy samples. Seventeen of 22 patients with recurrent disease had glioblastoma multiforme (GBM). In 2 patients, a GBM had evolved from grade III oligodendroglioma. Two patients had an anaplastic astrocytoma, whereas 1 patient suffered from a grade III oligoastrocytoma.
In 4 of 5 patients with suspected primary GBM, the clinical diagnosis was confirmed by histopathology. The remaining patient had a pilocytic grade I astrocytoma.
Visual PET Image Analysis
All primary and recurrent HGGs showed enhanced 18F-DOPA and 18F-FET uptake (sensitivity, 100%). All lesions were clearly delineated from normal brain tissue. Overall, the 2 tracers showed a matching image pattern on visual assessment (Fig. 2).
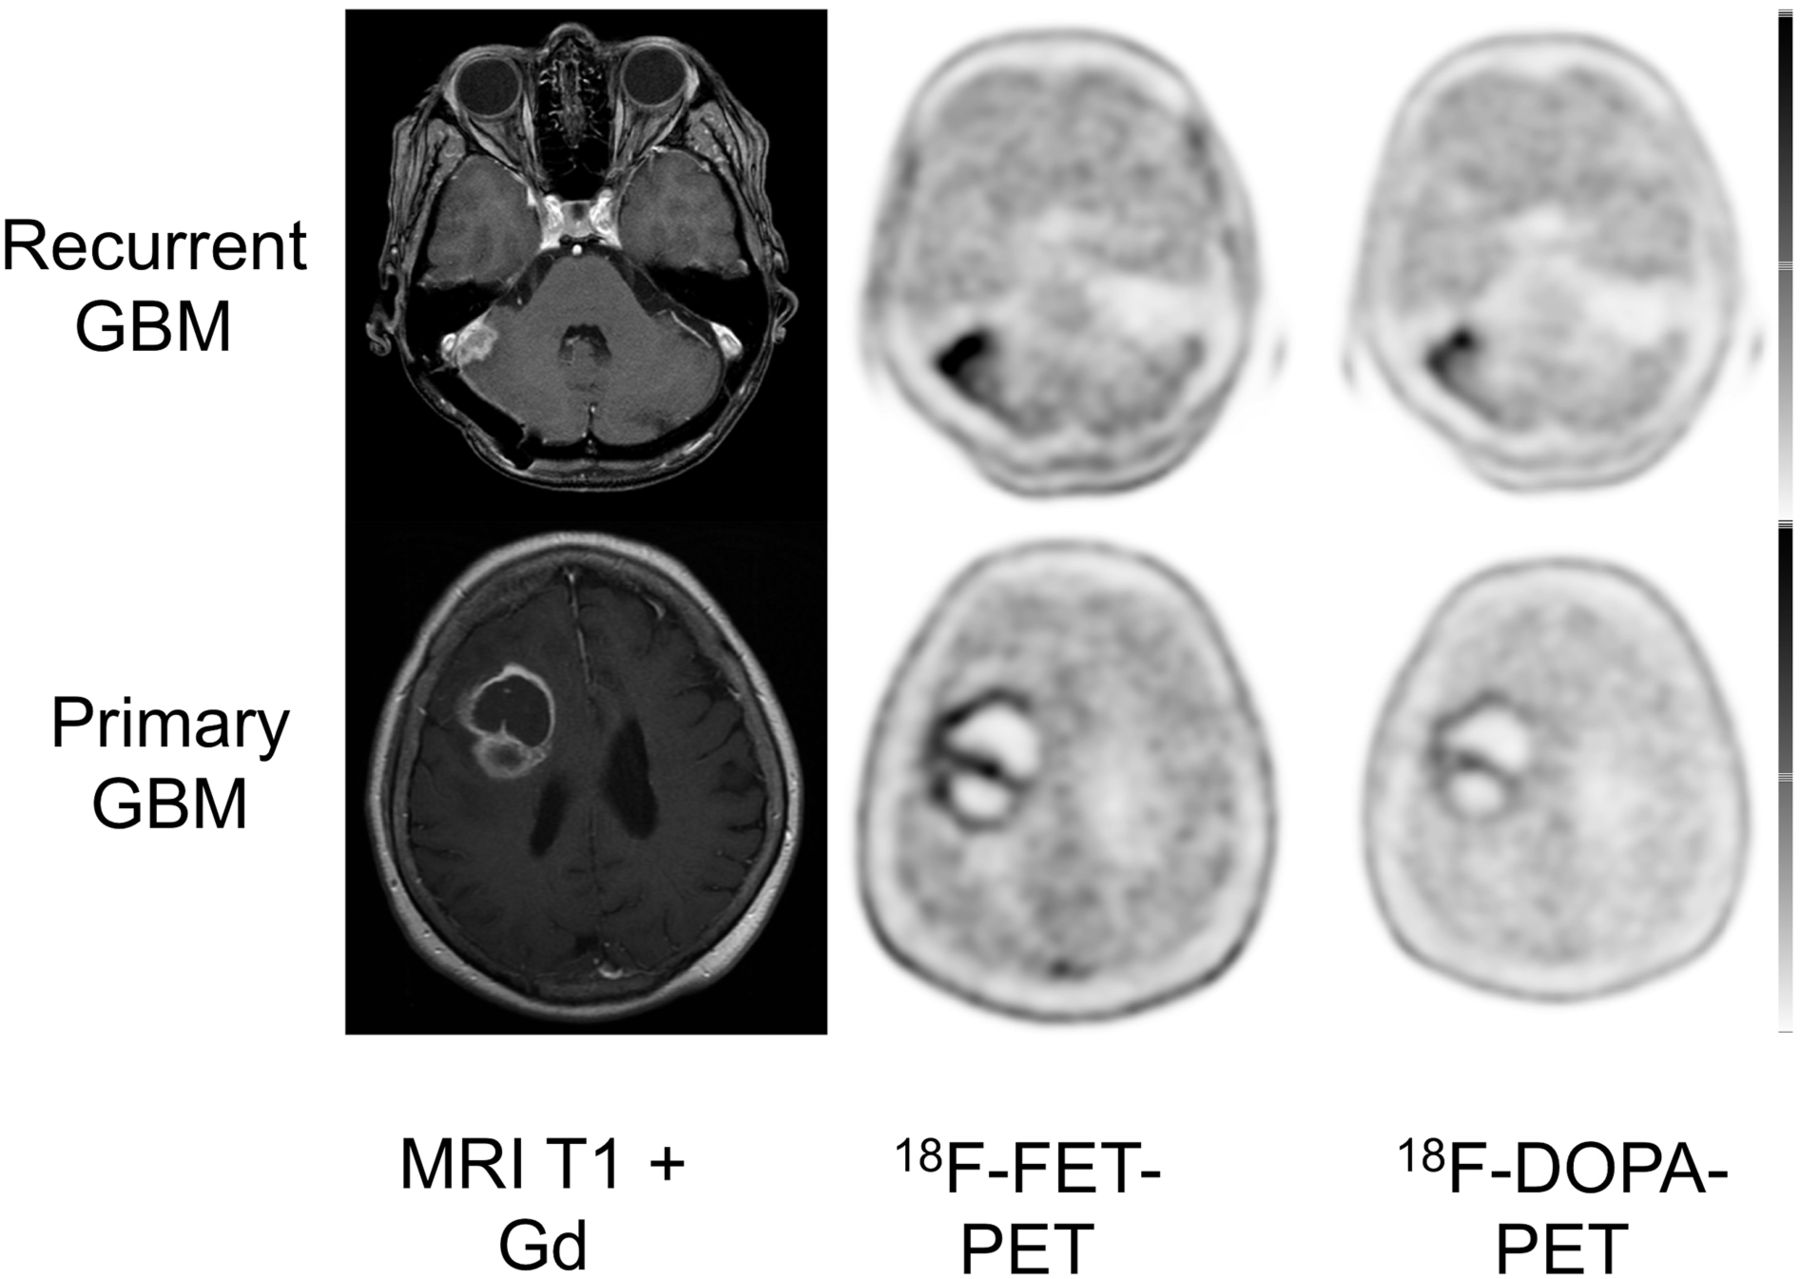
Display of transaxial contrast-enhanced T1-weighted MR imaging, 18F-FET, and 18F-DOPA PET/CT scans of patient with recurrent GBM and primary GBM. In both patients, 18F-FET uptake (SUVmax and SUVmean, 6.1 and 5.6, respectively) was higher than that of 18F-DOPA (SUVmax and SUVmean, 4.4 and 2.5, respectively).
The tumor distribution of both tracers was homogeneous and comparable. In the patients with multifocal glioblastoma both 18F-DOPA and 18F-FET depicted all lesions (Fig. 3). Visually, individual differences in uptake intensity occurred, without a tracer preference; however, these were not of relevance for image interpretation. Despite significant basal ganglia 18F-DOPA uptake (SUVmean, 2.6 ± 0.7), tumor visualization was possible in all patients (Fig. 4).
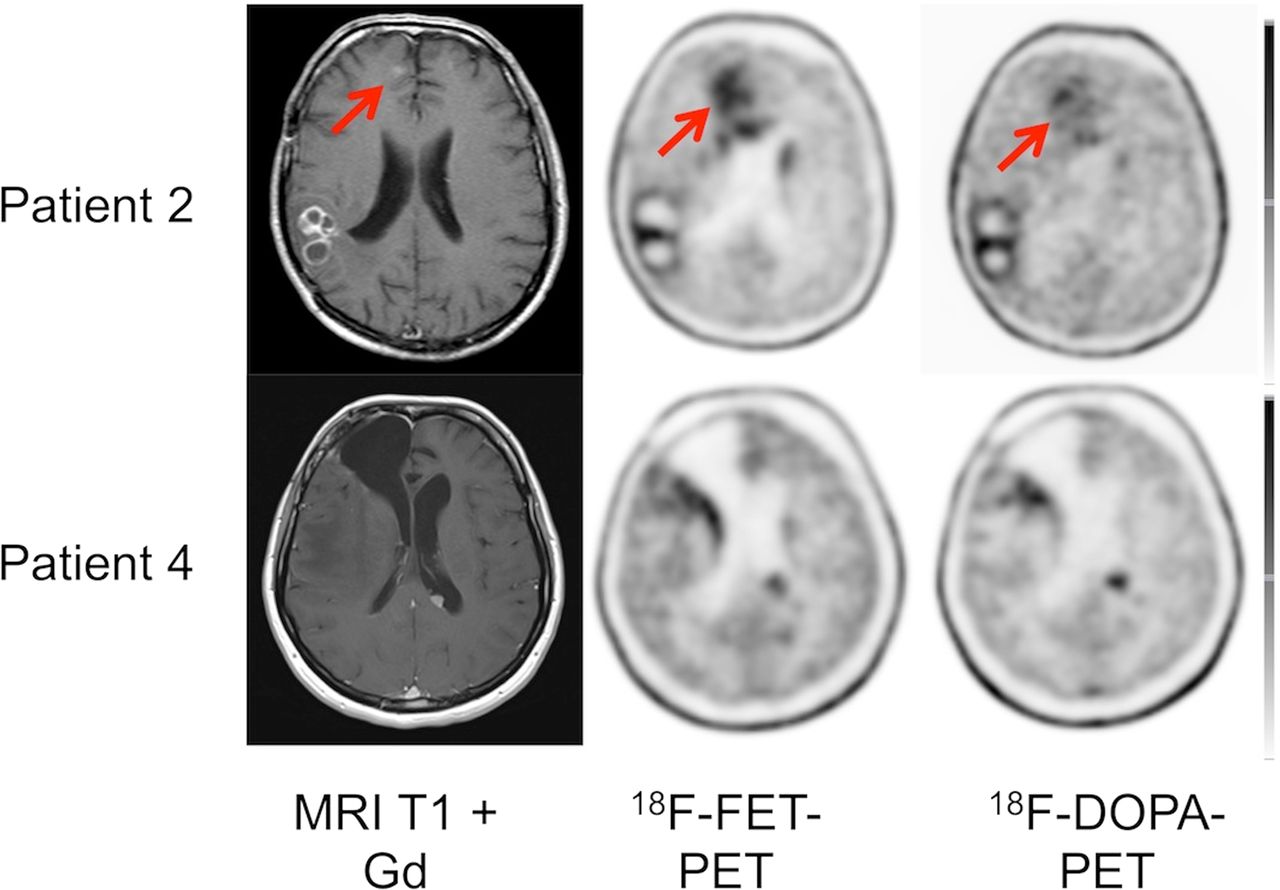
Display of transaxial contrast-enhanced T1-weighted MR imaging, 18F-FET, and 18F-DOPA PET/CT scans of 2 patients with multifocal GBM. In both patients, 18F-FET and 18F-DOPA depicted all lesions.

Display of transaxial 18F-FET and 18F-DOPA PET/CT scans of patient with primary glioma affecting basal ganglia. Striatal uptake does not significantly compromise tumor delineation.
Semiquantitative Image Analysis
In newly diagnosed and recurrent HGG, visual analysis of both tracers revealed no difference in tumor uptake pattern. However, differences in semiquantitative parameters existed. The SUVmean and SUVmax for 18F-FET was higher than that of 18F-DOPA (4.0 ± 2.0 and 4.9 ± 2.3 vs. 3.5 ± 1.6 and 4.3 ± 2.0, respectively; both P < 0.001).
Background SUVmean and SUVmax were similar for 18F-FET and 18F-DOPA (1.0 ± 0.2 and 1.5 ± 0.3 vs. 1.0 ± 0.3 and 1.4 ± 0.3; P = not significant). 18F-FET and 18F-DOPA SUVmean and SUVmax were closely correlated (r = 0.943; P < 0.0001). Consistently, TBR for SUVmean and SUVmax were higher for 18F-FET than for 18F-DOPA (SUVmean, 3.8 ± 1.7 vs. 3.4 ± 1.2; SUVmax, 3.3 ± 1.6 and 3.0 ± 1.1, P = 0.004 and 0.086, respectively) (Table 2).
Semiquantitative Analysis of 18F-DOPA and 18F-FET
Corresponding SUVmax, SUVmean, and tumor-to-background values for 18F-DOPA and 18F-FET are shown for both subgroups (newly diagnosed and recurrent HGG) in Table 2.
DISCUSSION
On the basis of previous studies that have demonstrated a high accuracy of 18F-DOPA imaging for detecting primary and recurrent brain tumors and a significant impact on patient management (26,27), we have recently initiated a randomized multicenter trial to determine the impact of 18F-DOPA imaging on patient outcome by randomizing patients with suspected HGG recurrence into those who are managed using conventional diagnostic imaging versus those who will receive conventional imaging plus 18F-DOPA PET (28). However, only a few sites in the United States offer 18F-DOPA brain tumor imaging whereas European clinics more frequently provide 18F-FET services. Thus, enrollment into the trial would be greatly facilitated if both 18F-FET and 18F-DOPA PET provide comparable diagnostic information and could thus be used for this trial. Before modifying the trial, a direct comparison of these 2 PET probes is, however, needed.
18F-labeled amino acids generally share the L-type amino acid transporters LAT1 and LAT2 (29–31). We therefore expected a similar distribution of these probes in HGG. By visual analysis, tracer distribution was indeed comparable, and both probes provided near-identical information. Differences in tumor-to-background ratios were negligible. Thus, both imaging probes provided concordant information.
By semiquantitative analysis, SUVmean and SUVmax and TBR of SUVmean were significantly higher for 18F-FET than 18F-DOPA. This contrasts a recent report (23), in which quantitative 18F-DOPA and 18F-FET PET were compared in 8 patients with recurrent low-grade astrocytoma and 8 patients with high-grade glioblastoma. 18F-DOPA demonstrated superior contrast ratios for lesions outside the striatum (23). The authors argued that 18F-DOPA uptake occurs via both the LAT1 and the LAT2 systems, whereas 18F-FET is mainly transported by LAT2 (29,32). However, the in vivo relevance of this phenomenon for the pharmacokinetics of 18F-DOPA versus those of 18F-FET remains unknown (33). Additionally, the transport mechanism of 18F-FET may be more complex. Although increased uptake of 18F-FET was observed in gliomas and squamous cell carcinomas, no uptake of 18F-FET was found in many extracranial tumors, especially in lymphomas and adenocarcinomas (34). This finding is in contrast to other tyrosine derivatives such as l-11C-tyrosine, 2-18F-fluoro-l-tyrosine, and l-3-18F-fluoro-α-methyltyrosine. As a possible explanation, 18F-FET may be taken up via a specific subtype of system L other than LAT1.
Transstimulation experiments in Xenopus laevis oocytes expressing LAT1 indicated that 18F-FET influx via LAT1 was poor (30). It is tempting to speculate that 18F-FET is selectively transported by LAT2. 18F-FET transport in F98 glioma cells, however, is shared by serine, which is a substrate of LAT2 but not of LAT1 (20). At the same time, 18F-FET shows no uptake in inflammatory tissue where LAT2 is not expressed (31,35). Therefore, it remains unclear whether the different results in both papers can be attributed to the particular tracer uptake or if they were caused by different study methodology.
A more likely explanation for the conflicting data may be the rather small patient sample size of the Heidelberg group, which only included 8 subjects with HGG. Thus, larger studies are needed to elucidate the subtle differences in the kinetics of the 2 PET probes.
The lower 18F-DOPA SUV found in the current study may also be explained by peripheral aromatic amino acid decarboxylase activity that reduces the amount of tracer available for transport into tumor cells. Carbidopa administration might have led to higher tumor uptake. However, the effect of carbidopa administration for brain tumor imaging is still controversial (36–38).
The current study has several limitations. Because this study focused on HGG, patients with low-grade gliomas were not included. Because of logistic reasons, we could not enroll more than 5 patients with suspected primary HGG. However, the ongoing multicenter trial involves only patients with suspected brain tumor recurrence. Dynamic evaluation of 18F-FET PET has shown high diagnostic power in tumor grading in untreated and recurrent tumors (39,40). We did not perform dynamic acquisitions to further investigate tracer kinetics. This approach was chosen to make the multicenter trial more practical. Moreover, the slightly different start of emission images (15 vs. 10 min for 18F-DOPA and 18F-FET) and the different scan duration (20 vs. 10 min for 18F-DOPA and 18F-FET) have to be mentioned. Ideally, ROI definition would have been performed on MR images and then transferred to the PET images; however, because of heterogeneous MR acquisition protocols this was impossible. ROI definition for each tracer was done according to the corresponding hottest pixel to secure a high interobserver reproducibility, but also reanalysis defining the ROIs for both tracers in the same slice after aligning both PET images confirmed our findings.
CONCLUSION
18F-FET showed higher SUVs and TBR for SUVmean in HGG than 18F-DOPA if static imaging protocols were used, which are best suited for centers with a heavy daily workflow. 18F-FET showed higher SUVs and TBR for SUVmean in HGG than 18F-DOPA. However, both tracers depicted all primary and recurrent brain tumors. Given the similar tumor tracer distribution and excellent correlation between 18F-FET and 18F-DOPA SUVs, we conclude that both PET probes of amino acid transport can be used in trials and clinical routine.
DISCLOSURE
The costs of publication of this article were defrayed in part by the payment of page charges. Therefore, and solely to indicate this fact, this article is hereby marked “advertisement” in accordance with 18 USC section 1734. No potential conflict of interest relevant to this article was reported.
Footnotes
Published online Aug. 14, 2014.
- © 2014 by the Society of Nuclear Medicine and Molecular Imaging, Inc.
REFERENCES
- Received for publication March 21, 2014.
- Accepted for publication July 16, 2014.


