


Abstract
Posttreatment high-grade gliomas are usually monitored with contrast-enhanced MRI, but its diagnostic accuracy is limited as it cannot adequately distinguish between true tumor progression and treatment-related changes. According to recent Response Assessment in Neuro-Oncology recommendations, PET overcomes this limitation. However, it is currently unknown which tracer yields the best results. Therefore, a systematic review and metaanalysis were performed to compare the diagnostic accuracy of the different PET tracers in differentiating tumor progression from treatment-related changes in high-grade glioma patients. Methods: PubMed, Web of Science, and Embase were searched systematically. Study selection, data extraction, and quality assessment were performed independently by 2 authors. Metaanalysis was performed using a bivariate random-effects model when at least 5 studies were included. Results: The systematic review included 39 studies (11 tracers). 18F-FDG (12 studies, 171 lesions) showed a pooled sensitivity and specificity of 84% (95% confidence interval, 72%–92%) and 84% (95% confidence interval, 69%–93%), respectively. O-(2-18F-fluoroethyl)-l-tyrosine (18F-FET) (7 studies, 172 lesions) demonstrated a sensitivity of 90% (95% confidence interval, 81%–95%) and specificity of 85% (95% confidence interval, 71%–93%). For S-11C-methyl)-l-methionine (11C-MET) (8 studies, 151 lesions), sensitivity was 93% (95% confidence interval, 80%–98%) and specificity was 82% (95% confidence interval, 68%–91%). The numbers of included studies for the other tracers were too low to combine, but sensitivity and specificity ranged between 93%–100% and 0%–100%, respectively, for 18F-FLT; 85%–100% and 72%–100%, respectively, for 3,4-dihydroxy-6-18F-fluoro-l-phenylalanine (18F-FDOPA); and 100% and 70%–88%, respectively, for 11C-choline. Conclusion: 18F-FET and 11C-MET, both amino-acid tracers, showed a comparably higher sensitivity than 18F-FDG in the differentiation between tumor progression and treatment-related changes in high-grade glioma patients. The evidence for other tracers is limited; thus, 18F-FET and 11C-MET are preferred when available. Our results support the incorporation of amino-acid PET tracers for the treatment evaluation of high-grade gliomas.
PET was recently recommended by the Response Assessment in Neuro-Oncology working group for follow-up during and after treatment of high-grade gliomas, because conventional MRI is not able to reliably differentiate tumor progression from treatment-related changes (1). This differentiation is of the utmost importance for making adequate treatment decisions and determining prognosis. Contrast enhancement on conventional MRI has been classically used to identify tumor progression (2,3). However, treatment effects such as pseudoprogression or radiation necrosis occur in about one third of the high-grade glioma patients (4). These treatment effects result in blood–brain barrier disruption and look like tumor progression on enhanced MRI (5–8), hindering reliable differentiation of tumor progression from treatment changes.
PET was recently incorporated in the Response Assessment in Neuro-Oncology guidelines in addition to MRI, because PET adds metabolic information on tracer accumulation to the anatomic information provided by MRI. The most frequently used PET tracer, 18F-FDG, is glucose-based. However, in brain tumors, the use of 18F-FDG is considered to be limited because of the relatively high glucose metabolism in normal brain tissue (9). Therefore, the Response Assessment in Neuro-Oncology group recommends the use of amino-acid PET for differentiation between treatment-related changes and true tumor progression if PET is used (1). In particular, the tracers S-11C-methyl)-l-methionine (11C-MET), O-(2-18F-fluoroethyl)-l-tyrosine (18F-FET), and 3,4-dihydroxy-6-18F-fluoro-l-phenylalanine (18F-FDOPA) were suggested to have a higher diagnostic accuracy than MRI for this purpose (1).
Although PET might be beneficial for differentiation of tumor progression from treatment changes in patients with high-grade glioma, until now it has been unclear which of the PET tracers can best differentiate tumor progression from treatment changes. This systematic review and metaanalysis aimed to provide an overview of the diagnostic accuracy of all studied PET tracers for distinguishing true tumor progression from treatment-related changes in high-grade glioma patients.
MATERIALS AND METHODS
This systematic review and metaanalysis were performed according to the PRISMA criteria (Preferred Reporting Items for Systematic Reviews and Metaanalysis) (10). Supplemental Table 1 shows the full criteria checklist (supplemental materials are available at http://jnm.snmjournals.org). Additionally, the AMSTAR 2 guidelines (A Measurement Tool to Assess Systematic Reviews) and the Cochrane handbook for systematic reviews of diagnostic test accuracy were used (11).
Search Strategy
We searched PubMed, Embase, and Web of Science using a search strategy consisting of database keywords and text words, with the latest search taking place on March 29, 2018. The search terms comprised descriptions of glioma, PET, treatment evaluation, and variations of these terms. The supplemental methods present the full search strategy. No filters were used. Studies in English, French, and German were included. Studies in other languages were excluded. Gray literature (conference abstracts) was also included in the search because Embase contains conference proceedings.
Selection Criteria
Studies were selected if they included adult high-grade glioma patients who received first-line standard therapy according to the protocol of Stupp et al. (12); if the patients underwent PET imaging after treatment; if a definite diagnosis, either tumor progression or treatment-related changes, was established by histologic, imaging, or clinical follow-up or a combination of these; and if 2 × 2 tables could be extracted.
Brain stem or optic gliomas were excluded. Studies were also excluded if their results were not described separately for the patient population of interest in our analysis (e.g., if the resulting 2 × 2 table included patients with tumors other than high-grade gliomas, children, or patients not treated according to the Stupp protocol). Case reports and studies with fewer than 5 eligible patients per PET tracer were also excluded. Studies that were conducted before 2005 were excluded because temozolomide, which is known to increase the occurrence of treatment-related changes (5,13), was not yet routinely incorporated in standard therapy following the Stupp protocol. Studies in which the relevant patient group happened to include exclusively patients with tumor progression (and no patients with treatment-related changes) were included in the systematic review but excluded from the metaanalysis because specificity cannot be calculated for these studies.
Study Selection, Data Extraction, and Quality Assessment
After duplicates were eliminated, studies were independently screened by 2 authors for eligibility based on title, abstract, and, subsequently, full text. Reference checks were performed for all included articles and for all obtained reviews on the topic of interest.
Data from the included studies were extracted with a data extraction form. Extracted data contained true-positives, false-positives, true-negatives, false-negatives, and general characteristics. General characteristics included total number of patients, study design, mean age and range, sex, tumor histology, used reference standard, and PET characteristics. If multiple methods of examining the PET data were described that led to different 2 × 2 tables, then only the method with the highest accuracy was used for the forest plots and metaanalysis. However, all methods and 2 × 2 tables were extracted and are provided in the Results section. Study quality was assessed according to the Quality Assessment of Diagnostic Accuracy Studies (QUADAS-2) (14).
Statistical Analysis
Sensitivity and specificity with 95% confidence interval (95%CI) were calculated for all PET tracers in RevMan 5.3 (Cochrane Collaboration). The generated forest plots were inspected visually to assess heterogeneity. We evaluated whether the following factors could explain heterogeneity: study type, mean age of patients, World Health Organization (WHO) type, cutoff value of the index test, and type of follow-up. We performed subgroup analysis (≥5 studies) to explore and explain heterogeneity in test characteristics. Moreover, we evaluated whether outliers could be explained by study or patient characteristics, and we performed a sensitivity analysis without small studies (≤10 patients) to evaluate the robustness of the results.
Bivariate random-effects models were used, because heterogeneity is to be expected in studies on the accuracy of diagnostic tests (15). Pooled estimates of sensitivity, specificity, positive likelihood ratios, and negative likelihood ratios with 95%CI were calculated for each index test consisting of 5 or more studies, using the Midas module for metaanalysis of diagnostic test accuracy studies in Stata/SE 12.1.
To provide insight on the potential clinical consequences, we established a hypothetical cohort of 100 high-grade glioma patients suggestive of progression for each PET tracer. We calculated 2 × 2 tables using the mean tumor prevalence (based on the reference standard of the cohort studies included in this metaanalysis), the pooled sensitivities, and the specificities for each PET tracer, and we present the number of misclassifications, false-positives, and false-negatives.
RESULTS
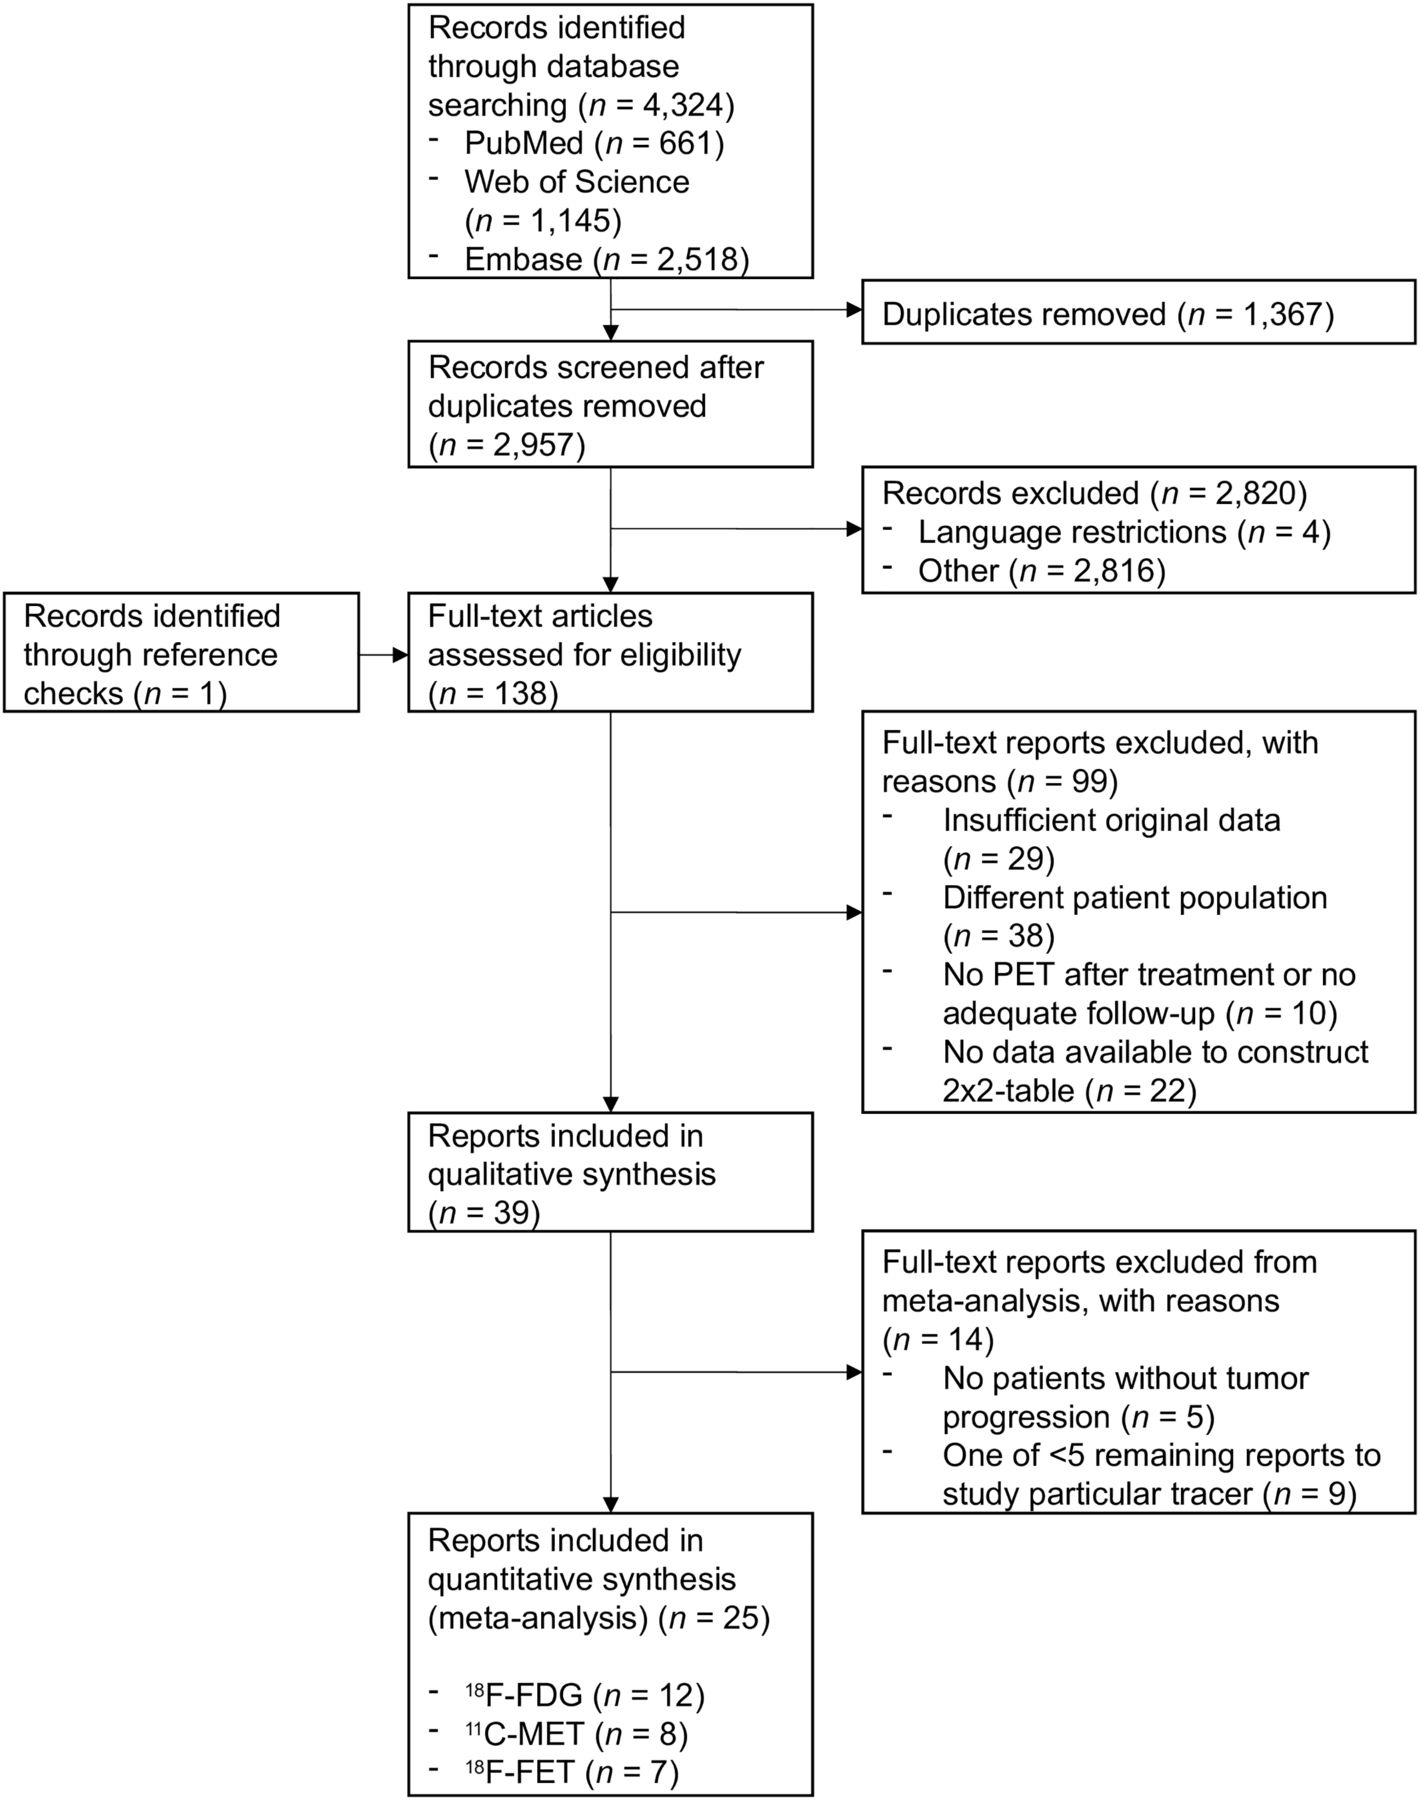
In total, 2,957 unduplicated studies were identified through our electronic database search (Fig. 1 shows the flow chart). Four of these studies were excluded because of language restrictions. After screening based on title and abstract, the 137 remaining studies underwent full-text eligibility assessment, which resulted in the identification of 38 relevant studies (Supplemental Table 2 provides an overview of why excluded studies were rejected). Reference checks of the included studies yielded one additional study that was included (16), thus giving a total inclusion of 39 studies in this systematic review (7,16–53). These studies covered a total of 11 different tracers (Supplemental Table 3). Six studies did not include patients with treatment-related changes (16,25,36,47,48,52), making them noneligible for the metaanalysis because specificity cannot be calculated. The tracers for which at least 5 studies remained, and thus for which metaanalysis was performed, were 18F-FDG (12 studies), 11C-MET (8 studies) and 18F-FET (7 studies). The study characteristics of the included studies are shown in Supplemental Table 4.

Flow chart of included studies. Tracer abbreviations are shown in Supplemental Table 3.
The included studies consisted of 771 patients with 832 lesions (either tumor progression or treatment-related changes). The mean age of the patients was 50.2 y, with 65% being male (Supplemental Table 5). The initial lesion was proven to be WHO III in 17.4% (n = 145) and WHO IV in 57.5% (n = 478). The remaining 25.1% (n = 209) were unspecified WHO III or IV gliomas. Mean tumor prevalence was 73.4% (range, 33.3%–100%). As far as documented in the included studies, histologic follow-up was used in 30.9% (n = 257) of lesions, imaging in 14.4% (n = 120), clinical follow-up in 1.3% (n = 11), and a combination in 26.8% (n = 223). In 26.6% (n = 221) of lesions, follow-up was not specified on the individual lesion level. Several of the included studies analyzed 2 PET tracers per lesion (21,29,33–35,41,46,52,53); in total, 951 PET studies (Supplemental Table 5 shows the tracer distribution) were included.
The supplemental methods and Supplemental Table 6 describe the methodologic quality of the included studies.
The forest plots and pooled results are demonstrated in Table 1 and Figure 2, respectively. The 18F-FDG PET forest plot (12 studies, 171 PET scans) shows a substantial variation in both sensitivity and specificity, with relatively wide confidence intervals for specificity in particular. This variation can be explained by the relatively large number (6) of small studies (19,21,24,33,41,53) (n ≤ 10 patients) for 18F-FDG PET in general and a small number of included patients with treatment-related changes in particular. 18F-FDG PET showed a pooled sensitivity and specificity of 84% (95%CI, 72%–92%) and 84% (95%CI, 69%–93%), respectively. A sensitivity analysis with the exclusion of all small studies with no more than 10 patients leads to a slightly lower pooled sensitivity and specificity of 82% (95%CI, 64%–92%) and 79% (95%CI, 61%–90%), respectively.
Pooled Analyses of PET Tracers

Forest plots with 2 × 2 tables, sensitivity, and specificity per study. TP = true positives; FP = false positives; FN = false negatives; TN = true negatives; CI = confidence interval. Tracer abbreviations are shown in Supplemental Table 3.
The 18F-FET PET forest plot (10 studies, 207 PET scans) shows more uniformity in the sensitivity and specificity between the different studies. Outliers on the low end of sensitivity (47) and specificity (39) can be explained by their low patient numbers. Pooled sensitivity and specificity for 18F-FET PET (excluding the 3 studies that did not include patients without tumor progression (36,47,52) are 90% (95%CI, 81%–95%) and 85% (95%CI, 71%–93%), respectively. A sensitivity analysis with the exclusion of one small study (39) (n = 8) showed a very similar pooled sensitivity and specificity of 90% (95%CI, 80%–96%) and 86% (95%CI, 72%–94%), respectively.
The forest plot for 11C-MET PET (9 studies, 164 PET scans) shows a consistently high sensitivity without any major outliers. Two outliers on the low end of specificity (7,30) can again be explained by their low number of patients with treatment-related changes and have broad confidence intervals. Pooled sensitivity and specificity for 11C-MET PET (excluding one study that did not include patients without tumor progression (48) are 93% (95%CI, 80%–98%) and 82% (95%CI, 68%–91%), respectively. A sensitivity analysis with the exclusion of the 2 small studies (21,30) leads to a pooled sensitivity and specificity of 91% (95%CI, 78%–97%) and 83% (95%CI, 68%–92%), respectively.
Eight alternative PET tracers (3′-deoxy-3′-18F-fluorothymidine [18F-FLT], 18F-FDOPA, 11C-choline, 18F-fluorocholine, 13N-ammonia, modified 11C-MET, α-11C-methyl-l-tryptophan, and 2-fluoropropionyl-labeled pegylated dimeric RGD peptide [18F-FPPRGD2]) have been studied for their ability to differentiate high-grade glioma tumor progression from treatment-related changes (Supplemental Table 3 provides an overview of the included PET tracers and their abbreviations). They have an insufficient number of independent reports to be considered in the pooled metaanalysis; however, individual study data are shown in Figure 2.
Particularly noteworthy are 18F-FLT and 18F-FDOPA, the most thoroughly studied alternative tracers. 18F-FLT (5 studies, 59 PET scans) has a sensitivity range of 93%–100% and a specificity range of 0%–100%, the latter due to the low number of included patients with treatment-related changes and thus broad confidence intervals. 18F-FDOPA (4 studies, 217 PET scans) has a sensitivity range of 85%–100% and a specificity range of 72%–100%.
Of the other included tracers, 11C-choline (2 studies, 28 PET scans) has a sensitivity of 100% in both studies and a specificity range of 70%–88%. 18F-fluorocholine (2 studies, 20 PET scans) has a sensitivity of 100% in both studies and a specificity of 100% in the one study in which it could be determined. 13N-ammonia (1 study, 18 PET scans) showed a sensitivity of 78% and a specificity of 67%. Modified 11C-MET (1 study, 49 PET scans) showed a sensitivity of 79% and a specificity of 94%. α-11C-methyl-l-tryptophan (1 study, 10 PET scans) showed a sensitivity and specificity of 100%, as did 18F-FPPRGD2 (1 study, 8 PET scans).
Study type, mean age, WHO type, cutoff value of the index test, and follow-up method (Supplemental Table 4) were evaluated as covariates but were unable to explain differences in sensitivity and specificity for all the studies and PET tracers.
To provide insight into the clinical implications of these results, the missed number of patients with true progression and the total number of misclassifications in a hypothetical cohort of 100 high-grade glioma patients were calculated for each PET tracer included in the metaanalysis. The average tumor prevalence of 73% (found in this systematic review) and the pooled sensitivity and specificity of each PET tracer were used in this analysis. With 18F-FDG PET, 12 cases of tumor progression would be missed. For 18F-FET and 11C-MET, there would be 7 and 5 missed tumors, respectively. 18F-FDG PET would show a total of 16 misclassified patients, and 18F-FET would show 11. 11C-MET would induce the lowest number of misclassifications, with 10 of the 100 patients being misclassified.
DISCUSSION
This systematic review and metaanalysis including 39 studies is, to our knowledge, the first to pool the results of all PET tracers for distinguishing tumor progression from treatment-related changes in high-grade glioma patients. This metaanalysis shows that PET can reliably differentiate tumor progression from treatment-related changes, with the highest diagnostic accuracy being reached among amino-acid tracers.
A substantial variety of PET tracers has been empirically studied for this purpose, including (among others) tracers that demonstrate glucose metabolism (18F-FDG) or amino-acid uptake (11C-MET, 18F-FET, 18F-FDOPA) or are markers of cell proliferation (18F-FLT) or membrane phospholipids (18F-fluorocholine, 11C-choline). 18F-FET and 11C-MET showed a higher sensitivity than 18F-FDG in differentiation between treatment-related changes and true progression.
18F-FDG is currently the most commonly used PET tracer in oncology (9) and, therefore, the most readily available. However, 18F-FDG PET showed the lowest accuracy of all repeatedly studied tracers, because of its relatively low sensitivity of 84%; this can be explained by the high physiologic uptake of glucose in the brain, making it more difficult to detect true tumor progression when a glucose-based tracer is used (9).
11C-MET and 18F-FET are, when available, preferred over 18F-FDG because of their higher sensitivity. Combining all the gathered evidence, there does not seem to be one particular PET tracer that should be recommended over other tracers. Although 11C-MET showed the highest sensitivity for tumor progression in the pooled analysis, its availability is limited to hospitals with an on-site cyclotron because of its short half-life of approximately 20 min (9). When it is not available, 18F-FET is a good alternative with similar diagnostic accuracy. Compared with 11C, 18F-based tracers (with a half-life of approximately 110 min) have the logistic advantage of not requiring an on-site cyclotron and allow use of the existing 18F-FDG–based infrastructure for their deliverance, thus facilitating their availability.
18F-FLT and 18F-FDOPA, as well as some other less common tracers, have shown promising results in a few studies and could be comparable to or competitive with 18F-FET and 11C-MET in terms of diagnostic accuracy. However, these tracers need to be studied more.
Previously, a systematic review and metaanalysis was performed for a similar patient population, in which different advanced MRI techniques were compared (54). When comparing these PET results with those MRI results, it is apparent that MR spectroscopy (the advanced MRI technique with the best results) seems to have a higher specificity (95%) than 11C-MET and 18F-FET PET. However, their sensitivities are comparable, and the diagnostic accuracies of these amino-acid PET tracers are at least similar to those of all other studied MRI techniques, including perfusion and diffusion MRI. Recently, it was demonstrated that 18F-FET PET outperforms diffusion MRI in differentiating treatment-related changes from tumor progression (55). An additional consideration is that the advanced MRI methods suffer from limitations such as challenging interpretation and frequent impairment by susceptibility artifacts; in contrast, amino-acid PET scan reading is relatively easy because of high tumor-to-background contrast (9). Further limitations of advanced MRI techniques are the lack of standardization of acquisition protocols and postprocessing methods and the large variety of thresholds of quantitative parameters (54,56). Disadvantages of amino-acid PET relative to MRI include the necessity of additional scanning, lower availability, lower spatial resolution, and higher expenses (9). Combining PET and MRI on hybrid devices might be able to circumvent some of the downsides of each individual imaging modality (57) and is more convenient for patients than separate investigations, but these systems are inherently costly.
Several limitations can be noted regarding this review. First, publication bias might have influenced the diagnostic accuracy of many of the tracers included in this review. This not only holds true for tracers that were used in only a few studies, but publication bias might also have played a role for 18F-FDG. Its diagnostic accuracy is higher than we expected in view of the apparent consensus that this tracer is only of moderate additional value to MRI for differentiating true tumor progression and treatment-related changes in gliomas because of the higher background uptake (1).
Second, the review included 9 abstracts (24–26,31,33,36,37,42,47). Although inclusion of abstracts (partially) prevents publication bias, the quality and extent of information provided in abstracts are limited and they usually have not undergone the same peer review process as full articles.
Third, a substantial variation exists between the included studies in terms of reference standard (Supplemental Table 4). Most patients for whom the reference standard is described have undergone some form of histologic or radiologic confirmation of the diagnosis. The reliability of histologic and radiologic confirmation may, however, not be equivalent. Furthermore, the reliability of the reference standard may differ among the included studies depending on the follow-up duration. Although pseudoprogression is most prevalent within the first 12 wk after completion of the concurrent chemoradiotherapy, it has been suggested that around one third of the cases occur more than 3 mo after concurrent chemoradiotherapy (3,58). However, no difference could be seen between early follow-up studies and studies that were conducted more than 3 mo after concurrent chemoradiotherapy.
Fourth, the method of judging PET positivity showed a large variation between the included studies (Supplemental Table 4). Many studies used a visual analysis, which is often unstandardized and may lead to clinician-dependent results. Moreover, semiquantitative cutoffs were often based on a receiver-operating-characteristic curve analysis that was itself partially based on patients who were not included in this review (e.g., low-grade glioma patients). Also, the different cutoffs in the semiquantitative analyses might have led to artificial differences in the trade-off between sensitivity and specificity among studies and tracers. A well-justified recommendation regarding cutoffs for the different PET tracers to optimally differentiate posttherapeutic changes from tumor progression is currently hindered by the high variability of the used cutoffs, even though it would be a valuable guideline for the clinician in daily practice. However, attempts are now being made to provide evidence-based recommendations for clinical use of PET imaging in glioma patients (59).
Fifth, the comparisons between different PET tracers in this review lack statistical support, as this metaanalysis contains largely noncomparative studies of the different PET tracers. Only 2 studies compared 18F-FDG and 11C-MET in the same patient population (21,46). We did not directly compare the PET tracers, because the differences in study design, patient groups, and reference standards can confound the differences in diagnostic accuracy (60).
Finally, the isocitrate dehydrogenase mutation status of patients was not provided for most included studies. The occurrence of treatment-induced changes in relation to isocitrate dehydrogenase mutation status should therefore be studied further.
To overcome some of the above-mentioned limitations, more large, prospective studies are needed, especially on PET tracers other than 18F-FDG, ideally testing more than one tracer in the same population such that results can be directly compared. These studies should use cutoffs that are predefined and are based on earlier studies (such as those included in this review) that study the same patient population. However, different postprocessing protocols may have considerable influence on metabolic measurements, and thus, predefined cutoffs should, for now, be considered with caution (61).
CONCLUSION
This metaanalysis demonstrated a clear advantage of 11C-MET and 18F-FET over 18F-FDG for differentiation between true progression and treatment-induced changes in patients with high-grade glioma, with 11C-MET and 18F-FET having the highest sensitivity and specificity, respectively. Diagnostic accuracy does not differ substantially between 11C-MET and 18F-FET. Hence, this metaanalysis supports the recommendations of the Response Assessment in Neuro-Oncology group of implementing amino-acid PET in the treatment response evaluation of patients with high-grade glioma. Several other PET tracers show promising results but have so far been insufficiently studied to warrant a direct comparison. The incorporation of the here-mentioned recommendations into clinical practice would be an important step in accurately differentiating true progression from treatment-related changes in high-grade glioma patients presenting with possible progression after treatment and is therefore highly relevant for making well-justified treatment decisions in this patient population.
DISCLOSURE
This work is supported by the University of Groningen (a Mandema stipendium to Anouk van der Hoorn and a Junior Scientific Masterclass grant to Bart van Dijken). No other potential conflict of interest relevant to this article was reported.
KEY POINTS
QUESTION: Which PET tracer can best differentiate tumor progression from treatment changes in high-grade gliomas?
PERTINENT FINDINGS: This metaanalysis shows that 18F-FET and 11C-MET, both amino-acid tracers, had a comparably higher sensitivity than 18F-FDG in differentiation between tumor progression and treatment-related changes in high-grade glioma patients.
IMPLICATIONS FOR PATIENT CARE: Amino-acid PET should be implemented in the treatment follow-up of patients with high-grade glioma.
Footnotes
Published online Sep. 20, 2019.
- © 2020 by the Society of Nuclear Medicine and Molecular Imaging.
REFERENCES
- Received for publication July 15, 2019.
- Accepted for publication August 21, 2019.


Jump to section
Related Articles
Cited By...
- Diagnostic Value of PET Tracers in Differentiating Glioma Tumor Recurrence from Treatment-Related Changes: A Systematic Review and Meta-Analysis
- SNMMI Procedure Standard/EANM Practice Guideline for Brain [18F]FDG PET Imaging, Version 2.0
- Hybrid 18F-FET PET and Perfusion MRI to Differentiate Disease Progression from Treatment-Related Changes in Malignant Brain Tumors
- Utility of Amino Acid PET in the Differential Diagnosis of Recurrent Brain Metastases and Treatment-Related Changes: A Meta-analysis
- Hybrid 18F-Fluoroethyltyrosine PET and MRI with Perfusion to Distinguish Disease Progression from Treatment-Related Change in Malignant Brain Tumors: The Quest to Beat the Toughest Cases
- Amino Acid Tracer PET MRI in Glioma Management: What a Neuroradiologist Needs to Know
- Positron emission tomography and perfusion weighted imaging in the detection of brain tumors recurrence: A meta-analysis
- Preclinical and first-in-human-brain-cancer applications of [18F]poly-(ADP-ribose) polymerase inhibitor PET/MR