


Abstract
PET with the glucose analog 18F-FDG is increasingly used to monitor tumor response in patients undergoing chemotherapy and chemoradiotherapy. Numerous studies have shown that 18F-FDG PET is an accurate test for differentiating residual viable tumor tissue from therapy-induced fibrosis. Furthermore, quantitative assessment of therapy-induced changes in tumor 18F-FDG uptake may allow the prediction of tumor response and patient outcome very early in the course of therapy. Treatment may be adjusted according to the chemosensitivity and radiosensitivity of the tumor tissue in an individual patient. Thus, 18F-FDG PET has an enormous potential to reduce the side effects and costs of ineffective therapy. This review focuses on the practical aspects of 18F-FDG PET for treatment monitoring and on how to perform a quantitative assessment of tumor 18F-FDG uptake in clinical studies.
Two excellent continuing education articles (1,2) recently summarized the literature on the use of PET with the glucose analog 18F-FDG for monitoring chemotherapy and chemoradiotherapy in a variety of malignant tumors. Although these previous articles and several other publications (3–15) discussed specific applications of 18F-FDG PET for different tumor types, this review focuses on the practical aspects of data acquisition and analysis of 18F-FDG PET studies acquired for treatment monitoring. In addition, it provides an update on recent studies in which a quantitative assessment of tumor glucose use was used to predict tumor response and discusses the application of 18F-FDG PET to the monitoring of new targeted forms of anticancer therapy.
LIMITATIONS OF CONVENTIONAL TECHNIQUES FOR MONITORING ANTICANCER THERAPY
Conventional criteria for monitoring the cytotoxic therapy of malignant tumors are defined by the therapy-induced reduction of tumor size, generally measured by radiologic techniques. The World Health Organization (WHO) has defined standardized criteria for the assessment of tumor response. According to these criteria, the size of the tumor should be measured in 2 perpendicular diameters. Tumor response is defined as a therapy-induced reduction of the product of these 2 diameters by at least 50%. If no lesion remains visible after therapy, the response is classified as a complete response. Otherwise, the response is classified as a partial response. Given the broad acceptance of the WHO response criteria, it is quite instructive to examine the data that formed the basis for the WHO definitions. In the publication of the response criteria in 1981 (16), the major reference for justifying a 50% decrease in tumor size as a criterion for tumor response was a study performed by Moertel and Hanley in 1976 (17).
That article described the results of the following experiment. Solid wooden spheres were placed on a soft mattress and covered with a layer of rubber foam. Sixteen experienced oncologists measured the diameters of these spheres in random order by using rulers or calipers. In a detailed analysis of the data, Moertel and Hanley pointed out that because of measurement errors, the sizes of identical spheres differed by at least 25% in 25% of the measurements but by at least 50% in only 6.8% of the measurements. Thus, the use of a 25% decrease in lesion size as a criterion for tumor response would bear the risk of an unacceptably high response rate (25%) when the tumor was in fact unchanged in size. The false-positive rate would be only 6.8% if a decrease in lesion size of 50% were used as a criterion. This false-positive rate was considered acceptable, and a 50% decrease in tumor size was recommended as a criterion for tumor response in clinical studies.
This recommendation was accepted by the panel defining the WHO criteria and then was translated without further evaluation to all modern imaging techniques. More recently, new response evaluation criteria for solid tumors were proposed by the National Cancer Institute and the European Association for Research and Treatment of Cancer. However, the main change compared with the WHO criteria is only that the bidimensional measurements required by the WHO criteria have been replaced by unidimensional measurements (18). The new criteria define response as a 30% decrease in the largest diameter of the tumor. For a spheric lesion, this value is equivalent to a 50% decrease in the product of 2 diameters (19). Thus, when tumors are evaluated after therapy by MRI or multislice CT, the criteria for response stem from an experiment that was performed more than 25 y ago and that determined the accuracy with which physicians could measure tumor size by palpation.
In addition to this historic and more or less arbitrary definition of response, there is an inherent limitation of using morphologic criteria for the assessment of tumor response. It is known that for solid tumors, a reduction in tumor size by effective therapy may take considerable time. Therefore, tumor response generally is assessed after several weeks or even months of therapy. Thus, patients with nonresponding tumors are treated without benefit over a long period of time. This situation represents a significant problem for monitoring of the chemotherapy of solid tumors because a considerable percentage or even the majority of treated tumors do not respond to therapy. Furthermore, the assessment of tumor response by morphologic criteria may be inaccurate even after the completion of therapy because scar tissue formation and edema often mask tumor regression. Therefore, tumors that are actually responding well may be classified as nonresponding. This problem frequently occurs after radiotherapy.
In addition to radiologic criteria, tumor response also can be evaluated histopathologically. Histopathologic response is commonly defined as the percentage of viable tumor relative to therapy-induced fibrosis. This percentage is expressed as a regression score. The most commonly used histopathologic regression score is probably the Salzer-Kuntschik score for osteosarcomas (20). Similar scoring systems for tumor response have been established for other tumor types, such as non–small cell lung cancer (21), esophageal cancer (22), and gastric cancer (23). Histopathologic regression scores have shown a close correlation with survival. In particular, patients with no or only minimal (<10%) residual tumor have been found to have a markedly improved prognosis (21–24). Therefore, histopathologic response often is used as the gold standard for the evaluation of imaging techniques. However, complete resection of the tumor is necessary for a valid histopathologic response evaluation. Analysis of biopsy specimens does not provide reliable results because of tumor heterogeneity (22,23). Thus, histopathologic response usually can be determined only after the completion of therapy and cannot be used to modify treatment. For these reasons, there is a clear need for techniques that allow noninvasive monitoring of tumor response early in the course of therapy.
MONITORING OF TUMOR RESPONSE BY 18F-FDG PET: METHODOLOGICAL CONSIDERATIONS
Visual Interpretations Versus Quantitative Measurements of Tumor Glucose Use
For the staging of malignant tumors, 18F-FDG PET scans are assessed visually, and focally increased 18F-FDG uptake not explained by the normal biodistribution of 18F-FDG suggests metastatic disease. In a similar way, PET scans also may be assessed after the completion of chemotherapy or radiotherapy. 18F-FDG uptake should have normalized at this time, and focal 18F-FDG uptake generally indicates residual viable tumor tissue. As summarized in Table 1 (25–35) and as described in detail by Kostakoglu and Goldsmith (1,2), there are now numerous studies of malignant lymphomas as well as several types of solid tumors indicating that focal 18F-FDG uptake after therapy is a relatively specific sign of viable tumor tissue and is associated with a poor prognosis. Quantitative analysis generally is not required at this time to make the diagnosis of residual tumor tissue. However, quantitative assessment of tumor metabolism becomes necessary when 18F-FDG PET scans are performed during treatment to predict subsequent tumor response. At this time, the metabolic activity of the tumor tissue has decreased in responders, but generally there still will be considerable residual 18F-FDG uptake (Fig. 1).

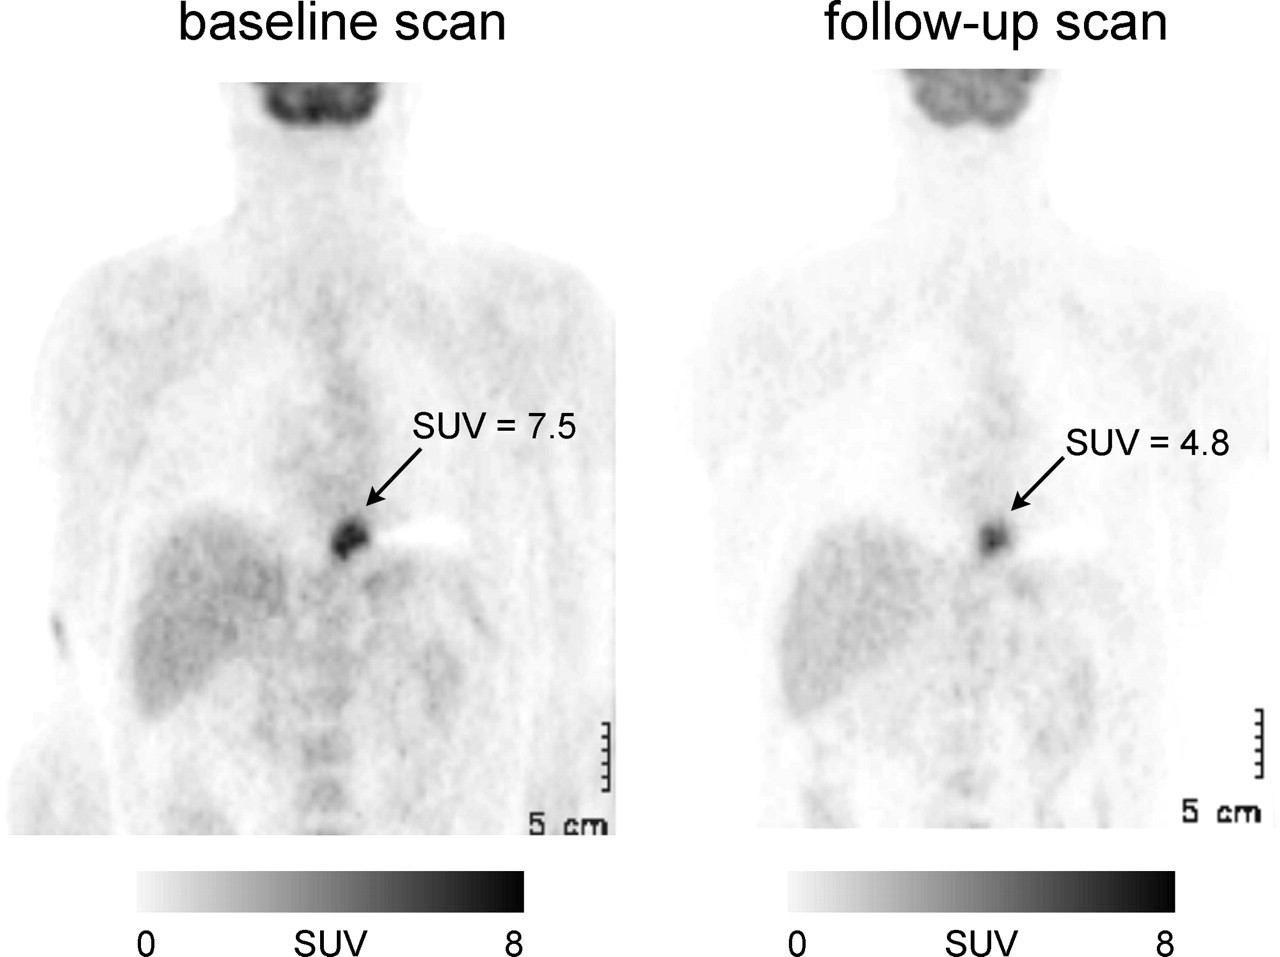
Examples of errors in calculation of SUVs. This patient with distal esophageal cancer was imaged before preoperative chemotherapy and after 2 wk of therapy. According to mean tumor SUVs in baseline and follow-up scans, tumor metabolic activity seems to have decreased significantly from 7.5 to 4.8. However, follow-up scan also demonstrates marked decrease in 18F-FDG uptake by all normal organs, for example, liver and brain. This finding indicates error in calculation of SUVs. In this case, injected dose had not been properly decay corrected for follow-up PET study. Thus, for calculation of SUVs, tissue activity concentration was divided by incorrectly high injected dose; accordingly, all SUVs in follow-up study were too low. Correct SUV in follow-up study was 7.0, indicating that there was no significant change in tumor metabolic activity.
Prognostic Relevance of Residual 18F-FDG Uptake After Completion of Chemotherapy or Chemoradiotherapy
In a recent study, Wieder et al. (36) evaluated the time course of changes in tumor 18F-FDG uptake in patients with locally advanced esophageal cancer treated with chemoradiotherapy followed by surgical resection. 18F-FDG PET was performed before chemoradiotherapy, 2 wk after the initiation of therapy, and 3–4 wk after the completion of chemoradiotherapy. After the third PET scans, the tumors were resected and tumor response was assessed histopathologically. Patients were classified as responders when there were fewer than 10% viable tumor cells in the resected specimens. In the baseline scans, there were no significant differences between the 18F-FDG uptake of responding tumors and that of nonresponding tumors. At the time of the first follow-up scan (at a radiation dose of 15–20 Gy), the 18F-FDG uptake of responding tumors had decreased significantly (P < 0.001). However, most of the tumors still showed marked focal 18F-FDG uptake at this time. The intensity of tumor 18F-FDG uptake in responders (standardized uptake value [SUV], 5.3 ± 2.1 [mean ± SD]) was not significantly different from that in nonresponders (SUV, 6.7 ± 2.1) (P = 0.11). In contrast, the relative decrease in 18F-FDG uptake from the baseline scan to the first follow-up scan was more than 2 times larger for histopathologic responders than for nonresponders (44% vs. 20%) (P = 0.0055). Only at the time of the third preoperative scan had the 18F-FDG uptake of responding tumors decreased almost to background levels (SUV, 2.7 ± 0.8).
Similar results were observed in patients with distal esophageal and gastric cancer treated by chemotherapy (37,38). At 2 wk after the initiation of chemotherapy, there was a marked decrease in the metabolic activity of responding tumors. However, most of the responding tumors still demonstrated significant 18F-FDG uptake. Only the change in metabolic activity from the baseline scan to the follow-up scan allowed the prediction of a subsequent histopathologic response. These studies indicated that a baseline scan before treatment and a quantitative assessment of changes in 18F-FDG uptake are generally necessary to predict tumor response early in the course of therapy.
Factors Influencing Quantitative Measurements of Tumor Glucose Use by 18F-FDG PET
Quantification of tumor metabolic activity by 18F-FDG PET is complicated by the fact that several factors (39) other than tumor glucose use have an impact on the 18F-FDG signal (Table 2). Partial-volume effects can cause a marked underestimation of the true activity concentration within a tumor. For a spheric lesion with a diameter equivalent to 1.5 times the spatial resolution of the PET scanner at full width half maximum, the measured maximum activity concentration is only about 60% the true activity concentration. The mean activity concentration is even lower, about 30% the true activity concentration. Only when the diameter of the lesion is about 4 times higher than the spatial resolution of the scanner is the difference between the measured peak activity concentration and the true activity concentration less than 5% (40). The measured mean activity concentration still is only approximately 60% the true activity concentration.
Factors Influencing Tumor 18F-FDG Uptake Measured by PET
In clinical studies, the spatial resolution of reconstructed images is in the range of 7–8 mm. Thus, there is a marked underestimation of tumor 18F-FDG uptake in tumors up to a size of 3–4 cm. Furthermore, the activity concentration may be underestimated considerably even in large tumors because of heterogeneous 18F-FDG uptake. Heterogeneous 18F-FDG uptake is frequently apparent in tumors with a rim of increased 18F-FDG uptake and a necrotic center with low or almost absent 18F-FDG accumulation. Because the metabolically active rim is often relatively thin (<1–2 cm), 18F-FDG uptake may be underestimated considerably in tumors with necrotic centers even if the diameter of the whole tumor is more than 4 cm. Although heterogeneous 18F-FDG uptake is identified readily in large tumors, it is also likely to be present in smaller lesions because of regional differences in cellular density, tumor oxygenation, and expression of glucose transporters (41). At this level the heterogeneous distribution of 18F-FDG cannot be resolved on PET images, but it still will affect the measured mean tumor 18F-FDG uptake.
In addition to these principal physical limitations of PET, the processing of PET images and the definition of regions of interest affect the results of quantitative measurements of tumor 18F-FDG uptake. Smoothing of images, for example, with a gaussian filter, will decrease the measured 18F-FDG uptake. Because of partial-volume effects, the measured mean tumor 18F-FDG uptake will decrease when the size of the region of interest used to define the tumor is increased. On the other hand, image noise will lead to larger random errors in measured tracer uptake when the size of the region of interest is decreased. Boellaard et al. (42) recently reported that these factors may cause an increase or a decrease in measured tracer uptake of at least 50%.
Furthermore, it must be considered that the 18F-FDG uptake of malignant tumors is time dependent. In most tumors, tracer uptake increases for at least 90 min after the injection of 18F-FDG (43,44). Thus, 18F-FDG uptake generally will be considerably higher at later than at earlier time points. This property recently was shown in detail for gastric carcinomas. Stahl et al. (44) measured tumor 18F-FDG uptake at 40 min as well as at 90 min after injection in 43 patients with histologically proven locally advanced gastric cancer. The SUVs (mean ± SD; normalized to patient body weight) of the tumors were 8.2 ± 2.0 at 40 min after injection and 12.0 ± 4.0 at 90 min after injection. Thus, there was a 50% increase in tumor 18F-FDG uptake between 40 and 90 min after injection.
Plasma glucose levels have a significant influence on tumor 18F-FDG uptake because 18F-FDG and glucose compete for glucose transport and phosphorylation by hexokinase (45). Therefore, 18F-FDG uptake in diabetic patients tends to be lower than that in nondiabetic patients because plasma glucose levels frequently are elevated in the former group of patients at the time of the PET scan. This situation represents a common problem in patients with chronic pancreatitis and suspected pancreatic cancer. In a study of 171 patients with suspected pancreatic cancer, mean tumor SUV was 4.2 in patients with glucose levels of less than 130 mg/dL at the time of the PET scan; that in patients with glucose levels of more than 130 mg/dL was only 2.3 (46).
Finally, it is important to note that 18F-FDG is not chemically identical to glucose. Thus, 18F-FDG and glucose differ in their rates of phosphorylation, transport, and volume of distribution in tissues. The correction factor, known as the lumped constant (LC), has been determined for normal brain tissue; current estimates range from 0.65 to 0.89 (47). Measurements of the LC are technically highly demanding and require that either an 11C-glucose PET study or measurements of perfusion and of the extraction fraction of glucose are performed in parallel with the 18F-FDG PET study (47). Furthermore, the LC is not a true constant but appears to vary with the type of tissue being studied. Therefore, tumor 18F-FDG uptake can be only an approximation of tumor glucose use.
When all of these factors are considered, it becomes clear that it is very challenging to quantify tumor glucose use by 18F-FDG PET in a clinical setting. However, this fact does not mean that it is equally difficult to measure relative changes in tumor glucose use over time. In this situation, only an intraindividual comparison of 2 studies is performed. This strategy significantly reduces the number of factors that may confound the 18F-FDG signal. Therefore, the accuracy of 18F-FDG PET for measuring changes in tumor glucose use is considerably better than the accuracy of 18F-FDG PET for quantifying tumor glucose use in absolute units. As described below, the 18F-FDG uptake of an untreated malignant tumor is stable over time, and relative changes in various parameters of tumor glucose use can be measured by 18F-FDG PET with high reproducibility.
What Kind of Quantification Is Required to Monitor Treatment Response?
The 18F-FDG concentration measured in a tissue by a PET scanner is the sum of 3 components: phosphorylated intracellular 18F-FDG, nonphosphorylated intracellular 18F-FDG, and nonphosphorylated intravascular 18F-FDG. Only the first component, the amount of phosphorylated 18F-FDG, is directly related to the metabolic activity of tumor cells. Static measurements of 18F-FDG uptake, which cannot differentiate among these 3 components, therefore are not necessarily correlated with glucose metabolic rates. As recently reviewed in detail by Krak et al. (48), there are numerous approaches to overcoming these limitations of static imaging and to quantifying tumor glucose metabolism. The 2 main approaches are nonlinear regression analysis with a 2-tissue compartment model and simplified tracer kinetic approaches, such as Patlak–Gjedde analysis. The major aspects of the clinical applications of these 2 approaches in comparison with static measurements of 18F-FDG uptake and calculation of SUVs are summarized below.
Nonlinear Regression Analysis
With a standard 2-tissue compartment model and nonlinear regression analysis, the net rate of 18F-FDG phosphorylation can be calculated from a dynamic PET study, which measures the time course of 18F-FDG uptake by the tumor tissue and the clearance of 18F-FDG from the plasma over a period of at least 1 h. Although this approach can provide the most accurate estimates of tumor glucose use, it also has 2 important limitations: First, the field of view of the study is limited to 1 bed position. Thus, only 1 tumor lesion can be assessed, and additional scans are required for tumor staging. Second, rapid dynamic data acquisition and arterial blood sampling are required. Because 18F-FDG very rapidly equilibrates between the plasma and erythrocytes (49), the clearance of 18F-FDG from the plasma may be approximated from a large vessel in the field of view of the PET study (imaged derived input function). In clinical practice, however, low count statistics, artifacts attributable to movement of the patient, and difficulties in obtaining a sufficient number of blood samples frequently limit the accuracy of nonlinear regression analysis. Finally, it is important to note that most of the above-described factors influencing measurements of tumor 18F-FDG uptake (partial-volume effects, tissue heterogeneity, and reconstruction parameters) also affect the results of nonlinear regression analysis.
Patlak–Gjedde Analysis
For a tracer such as 18F-FDG, which is irreversibly “trapped” in the tumor tissue, the regional activity concentration at time t after injection generally can be described by the following formula (50):
 Eq. 1 In this formula, c(t) is the activity concentration in the tissue as measured by the PET scanner at time t, cp(t) is the concentration of 18F-FDG in the plasma, λ is the partition coefficient of 18F-FDG, Ki is the net rate of 18F-FDG flux into the tissue, and T is the duration of the PET scan. The first term in this equation, λ · cp(t), represents the amount of nonphosphorylated 18F-FDG in the tumor tissue. It is assumed that there is a relatively rapid equilibration between 18F-FDG in the plasma and nonphosphorylated 18F-FDG in the tissue. In this situation, the concentration of nonphosphorylated 18F-FDG in the tissue can be expressed as a fixed fraction, λ, of the concentration in the plasma. In clinical studies, sufficient equilibration usually occurs within 10–15 min after the injection of 18F-FDG. The second term, Ki
 cp(t)dt, describes the amount of irreversibly trapped (phosphorylated) 18F-FDG. This amount is equal to the area under the plasma time–activity curve multiplied by the net influx constant, Ki. The area under the plasma time–activity curve,
  cp(t)dt, can be interpreted as a measure of the total amount of tracer that has been available to be taken up by the tumor tissue. Ki describes the net rate of 18F-FDG trapping by the tumor tissue, that is, its metabolic activity. After an equilibration time of 10–15 min, a plot of
  versus
  (Patlak–Gjedde plot) results in a straight line with a slope of Ki. Thus, simple linear regression analysis can be used to determine Ki. Compared with nonlinear regression analysis, Patlak–Gjedde analysis is considerably less sensitive to image noise and has been used frequently in clinical studies to assess tumor glucose use. As in nonlinear regression analysis, however, the field of view is limited to 1 bed position.
Static Measurements of 18F-FDG Uptake
By far the parameter that is used most commonly for assessing tumor glucose use in clinical studies is the SUV. The basic concept underlying the use of the SUV is that the activity concentration at a sufficiently late time after injection is correlated linearly with net 18F-FDG phosphorylation rates if the activity concentration is appropriately standardized (51). At this time, the activity concentration in the plasma will be low compared with the activity concentration in the tissue. Thus, the first term in Equation 1 can be neglected. Therefore, Ki, the net rate of 18F-FDG phosphorylation as a measure of tumor glucose use, can be calculated by dividing the activity concentration in the tissue by the area under the plasma time–activity curve, as follows:
 Eq. 2
Eq. 2
The calculation can be simplified further by assuming that the area under the plasma time–activity curve is proportional to the injected dose divided by the body weight of the patient. The rationale for this assumption is that the area under the plasma time–activity curve obviously is correlated linearly with the injected 18F-FDG dose. The higher the dose of 18F-FDG injected, the larger the area under the plasma time–activity curve. In patients with higher body weights, plasma and extracellular volumes will be larger and therefore 18F-FDG will be diluted in a larger volume. Accordingly, the concentration in the plasma will be lower and the area under the plasma time–activity curve will be smaller. Therefore, the ratio of the injected dose to the body weight can be used as an approximation of the area under the plasma time–activity curve.
When this approximation is applied, Ki becomes proportional to the activity concentration in the tissue divided by the ratio of the injected dose (D) to the body weight, which is the SUV:
 Eq. 3
Eq. 3
The assumption that the area under the plasma time–activity curve is proportional to the injected dose divided by the body weight implies that the volume of distribution of 18F-FDG is dependent solely on a patient’s body weight and that the rates of clearance of 18F-FDG from the plasma are identical in all patients. These are obviously very crude assumptions, and they have been shown to be incorrect in several situations. For example, the volume of distribution of 18F-FDG depends not only on a patient’s body weight but also on the body composition. SUVs of malignant tumors tend to be markedly higher in obese patients because the 18F-FDG concentration in adipose tissue is significantly lower than that in the remaining body. Accordingly, the volume of distribution of 18F-FDG per kilogram of body weight is smaller in obese patients than in nonobese patients, so that dividing the injected dose by the body weight leads to an underestimation of the area under the plasma time–activity curve and thus to incorrectly high SUVs (52). SUVs normalized to body surface or lean body mass have been shown to provide more reliable estimates of 18F-FDG metabolic rates in obese patients (52,53). However, these normalizations still are only approximations of the area under the plasma time–activity curve. Furthermore, none of the normalization procedures takes into account differences in plasma 18F-FDG clearance, which also will affect the area under the plasma time–activity curve. For example, the area under the plasma time–activity curve will be larger in patients with impaired renal function.
Because of all of these limitations, the use of SUVs for the quantitative assessment of tumor glucose use has been severely criticized, and it has even been suggested that SUV stands for “silly useless value” (54). However, it is again very important to note that there is a fundamental difference between measuring absolute metabolic rates and measuring changes in metabolic rates for treatment monitoring. In the first situation, tumor glucose metabolism generally is quantified to compare different groups of patients. In this situation, the dependence of SUVs on body composition and plasma 18F-FDG clearance is a clear limitation for this technique compared with nonlinear regression or Patlak–Gjedde analysis. In the second situation, however, only an intraindividual comparison of metabolic rates before and after treatment is made. As long as the treatment does not significantly change the area under the plasma time–activity curve, the relative changes in SUV and Ki generally can be expected to be identical (Eqs. 1–3).
The correlation between changes in Ki, as determined by Patlak–Gjedde analysis, and changes in SUV in 32 patients with advanced non–small-cell lung cancer treated with platinum-based chemotherapy was studied recently. 18F-FDG PET was performed before and after the first cycle of therapy (3 wk after the first chemotherapy dose had been administered). There was a close correlation between changes in SUV and changes in Ki, with a Spearman correlation coefficient of 0.88. Furthermore, changes in SUV and changes in Ki provided almost identical diagnostic accuracies for the prediction of a subsequent reduction in tumor size (areas under the receiver operating characteristic curves, 0.92 and 0.91, respectively). Changes in both parameters also were correlated significantly with overall survival after chemotherapy (55).
Although there are good theoretic arguments and clinical data indicating that changes in SUV generally are well correlated with changes in Ki, there may be differences in tumors with relatively low metabolic activity. In this situation, the contribution of nonphosphorylated 18F-FDG, λ · cp(t), to the total 18F-FDG signal cannot be neglected, and therapy-induced changes in Ki may be different from changes in SUV. Furthermore, tracer kinetic methods may provide more reliable estimates of tumor glucose use in diabetic patients, in whom the area under the plasma time–activity curve may be altered because of varying blood glucose or insulin levels. Nevertheless, as detailed below, there is now considerable evidence that the measurement of changes in SUV provides a robust way to assess changes in tumor metabolic activity during therapy (56).
Because SUV measurements can be integrated relatively easily into routine PET acquisition protocols, at present SUV represents the parameter that is most clinically useful for monitoring tumor response. However, to measure reliable SUVs, it is necessary to follow a strict protocol. The practical aspects of acquiring 18F-FDG PET scans for treatment monitoring and using SUVs as parameters for assessing therapy-induced changes are discussed below.
ACQUISITION AND DATA ANALYSIS OF 18F-FDG PET STUDIES: PRACTICAL ASPECTS
Common Sources of Error in Calculation of SUVs
Although calculation of SUVs is straightforward (Eq. 3), several errors may occur in clinical practice. The most frequent sources of errors are listed in Table 3. Paravenous injection of 18F-FDG will decrease the amount of tracer that is available for uptake by the tumor (area under the plasma time–activity curve) and will incorrectly decrease measured SUVs. If the injected activity is not decay corrected for the time between injection and imaging (uptake period), SUVs will be markedly underestimated. After a typical uptake period of 1 h, approximately 30% of the injected activity has decayed. Thus, tumor SUVs will be underestimated by a factor of approximately 1.5 if the injected activity is not decay corrected. It is also necessary to correctly calibrate the PET scanner, which means that the counting rates need to be correctly converted to activity concentrations. Calibration frequently is performed by measuring a cylinder phantom filled with a known dose of 18F in the PET scanner. Correct calibration requires decay correction of the amount of activity present at the time of imaging as well as accurate dilution of the activity in the phantom. Errors in the calibration process are not uncommon and may lead to incorrectly low or high SUVs.
Common Sources of Errors in Measurement of SUVs
The interval between 18F-FDG injection and imaging (uptake period) is also critical. Generally, the uptake period should be at least 40 min. Longer uptake periods may allow better visualization of tumors with low metabolic activity (44) and may provide a more accurate assessment of tumor glucose use as long as the count statistics are high enough for reliable quantification of regional activity concentrations. However, it is essential that SUVs always be measured at a fixed time after tracer injection. As described above, the activity concentration in malignant tumors increases for at least 90 min after the injection of 18F-FDG. Thus, it is difficult to compare SUVs that are measured at different times after injection. If, for example, the baseline scan for treatment monitoring is performed at 60 min after injection but the follow-up scan is acquired at 40 min after injection, then the finding of a decrease in tumor 18F-FDG uptake may be a treatment effect but also simply may be attributable to the fact that imaging was started earlier. Therefore, every effort should be made to keep the range of variations in the uptake period below 5–10 min. In clinical practice, this goal requires very careful planning of the times of 18F-FDG injection and the start of scanning.
To check for errors in the calculation of SUVs, changes in 18F-FDG uptake also should be evaluated visually. For this evaluation, it is helpful to review the baseline study and the follow-up study side by side and to normalize the displays of both studies to the same maximum (Fig. 1). 18F-FDG uptake by normal tissues should show approximately the same intensities in both studies. If there are marked differences, an error in the calculation of the SUVs in 1 of the studies is very likely (Fig. 1). For comparison of the baseline study and the follow-up study, the intensity of liver 18F-FDG uptake can provide a helpful orientation because the SUVs of normal liver show only very small variations over time (57). For visual comparison of changes in tumor 18F-FDG uptake, it is also advisable to set the maximum intensity of the display no lower than the maximum tumor SUV. Otherwise, quite significant changes in tumor 18F-FDG uptake may be missed (Fig. 2).
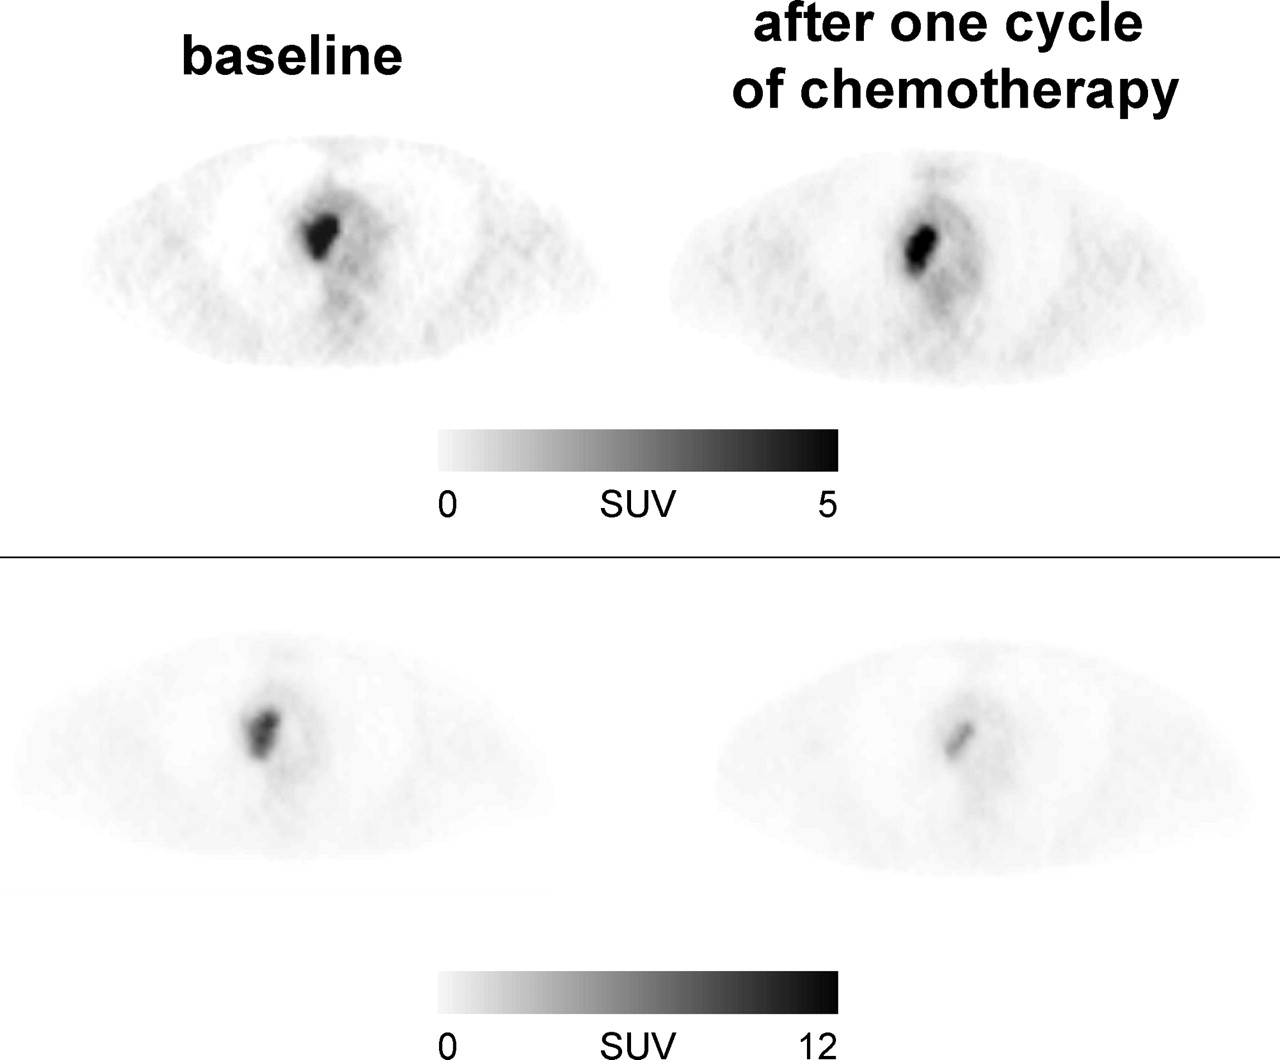
Marked changes in tumor 18F-FDG uptake may be missed by visual interpretation of 18F-FDG PET studies if images are not correctly scaled for display. In this example, patient with non–small cell lung cancer was studied before chemotherapy and after first cycle of chemotherapy. Images in top row are scaled to SUV of 5. Visually there seems to be no change in intensity of 18F-FDG uptake in tumor tissue from baseline scan to follow-up scan. However, maximum SUV of tumor in baseline scan was 11.5. In follow-up scan, SUV had decreased by more than 50% to 5.4; this value is still higher than maximum SUV used for scaling of display in top row. Accordingly, intensity of tumor 18F-FDG uptake appears to be unchanged. When baseline and follow-up images are scaled to maximum SUV of 12 (bottom row), marked decrease in tumor 18F-FDG uptake becomes obvious.
Which Degree of Change in Tumor Metabolic Activity Is Significant?
Unfortunately, at present there are no generally accepted criteria for a metabolic response in 18F-FDG PET studies. The European Association for Research and Treatment of Cancer published preliminary criteria for the assessment of tumor response in 1999 (58). However, at that time, only a limited number of data on the use of 18F-FDG PET for treatment monitoring were available. Since then, a large number of studies on treatment monitoring with 18F-FDG PET have been published, and there is now a great need to standardize the criteria used for monitoring anticancer therapy with 18F-FDG PET.
On the basis of the reproducibility of the 18F-FDG signal in untreated tumors, relative changes of approximately 20% are very unlikely to be attributable to measurement errors or spontaneous fluctuations in tumor metabolic activity (59–61). This conclusion applies to measurements of SUVs as well as to measurements of Ki by Patlak–Gjedde analysis. However, it is important to note that this criterion is valid only for tumors with sufficient baseline metabolic activity. This fact becomes obvious when the differences between 2 measurements of SUVs in untreated tumors are analyzed. In a study evaluating 50 lesions in 16 patients, the 95% normal range for these differences in SUVs was ±0.9. According to these data, a change in SUV can be considered significant only when the difference between the baseline scan and the follow-up scan is more than 0.9. The corresponding normal range for Ki was ±0.7 mL/100 g/min (60).
These data establish the minimal effect of treatment on tumor metabolic activity that can be assessed by 18F-FDG PET. However, a measurable change in metabolic activity does not necessarily imply that treatment has a beneficial effect for the patient. For example, small changes in tumor glucose use may represent nonspecific metabolic stunning of the tumor tissue that is not associated with an improved outcome. Therefore, the prognostic implications of a measurable change in tumor glucose use in patients who had advanced non–small cell lung cancer and who were treated with palliative platinum-based chemotherapy were evaluated recently. A metabolic response in PET was prospectively defined as a decrease in the SUV of the primary tumor of at least 20%. A total of 57 patients were included in the study, and in 28 patients, the tumors showed a metabolic response after the first cycle of chemotherapy. Overall survival and progression-free survival were correlated highly significantly with a metabolic response in PET. The median progression-free survival of metabolic nonresponders was only 1.8 mo; that of metabolic responders was 5.9 mo. The median overall survival of metabolic responders was 8.4 mo; that of metabolic nonresponders was only 5.0 mo (55). These data indicate that a measurable change in tumor 18F-FDG uptake after the first cycle of chemotherapy is associated with a palliative effect of therapy. In patients without a measurable change in tumor 18F-FDG uptake at this time, a change in the treatment regimen should be considered (e.g., second-line chemotherapy or new targeted forms of treatment, such as protein kinase inhibitors). Thus, 18F-FDG PET may be used to individualize the treatment regimen early in the course of therapy.
Other threshold values for the definition of a metabolic response are necessary when chemotherapy is used with a curative intent. For example, in patients with high-grade malignant lymphomas, a mean decrease in 18F-FDG uptake of more than 45% has been observed within 24 h after the administration of the first dose of chemotherapy (62). In patients with solid tumors treated by preoperative chemotherapy, a change in 18F-FDG uptake of 35%–50% (36,37,55,63–65) within the initial weeks of chemotherapy has been found to provide the highest accuracy for the prediction of histopathologically complete or subtotal tumor regression (Table 4). These differences in changes in tumor 18F-FDG uptake in different clinical situations are not unexpected because the degrees of tumor response to treatment also clearly are different. Although chemotherapy induces only a minor reduction in tumor size in the palliative treatment of non–small cell lung carcinoma, it reduces the viable tumor cell mass by more than 90% in patients with a histopathologic response to preoperative therapy and cures many patients with high-grade malignant lymphomas (i.e., eliminates 100% of the tumor cells). Thus, the interpretation of a metabolic response in 18F-FDG PET necessarily depends on the clinical context. Most importantly, however, several studies have now shown for different tumor types and different forms of therapy that quantitative changes in tumor 18F-FDG uptake during treatment are correlated with long-term patient outcome (Table 4). Thus, it appears to be feasible to adjust treatment on the basis of the findings of 18F-FDG PET.
Prognostic Relevance of Quantitative Changes in Tumor 18F-FDG Uptake During Chemotherapy or Chemoradiotherapy
When Should 18F-FDG PET Scans Be Performed to Assess or Predict Treatment Response?
When 18F-FDG PET is performed after the completion of potentially curative chemotherapy or radiotherapy, one has to consider that only small amounts of residual viable tumor may be present. In this situation, differentiation between responders and nonresponders by 18F-FDG PET can be challenging. In order to achieve the highest sensitivity for the detection of residual tumor tissue, 18F-FDG PET therefore should be performed as late as possible after the completion of therapy to enhance the detection of residual tumor tissue. In my experience, a waiting period of 4–6 wk after the completion of therapy is a reasonable compromise. Imaging at later time points probably would improve the accuracy of 18F-FDG PET for the detection of residual tumor tissue but is frequently of limited clinical relevance because decisions regarding additional treatment need to be made relatively early after completion of first-line therapy.
The results of in vitro studies have suggested that chemotherapy and radiotherapy may cause a metabolic flare phenomenon (66,67). This phenomenon has been attributed to the activation of energy-dependent cellular repair mechanisms. On the basis of these data, it has been recommended that the assessment of tumor response should not be performed until several weeks after the completion of therapy. In these in vitro studies, however, 18F-FDG uptake was measured in surviving cells after chemotherapy or radiotherapy. This situation differs from the clinical situation, in which a change in the PET signal is determined by a combination of decreased 18F-FDG uptake attributable to cancer cell death and potentially increased 18F-FDG uptake in surviving tumor cells. In clinical studies, a mild to moderate increase in tumor 18F-FDG uptake was observed only in the initial hours after high-dose radiotherapy of brain tumors (68,69). A metabolic flare phenomenon also was observed in metastatic breast cancer treated with tamoxifen and was associated with a good response to therapy. This initial increase in tumor metabolic activity likely was attributable to the partial estrogenlike stimulatory activity of this antiestrogen, which may be particularly apparent during the initial days of treatment, when its levels are still low (70).
Conversely, numerous studies have shown that effective chemotherapy causes a marked decrease in tumor 18F-FDG uptake within 1–3 wk after the initiation of therapy (37,55,62,63,71,72). In fact, clinical studies have shown that early changes in metabolic activity are more likely to overestimate response than to underestimate it. Even patients who are classified histopathologically as nonresponders frequently show a mild to moderate decrease in tumor metabolic activity early in the course of therapy. In esophageal cancer treated with preoperative chemotherapy, a mean decrease in tumor 18F-FDG uptake of 15% 14 days after the initiation of chemotherapy in patients who subsequently were classified histopathologically as nonresponders was observed (38). In some histopathologically nonresponding tumors, 18F-FDG uptake even decreased by more than 50% (38). Similar observations have been made for breast, lung, and gastric cancer (37,55,71,72). It is presently not clear why some early PET studies have false-positive results for tumor response. One potential mechanism is the growth of a resistant tumor cell clone. In addition, stunning of cellular glucose metabolism that does not significantly affect tumor cell survival also has been suggested.
Several studies have indicated that measurements of changes in tumor SUVs during chemotherapy allow the prediction of a subsequent reduction in the tumor mass as well as of patient survival (Table 4). In all of these studies, 18F-FDG PET had a high negative predictive value for response, and patients who did not show a significant decrease in 18F-FDG uptake early in the course of treatment were unlikely to benefit from continued therapy. Early identification of nonresponding patients is of great clinical importance because the rates of response of common malignant tumors to chemotherapy are in the range of only 20%–30% (73). Thus, the majority of patients will be treated without a significant benefit. Rates of response to targeted therapy, for example, epidermal growth factor receptor kinase inhibitors, are even lower, in the range of 10%–20% (74,75). Early identification of nonresponding patients by PET therefore has the potential to significantly reduce side effects and costs of ineffective therapy. For example, patients treated with preoperative chemotherapy may undergo immediate surgical tumor resection if 18F-FDG PET indicates that treatment is unlikely to significantly reduce the tumor mass. Because increasing numbers of second- and third-line chemotherapy regimens and targeted anticancer treatments are emerging, it also will become more and more feasible to perform early treatment adjustments in patients who are identified as nonresponders by 18F-FDG PET.
Monitoring Radiotherapy or Chemoradiotherapy with 18F-FDG PET
Radiotherapy often causes a severe inflammatory reaction, which has raised concerns about the use of 18F-FDG PET for the assessment of tumor response to radiotherapy or chemoradiotherapy. It has been recommended frequently that 18F-FDG PET should not be performed until several months after the completion of radiotherapy. However, there is a surprising lack of data to support this recommendation. Although there is no doubt that radiation-induced inflammation accumulates 18F-FDG, the intensity of 18F-FDG uptake is often considerably lower than that in untreated primary tumors. Furthermore, the configuration of increased 18F-FDG uptake in radiation-induced inflammation is often markedly different from that in malignant tumors. Therefore, it is often possible to differentiate between radiation-induced inflammation and residual tumor tissue (76), especially when pretreatment and posttreatment PET scans are being compared (Fig. 3). The specificity of 18F-FDG PET for residual tumor tissue is supported by several studies that have shown markedly improved survival in patients who were classified as responders by 18F-FDG PET (Tables 1 and 4).

By comparing baseline and follow-up scans, radiation-induced inflammation frequently can be differentiated from viable tumor tissue. This patient with esophageal cancer was studied by 18F-FDG PET before and 3 wk after completion of chemoradiotherapy. In scan obtained after chemoradiotherapy, there is linear uptake along esophagus. Comparison with baseline scan demonstrates that intensity of tumor 18F-FDG uptake has decreased markedly. Esophageal tracer uptake in area of tumor is not higher than in other parts of esophagus, indicating that findings in follow-up scan are related to esophagitis and not to residual tumor tissue.
Wieder et al. (36) studied the time course of changes in tumor 18F-FDG uptake in 38 patients with locally advanced squamous cell carcinomas of the esophagus treated by preoperative chemoradiotherapy. Patients were imaged before chemoradiotherapy, 2 wk after the initiation of therapy, at the completion of therapy, and another 4 wk later, before surgery. None of the serial PET scans demonstrated an increase in tumor 18F-FDG uptake, indicating that radiation-induced inflammatory reactions are quantitatively less relevant than the decrease in 18F-FDG uptake in viable tumor cells. Of note, the decrease in 18F-FDG uptake after 2 wk of therapy was correlated significantly with subsequent histopathologic tumor regression and patient survival. In contrast, Arslan et al. (77) found that in patients with esophageal cancer, radiation-induced inflammation could not be differentiated from viable tumor tissue. However, it is important to note that this study included less advanced tumors, which accordingly demonstrated relatively low 18F-FDG uptake in the baseline scan. Therefore, even in responding tumors, relative changes in tumor 18F-FDG uptake necessarily will be smaller than those in tumors with higher 18F-FDG uptake in the baseline scan. This fact indicates that the quantitative evaluation of 18F-FDG PET studies requires a sufficiently high baseline signal to measure changes over time.
MONITORING TREATMENT WITH PROTEIN KINASE INHIBITORS
Protein kinases are enzymes that catalyze the transfer of a phosphate group to amino acid residues of proteins. This phosphorylation activates or inhibits the functional activity of the target protein. Protein kinases play an essential role in cellular signaling in response to growth factors and other stimuli. Activating mutations of protein kinases regulating cellular proliferation and apoptosis have been observed in a large number of tumor types and are considered to be key factors for the uncontrolled growth of cancer cells. Inhibition of protein kinases therefore has been extensively studied as an approach for targeted anticancer therapy. Landmark clinical trials of the protein kinase inhibitor imatinib in patients with chronic myeloid leukemia and gastrointestinal stromal tumors have proven the feasibility of this approach for the treatment of cancer. As a result of this success, a large number of kinase inhibitors targeting a wide variety of kinase pathways have been designed and are presently in various stages of clinical development (78).
18F-FDG PET is particularly attractive for monitoring treatment with protein kinase inhibitors because many signaling pathways targeted by protein kinase inhibitors also have a well-established role in regulating tumor glucose metabolism. For example, the signaling pathway involving the proteins phosphatidylinositol 3-kinase and Akt has a role in the central regulation of cellular glucose use (79). However, it also is involved critically in the regulation of cellular proliferation and apoptosis (80,81). Recent experimental data suggested that the activation of Akt may be a key factor in the markedly increased glucose use of cancer cells (82,83). Measurement of tumor 18F-FDG uptake by PET therefore may represent a noninvasive approach for assessing successful target inhibition of protein kinase inhibitors. New techniques for monitoring treatment with protein kinase inhibitors are needed urgently because rates of response to protein kinase inhibitors in the treatment of common solid tumors are low (10%–20%). These low response rates are not unexpected because it is well established that most solid tumors in humans are genetically highly heterogeneous. Inhibition of one particular signaling pathway therefore is unlikely to be efficient in all treated patients. For the further development and clinical application of protein inhibitors, it is therefore imperative to develop tests that will allow prediction of the tumor response to the inhibition of a particular kinase and monitoring of the effectiveness of treatment early in the course of therapy.
18F-FDG PET already has been used in clinical studies to monitor the response of gastrointestinal stromal tumors to treatment with imatinib (84–86). Gastrointestinal stromal tumors are characterized by a mutationally activated KIT receptor tyrosine kinase that is inhibited by imatinib (87). A marked reduction in tumor metabolic activity was noted as early as 24 h after the first imatinib dose (84,88). Moreover, extensive anatomic abnormalities observed by CT persisted at a time when metabolic alterations already had resolved.
In a study of 21 patients with gastrointestinal stromal tumors or other soft-tissue sarcomas (88), the decrease in 18F-FDG uptake after only 1 wk of treatment with imatinib was correlated closely with patient outcome. Progression-free survival at 1 y was 92% in patients who were classified as responders by PET (n = 13; a decrease in 18F-FDG uptake of more than 25%). In contrast, progression-free survival at 1 y was only 12% for patients who were classified as nonresponders by PET (n = 8) (P < 0.005). These data suggest that 18F-FDG PET may become a valuable tool for monitoring treatment with imatinib and potentially other protein kinase inhibitors.
CONCLUSION
There is now considerable evidence in the literature that 18F-FDG PET can be used to assess tumor response to chemo- and chemoradiotherapy. This has been extensively shown for malignant lymphomas, but also for a variety of solid tumors. Visual interpretation of PET scans is frequently sufficient for assessment of tumor response after completion of therapy. However, quantitative analysis of tumor 18F-FDG uptake is generally required, if PET imaging is used to predict tumor response early in the course of therapy. In many cases calculation of SUVs appears to be sufficient to measure relative changes in tumor glucose use during therapy. In contrast to more sophisticated parameters, SUVs can be derived from 18F-FDG PET scans acquired for tumor staging. Nevertheless, it is essential to follow a strict protocol for data acquisition, image reconstruction, and data analysis in order to reliably measure changes in tumor 18F-FDG uptake with SUVs.
Footnotes
Received Dec. 6, 2004; revision accepted Mar. 19, 2005.
For correspondence or reprints contact: Wolfgang A. Weber, MD, Department of Molecular and Medical Pharmacology, Ahmanson Biological Imaging Center, UCLA David Geffen School of Medicine, 10833 Le Conte Ave., Los Angeles, CA 90095-6942.
E-mail: wweber{at}mednet.ucla.edu
Guest Editor: H. William Strauss, MD.
↵* NOTE: FOR CE CREDIT, YOU CAN ACCESS THIS ACTIVITY THROUGH THE SNM WEB SITE (http://www.snm.org/ce_online) UNTIL JUNE 2006.
REFERENCES
In this issue


Jump to section
- Article
- Abstract
- LIMITATIONS OF CONVENTIONAL TECHNIQUES FOR MONITORING ANTICANCER THERAPY
- MONITORING OF TUMOR RESPONSE BY 18F-FDG PET: METHODOLOGICAL CONSIDERATIONS
- ACQUISITION AND DATA ANALYSIS OF 18F-FDG PET STUDIES: PRACTICAL ASPECTS
- MONITORING TREATMENT WITH PROTEIN KINASE INHIBITORS
- CONCLUSION
- Footnotes
- REFERENCES
- Figures & Data
- Info & Metrics
Related Articles
Cited By...
- Quality Improvement Initiatives to Assess and Improve PET/CT Injection Infiltration Rates at Multiple Centers
- Test-Retest Reproducibility of 18F-FDG PET/CT Uptake in Cancer Patients Within a Qualified and Calibrated Local Network
- Use of a Qualification Phantom for PET Brain Imaging in a Multicenter Consortium: A Collaboration Between the Pediatric Brain Tumor Consortium and the SNMMI Clinical Trials Network
- Protocols for Harmonized Quantification and Noise Reduction in Low-Dose Oncologic 18F-FDG PET/CT Imaging
- Quantitative Accuracy and Lesion Detectability of Low-Dose 18F-FDG PET for Lung Cancer Screening
- Comparison of Tumor Uptake Heterogeneity Characterization Between Static and Parametric 18F-FDG PET Images in Non-Small Cell Lung Cancer
- Optimum Lean Body Formulation for Correction of Standardized Uptake Value in PET Imaging
- 89Zr-trastuzumab and 89Zr-bevacizumab PET to Evaluate the Effect of the HSP90 Inhibitor NVP-AUY922 in Metastatic Breast Cancer Patients
- Mutatis Mutandis: Harmonize the Standard!
- Imaging in Sarcoma
- Need for Standardization of 18F-FDG PET/CT for Treatment Response Assessments
- Positron emission tomography imaging approaches for external beam radiation therapies: current status and future developments
- Detection and Characterization of Tumor Changes in 18F-FDG PET Patient Monitoring Using Parametric Imaging
- Prognostic Implication of Dual-Phase PET in Adenocarcinoma of the Lung
- Imaging of CTLA4 Blockade-Induced Cell Replication with 18F-FLT PET in Patients with Advanced Melanoma Treated with Tremelimumab
- Economic Evaluation of PET and PET/CT in Oncology: Evidence and Methodologic Approaches
- Economic Evaluation of PET and PET/CT in Oncology: Evidence and Methodologic Approaches
- Repeatability of 18F-FDG PET in a Multicenter Phase I Study of Patients with Advanced Gastrointestinal Malignancies
- Chemotherapy Response Evaluation in Metastatic Colorectal Cancer with FDG PET/CT and CT Scans
- Standards for PET Image Acquisition and Quantitative Data Analysis
- Assessing Tumor Response to Therapy
- From RECIST to PERCIST: Evolving Considerations for PET Response Criteria in Solid Tumors
- Considerations for the Use of Imaging Tools for Phase II Treatment Trials in Oncology
- Reproducibility of Standardized Uptake Value Measurements Determined by 18F-FDG PET in Malignant Tumors
- PET/MRI Dual-Modality Tumor Imaging Using Arginine-Glycine-Aspartic (RGD)-Conjugated Radiolabeled Iron Oxide Nanoparticles
- Analysis and Reproducibility of 3'-Deoxy-3'-[18F]Fluorothymidine Positron Emission Tomography Imaging in Patients with Non-Small Cell Lung Cancer
- Dual-Modality Imaging: Combining Anatomy and Function
- Reduction of Glucose Metabolic Activity Is More Accurate than Change in Size at Predicting Histopathologic Response to Neoadjuvant Therapy in High-Grade Soft-Tissue Sarcomas
- Application of PET/CT in the Development of Novel Anticancer Drugs
- Quantitative PET Comparing Gated with Nongated Acquisitions Using a NEMA Phantom with Respiratory-Simulated Motion
- 18F-FDG PET/CT in Evaluating Non-CNS Pediatric Malignancies
- The Dilemma of Target Delineation with PET/CT in Radiotherapy Planning for Malignant Tumors
- 18F-FDG PET in Non-Hodgkin's Lymphoma: Qualitative or Quantitative?
- Long-Term Results of RTOG Trial 8911 (USA Intergroup 113): A Random Assignment Trial Comparison of Chemotherapy Followed by Surgery Compared With Surgery Alone for Esophageal Cancer
- Partial-Volume Effect in PET Tumor Imaging
- Partial-Volume Correction in PET: Validation of an Iterative Postreconstruction Method with Phantom and Patient Data
- Early Response Evaluation in Malignant Pleural Mesothelioma by Positron Emission Tomography With [18F]Fluorodeoxyglucose
- Monitoring Tumor Glucose Utilization by Positron Emission Tomography for the Prediction of Treatment Response to Epidermal Growth Factor Receptor Kinase Inhibitors.
- The Role of PET in Lymphoma
- Molecular Imaging with 123I-FIAU, 18F-FUdR, 18F-FET, and 18F-FDG for Monitoring Herpes Simplex Virus Type 1 Thymidine Kinase and Ganciclovir Prodrug Activation Gene Therapy of Cancer
- Procedure Guideline for Tumor Imaging with 18F-FDG PET/CT 1.0
- PET Evaluation of Lung Cancer
- Findings on 18F-FDG PET Scans After Neoadjuvant Chemoradiation Provides Prognostic Stratification in Patients with Locally Advanced Rectal Carcinoma Subsequently Treated by Radical Surgery