


Abstract
Standardized uptake value (SUV) normalized by lean body mass ([LBM] SUL) is becoming a popular metric for quantitative assessment of clinical PET. Sex-specific quantitative effects of different LBM formulations on liver SUV have not been well studied. Methods: 18F-FDG PET/CT scans from 1,033 consecutive adult (501 women, 532 men) studies were reviewed. Liver SUV was measured with a 3-cm-diameter spheric region of interest in the right hepatic lobe and corrected for LBM using the sex-specific James and Janmahasatian formulations. Results: Body weight was 71.0 ± 20.7 kg (range, 18.0–175.0 kg) and 82.9 ± 18.6 kg (range, 23.0–159.0 kg) for women and men, respectively. SUV, based on body weight, has a significantly positive correlation with weight for both women (r = 0.58, P < 0.0001) and men (r = 0.54, P < 0.0001). This correlation is reduced in men (r = 0.11, P = 0.01) and becomes negative for women (r = −0.35, P = 0.0001) with the James formulation of SUL. This negative correlation was eliminated when the very obese women (body mass index ≥ 35) were excluded from the analysis (r = 0.13, P = 0.8). The Janmahasatian formulation annuls the correlation between SUL and weight for women (r = 0.04, P = 0.4) and decreases it for men (r = 0.13, P = 0.003). Conclusion: Hepatic correction with the more common James formulation for body lean mass breaks down and shows low SUL values in very obese patients. The adoption of the Janmahasatian formula for estimation of LBM in modern PET scanners and display workstations is recommended, in view of the increasing frequency of obesity.
PET/CT imaging of cancer with combined PET and CT scanners has become a standard component of diagnosis and staging in oncology (1,2). The glucose analog 18F-FDG has been shown to concentrate in tumors because of enhanced glycolysis by malignant cells (3,4). Standardized uptake value (SUV) is defined from Eq. 1Because fat contributes to body weight (BW) but accumulates little 18F-FDG in the fasting state, SUV in obese patients is increased relatively in thinner patients (5). Using the lean body mass (LBM) correction of SUV (SUL) for obese patients was found to be a more appropriate quantitative method than BW or body surface area (6).
Normal-liver SUV has been previously proposed as a reference tissue in guidelines that included PET as part of the response criteria (7,8) because of its stability over time and in test–retest studies (9). PET Response Criteria in Solid Tumors 1.0 propose that normal-tissue 18F-FDG activity be determined in the right hepatic lobe of the liver and consists of the mean SUL in a 3-cm-diameter spheric region of interest (8).
Modern scanners use the James equation (Eq. 2), which relies on sex, height (cm), and total BW (kg), to estimate LBM (10): Eq. 2The James formula for LBM depends on the square of the weight with a negative coefficient. The graphical representation of such a functional dependence is an inverted parabola.
Analysis of the James equations (Eq. 1) to find the peak value when the first derivative with respect to weight equals zero shows that the maximum of LBM, after which it starts declining, is reached for a body mass index (BMI) of approximately 43 for men and 37 for women.
Recent studies have also shown that the James equation may no longer be accurate once a critical weight is reached (11). This finding led Janmahasatian et al. (12) to develop another formulation for estimating LBM: Eq. 3This is an increasing function of weight and plateaus at large values of weight.
Quantitative effects of different LBM formulations on liver SUV for obese patients have not been well studied. From the mathematic formulations of the James and Janmahasatian equations, we should be able to predict their behavior for very obese subjects. The actual data were used to confirm and not establish these mathematic relationships. This was the aim of the present study.
MATERIALS AND METHODS
Patient Population
More than 1,000 consecutive PET/CT scans over a 5-mo period for patients older than 18 y who underwent recent clinical 18F-FDG PET/CT studies for suspected or known malignancies were considered. Repeated scans for the same patients were discarded. A total of 1,033 studies were retained and included in this study. The study was approved by the ethics committee, and the need to obtain informed consent was waived.
PET Scanning
All patients fasted for at least 4 h before scanning. Patients were scanned either on a Discovery RX with a lutetium yttrium orthosilicate crystal or on a Discovery LS PET/CT scanner with a bismuth germinate crystal (both GE Healthcare) at a target of 60 min after injection of 18F-FDG. Studies on the first system were performed in 3-dimensional acquisition mode with 4.15 min per bed position. The images were reconstructed using ordered-subset expectation maximization algorithms, with matrix, 128 × 128; 21 subsets; 2 iterations; postreconstruction gaussian filter, 3-mm; standard Z filter; pixels, 4.7 mm; and slice thickness, 3.27 mm. The 2-dimensional implementation on the Discovery LS used 2 iterations, 28 subsets, a 5.5-mm postreconstruction gaussian filter, and 3.9-mm pixels. All PET data were reconstructed with and without CT-based attenuation correction.
Determination of SUV, SULJames, and SULJanma
Images were reviewed with Advantage Workstation 4.4 (GE Healthcare) software. Liver mean SUV and SULJames were determined in the nondiseased right hepatic lobe, with a 3-cm-spheric region of interest as a default. SUL values according to the Janmahasatian formulation were derived from Eq. 4
Eq. 4
Data Analysis
Continuous variables are presented as mean ± SD. The relationship between hepatic SULs and patient body morphometrics was assessed by the Pearson coefficient r. The 2-tailed, unpaired t test was used to assess the differences between groups. P values of less than 0.05 were considered significant. We used MedCalc (version 12.3; MedCalc Software) and SPSS (version 20; SPSS Inc.) for all analyses.
RESULTS
There were 1,033 patients (501 women, 532 men). BW for women was 71.0 ± 20.7 kg (range, 18.0–175.0 kg) and for men 82.9 ± 18.6 kg (range, 23.0–159.0 kg). BMI was 26.6 ± 7.3 (range, 7.0–60.3) and 26.2 ± 5.3 (range, 12.2–51.7) for women and men, respectively. Table 1 summarizes patients’ characteristics.
Study Patient Characteristics and Comparison of Mean Liver SUL in Women and Men According to James and Janmahasatian (Janma) Formulations
There was no statistically significant difference between liver SUV in women (2.14 ± 0.43) and men (2.09 ± 0.40) (P = 0.09). However, female patients had a lower hepatic SULJames (1.42 ± 0.25) than male patients (1.58 ± 0.26) (P < 0.0001). Liver SULJanma was also lower in women (1.30 ± 0.21) than in men (1.57 ± 0.25) (P < 0.0001; Table 1). There was no statically significant difference in liver SUV or SUL using either formulation with one or the other scanner, with P values varying between 0.1 and 0.5.
Figure 1 is a graph showing the dependence of LBM on BW. A distribution around an inverted parabola is seen for LBMJames, more pronounced for women as the extremum is reached, with the LBM decreasing for very obese women.
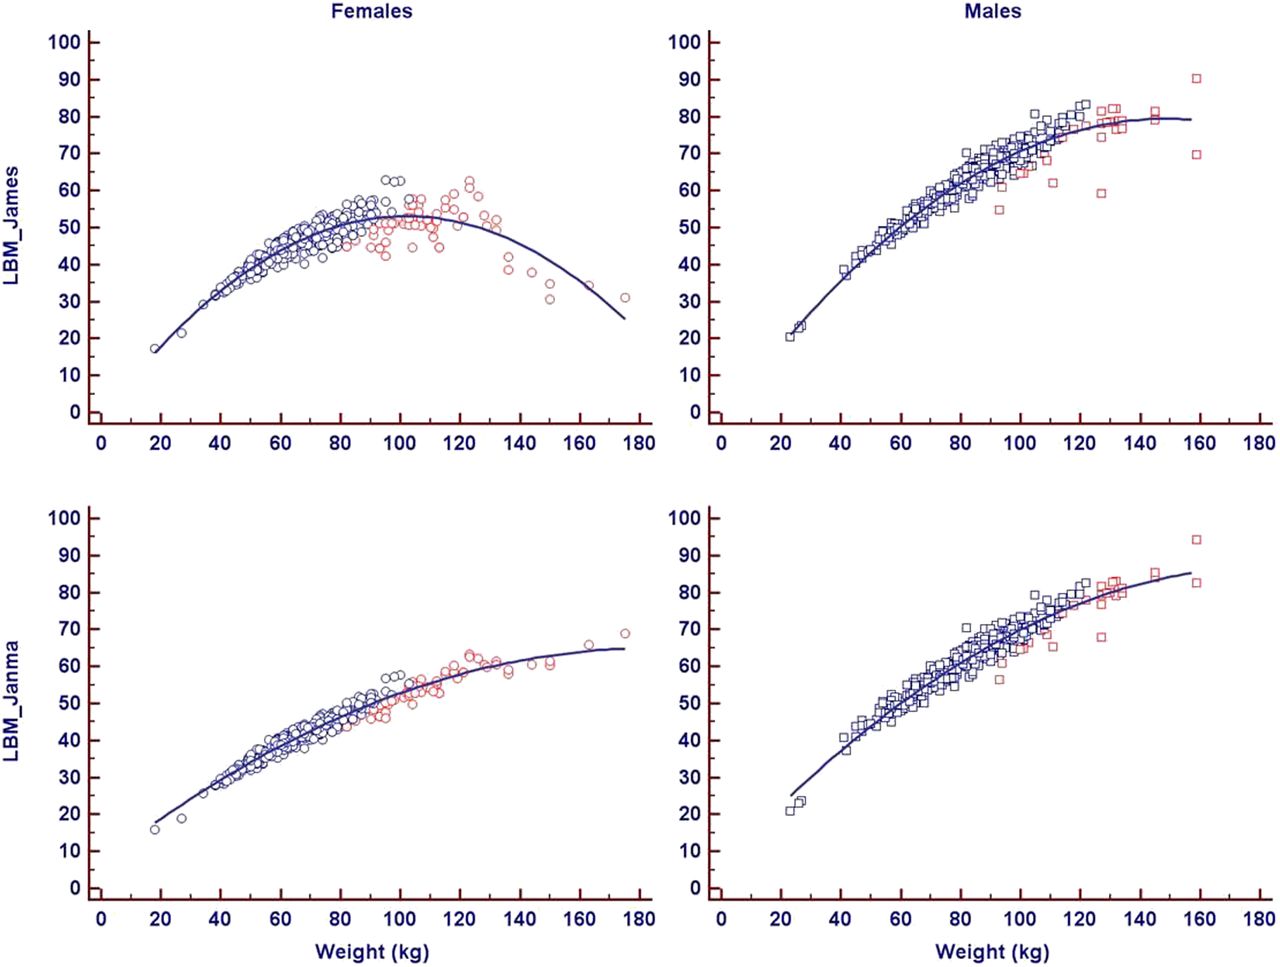
Graph showing dependence of LBM on BW. Distribution around inverted parabola is seen for LBMJames, more pronounced for women as extremum is reached, with LBMJames decreasing for obese women. This does not occur with Janmahasatian formulation of LBM. Blue = BMI < 35; red = BMI ≥ 35.
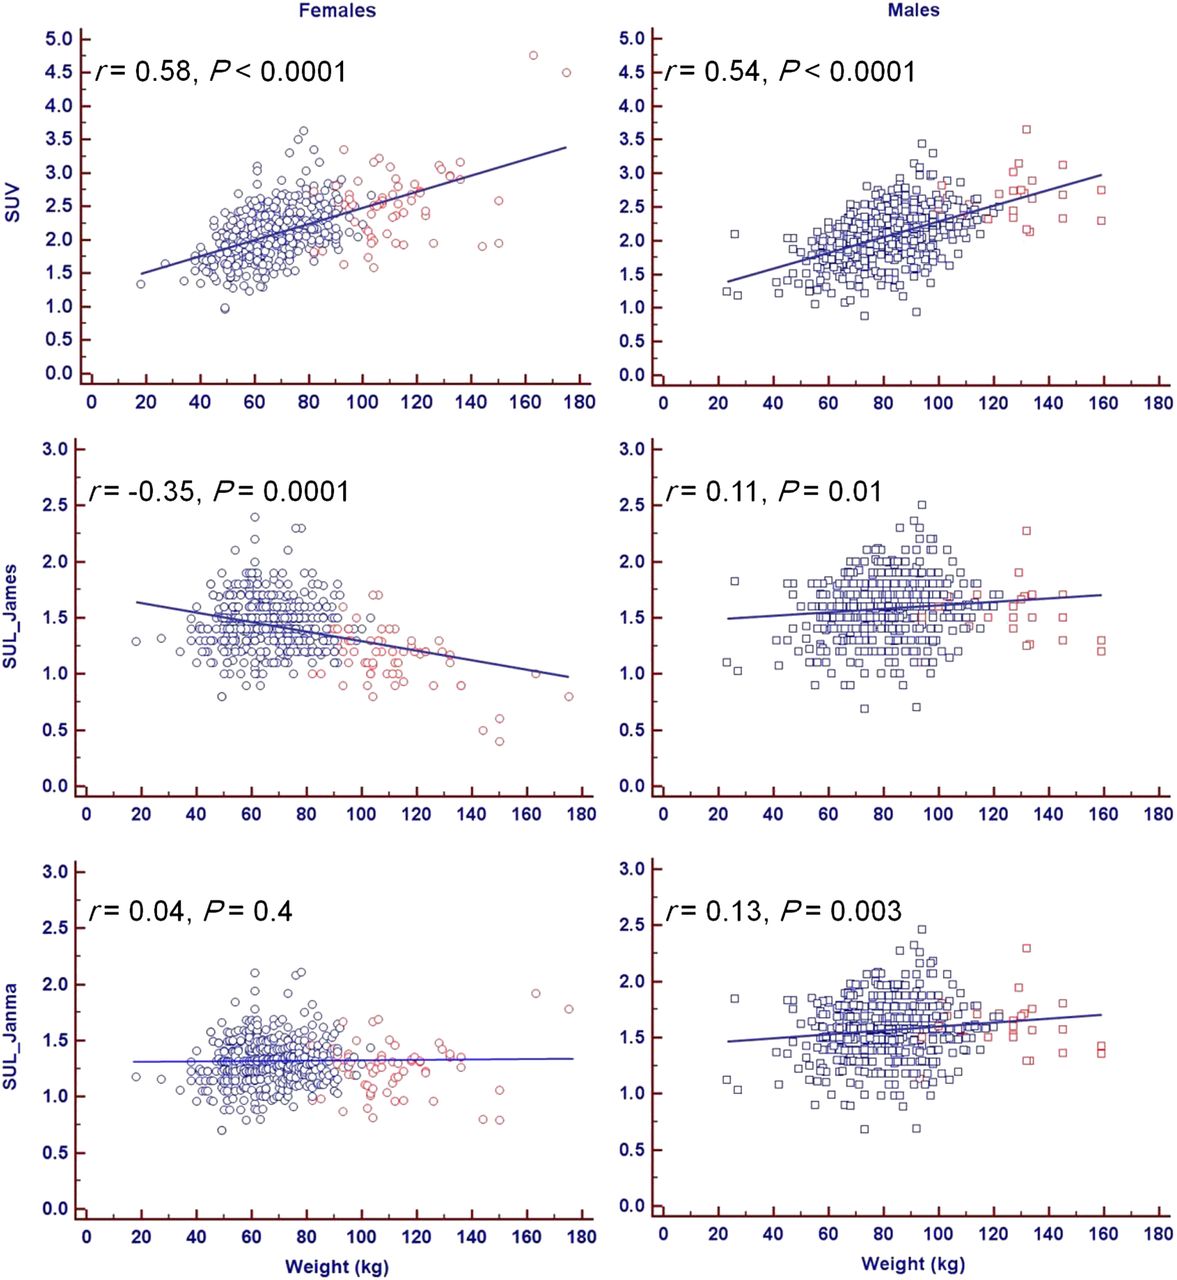
SUV has a significantly moderate positive correlation with weight for both women (r = 0.58, P < 0.0001) and men (r = 0.54, P < 0.0001). This correlation is reduced in men (r = 0.11, P = 0.01) and becomes negative for women (r = −0.35, P = 0.0001) with the James formulation of SUL. The Janmahasatian formulation annuls the correlation between SUL and weight for women (r = 0.04, P = 0.4) and decreases it for men (r = 0.13, P = 0.003). This information is summarized in Figure 2.

SUV and SUL vs. weight. SUV has significant moderate positive correlation with weight for both women and men. This correlation is reduced in men and becomes negative for women with James formulation of SUL. Janmahasatian formulation annuls correlation between SUL and weight for women and decreases it for men. Blue = BMI < 35; red = BMI ≥ 35.
The plot of hepatic SULJames to BW of women suggested the heavier subjects drive the negative correlation for SULJames. A subgroup analysis of obese women (BMI ≥ 35, n = 61) showed a significantly lower mean hepatic SULJames (1.14 ± 0.25) than the other women (BMI < 35, n = 440, SULJames = 1.46 ± 0.23) (P < 0.0001). There was no statistically significant difference in SUL according to the Janmahasatian formulation between these 2 groups (Table 2).
Subgroup Comparison of SUV and SUL of Obese Patients (BMI ≥ 35) of Either Sex to Their Leaner Counterparts (BMI < 35)
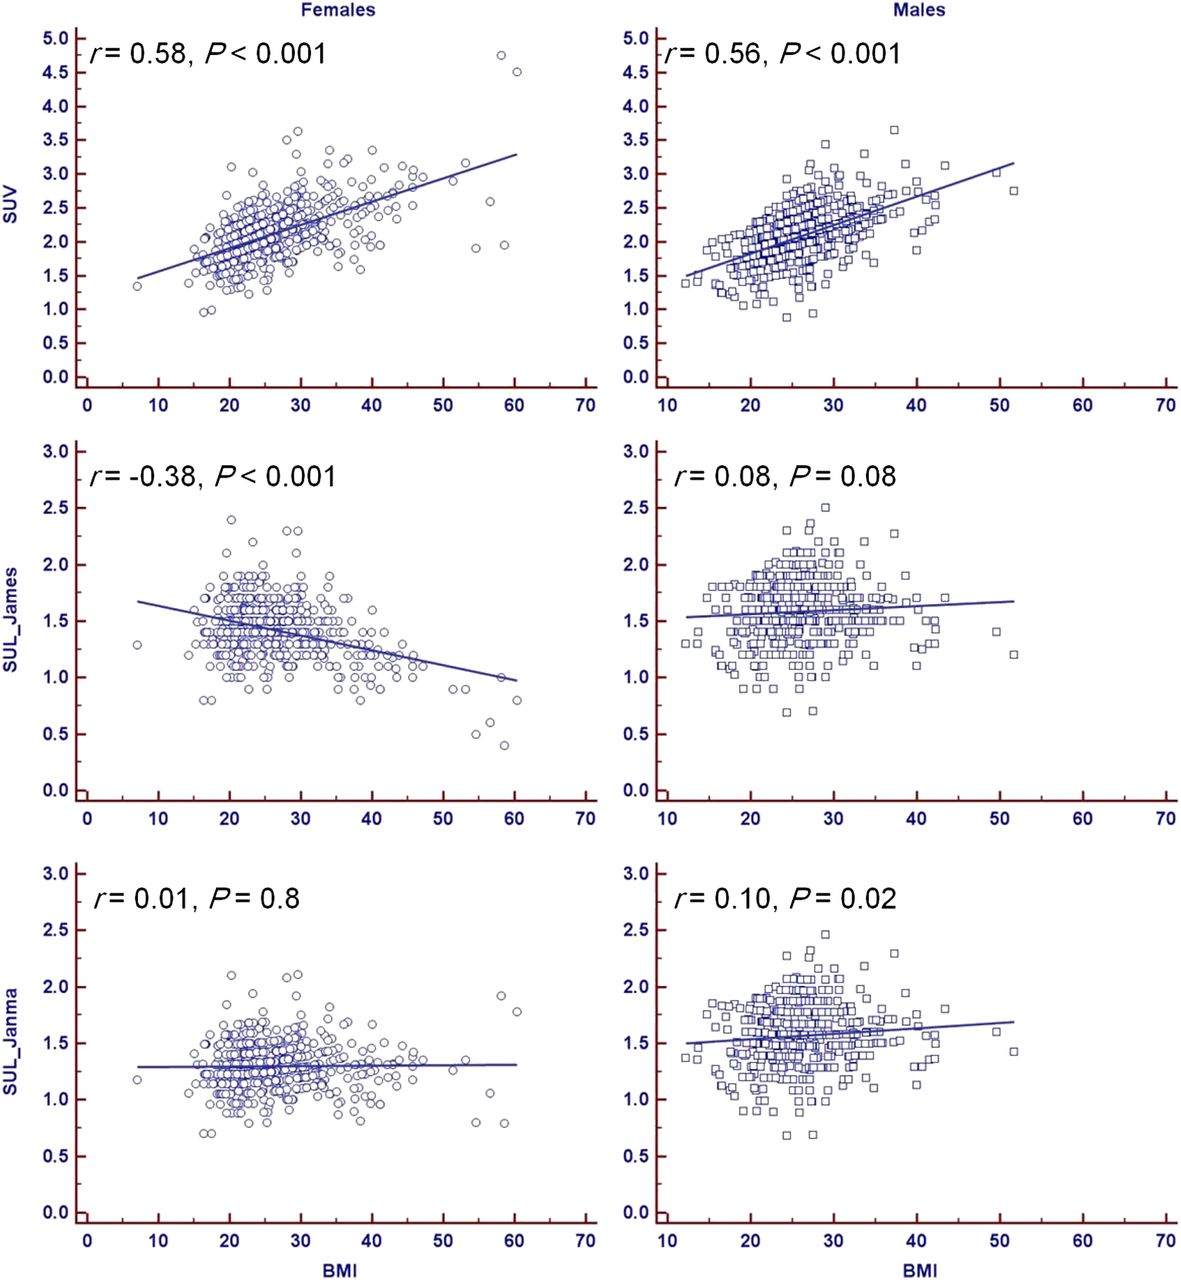
SUV has a significant moderate positive correlation with BMI for both women (r = 0.58, P < 0.001) and men (r = 0.56, P < 0.001). This correlation is lost in men (r = 0.08, P = 0.08) and becomes negative for women (r = −0.38, P < 0.001) with the James formulation of SUL. The Janmahasatian formulation annuls the correlation between SUL and BMI for women (r = 0.01, P = 0.8) and reduces it for men (r = 0.10, P = 0.02) (Fig. 3).

SUV and SUL vs. BMI. SUV has significant moderate positive correlation with BMI for both women and men. This correlation is lost in men and becomes negative for women with James formulation of SUL. Janmahasatian formulation annuls correlation between SUL and BMI for women and decreases it for men.
The negative correlation of SULJames in the female patients was reduced to nonsignificance when the very obese women (BMI ≥ 35) were excluded from the analysis (BW, r = 0.13, P = 0.8; BMI, r = −0.03, P = 0.5).
DISCUSSION
In this study, we found that the application of LBM correction of SUV in female patients according to the James formulation resulted in a significant negative correlation of hepatic SUL to total BW (r = −0.35, P < 0.0001) and BMI (r = −0.38, P < 0.001). This finding is seemingly contrary to previous publications that suggested LBM correction prevented a falsely elevated SUV in obese patients because 18F-FDG did not significantly accumulate in white fat (5). These very low SUL values are driven by the markedly lower liver SUL in very obese women.
The James equation for LBM is commonly incorporated into modern PET/CT systems and viewing workstations (10). When the LBM derived from this equation is graphed against BW, an inverted parabolic function is created (13). Therefore, the LBM values start to decrease after a critical weight, leading to what is likely an underestimation of LBM and an undercorrection of SUV in obese patients (11). This may explain the seemingly paradoxically low hepatic SUL in the female patients in this study.
Janmahasatian et al. (12) derived equations yielding the adjusted fat free mass that is almost equal to LBM for a wide range of BW. The SUV corrected with the Janmahasatian formulation does prevent very low SUL in obese patients and should be considered. Alternatively, direct measurement of body fat content by CT could also be considered.
We acknowledge some limitations of our study. Although we started with a large number of PET/CT studies (1,033), the number of obese women (BMI ≥ 35) included was not very large (61), though large enough to elucidate the behavior of LBM as given by the James formulation at high weights. The calculated critical value of BMI for female patients is 37, close enough to our chosen cutoff value. The study included too small a number of very obese men with a BMI ≥ 43 (only 4). This is the predicted BMI value beyond which we should see declining values for LBM as given by the James formulation for male patients.
CONCLUSION
Quantitative measurement of 18F-FDG PET scans is important in determining the outcome of patients with cancer. SUV is the predominant quantitative clinical index. However, absolute SUV does not accurately reflect tumor metabolism because white adipose tissue accumulates less 18F-FDG than other normal tissues in animals. We found inappropriately low hepatic SUL values in the very obese female patients. The same behavior is predicted to happen in morbidly obese male patients, possibly due to the known limitation of LBM equations used in modern PET/CT scanners. Revised LBM equations may be more accurate and these deserve further evaluation. Because obesity is a progressing epidemic, with patients weighing more than ever before, a reassessment of the LBM formulas used in modern PET/CT scanners should be seriously considered, with a strong recommendation to the PET/CT scanner and reading workstation manufacturers to change their software appropriately with the replacement of the James equations for LBM with the Janmahasatian formulae.
DISCLOSURE
The costs of publication of this article were defrayed in part by the payment of page charges. Therefore, and solely to indicate this fact, this article is hereby marked “advertisement” in accordance with 18 USC section 1734. No potential conflict of interest relevant to this article was reported.
Footnotes
Published online Jun. 24, 2014.
- © 2014 by the Society of Nuclear Medicine and Molecular Imaging, Inc.
REFERENCES
- Received for publication January 2, 2014.
- Accepted for publication April 29, 2014.


Jump to section
Related Articles
Cited By...
- Brown Adipose Tissue: A Protective Mechanism Against "Preprediabetes"?
- Assessing the Correlation Between 68Ga-PSMA-11 Renal PET Parameters and Renal Function Tests
- Sex Differences in Brain Tumor Glutamine Metabolism Reveal Sex-Specific Vulnerabilities to Treatment
- Radiologic Assessment of Groin Lymph Nodes in Pelvic Malignancies
- Revisiting Weight-Normalized SUV and Lean-Body-Mass-Normalized SUV in PET Studies
- Molecular Breast Imaging: Administered Activity Does Not Require Adjustment Based on Patient Size
- The Effect of New Formulas for Lean Body Mass on Lean-Body-Mass-Normalized SUV in Oncologic 18F-FDG PET/CT
- Scaling of Glomerular Filtration Rate and SUV for Body Size: The Curious Conflict of Whole-Body Metric Preferences
- Repeatability of 18F-FDG PET/CT in Advanced Non-Small Cell Lung Cancer: Prospective Assessment in 2 Multicenter Trials