


Visual Abstract

Abstract
Brown adipose tissue (BAT) is present in a significant number of adult humans and has been postulated to exert beneficial metabolic effects. Lean, nondiabetic patients undergoing clinical PET/CT imaging are more likely to exhibit incidental BAT activation. The aim of this study was to assess metabolic changes associated with the cold activation of BAT and to compare baseline blood metabolites in participants with varying amounts of active BAT. Methods: Serum blood samples were collected from healthy adult volunteers (body mass index, 18.0–25.0, and age ≤ 35 y) before and after 2 h of exposure to cold. 18F-FDG PET/CT imaging was performed immediately after cold exposure. Activated BAT was segmented, and fasting glucose, insulin, lipid, and other blood metabolite levels were correlated with volume and intensity of active BAT. Using a median cutoff, subjects were classified as high-BAT (BAThigh) or low-BAT (BATlow). Results: A higher volume of activated BAT was associated with significantly higher precooling glucose and insulin levels (P < 0.001 for each). Precooling thyroid-stimulating hormone and triglyceride levels were significantly higher in the BAThigh than the BATlow group (P = 0.002 and P < 0.001, respectively). Triglyceride levels tended to increase over the cooling period in both BAT groups but increased significantly more in the BAThigh group (15.7 ± 13.2 mg/dL; P < 0.001) than in the BATlow group (4.5 ± 12.2 mg/dL; P = 0.061). Conclusion: These findings may indicate that BAT is recruited to counteract incipient “preprediabetic” states, potentially serving as a first-line protective mechanism against very early metabolic or hormonal variations.
Brown adipose tissue (BAT) uses a variety of metabolic substrates to produce heat in mammals and so constitutes a potential target for the treatment of obesity and other metabolic disorders (1). White adipose tissue (WAT) stores energy as triacylglycerols, which can be released as nonesterified fatty acids (NEFAs) for energy consumption by metabolically active organs. BAT uses fatty acids released from intracellular triglyceride stores for β-oxidation to generate heat by a process known as adaptive thermogenesis (2).
The presence of BAT in adult humans was initially recognized mainly on 18F-FDG PET/CT examinations performed for oncologic indications (3,4). 18F-FDG PET has since become the most commonly used technique for the in vivo detection of cold-activated BAT in humans (5,6). Studies using PET with 18F-FDG or fatty-acid tracers have demonstrated that BAT consumes glucose and fatty acids (7–9).
Two primary pathways are known to regulate BAT glucose metabolism: adrenergic and insulin signaling (1). On sympathetic nervous system activation, norepinephrine is released, which binds to adrenergic receptors (β1-, β2-, and β3- adrenoceptors) expressed on BAT cell surfaces, causing an increase in cytosolic cyclic adenosine monophosphate levels (10). The result is an increase in glucose transporter 1 transcription and, via activation of the mammalian target of rapamycin complex 2, the translocation of this newly synthesized glucose transporter 1 to the cell membrane (11). Alternatively, insulin binds to BAT insulin receptors, and phosphoinositide 3-kinases phosphorylate protein kinase B, inducing the translocation of glucose transporter 4 to the cell membrane. Glucose, having been taken up by BAT cells using either pathway, is used for glycolysis, maintaining fatty acid oxidation, or activation of uncoupling protein 1 via de novo lipogenesis and fatty-acid synthesis (2).
The regulation of glucose by activated BAT may have important therapeutic implications, as exposure to cold has been shown to reverse glucose intolerance and insulin resistance in animal models (12–14). Cold acclimation may also result in increased fractional uptake in BAT (15). Observational human studies have indicated that the presence of active BAT is associated with lower glucose levels and a decreased risk of diabetes (16–18). However, the role of BAT in whole-body glucose consumption remains unclear since several prospective studies have indicated a minimal contribution by BAT to systemic glucose utilization (8,19). Still, others have shown a protective effect of BAT against diabetes (20).
Current evidence indicates that lipid metabolism in humans is modulated, at least to some degree, by BAT. BAT activation has been correlated with cold-induced increases in WAT lipolysis and NEFA oxidation, indicating that NEFAs are mobilized from WAT to fuel activated BAT. It has been hypothesized that increased BAT activity or volume increases uptake of NEFAs in BAT, improving overall lipid metabolism (12,21). A recent retrospective study found that nonstimulated BAT was associated with lower concentrations of circulating triglycerides (22). Rodent studies have demonstrated the clearance of triglyceride-rich lipoproteins and cholesterol from circulation by BAT (12,23) and have even seemed to demonstrate that active BAT modulates fuel selection in non-BAT organs (24). Even during fasting and postprandial conditions, BAT has been shown to take up significant amounts of circulating free fatty acids in mice (25). However, the practical implications of active BAT on lipid metabolism in humans remain unclear (26,27).
The primary aim of this study was to assess whether there are differences in baseline glucose, insulin, lipid, and other metabolite levels between subjects with varying amounts of cold-activated BAT. A secondary aim was to evaluate changes in these blood markers between precooling and postcooling serum blood samples. An additional aim was to assess how different lifestyle parameters are associated with BAT volume. These data were collected as part of a prospective study assessing the repeatability of BAT activity levels on 18F-FDG PET/CT (28).
MATERIALS AND METHODS
This prospective study was approved by the Washington University Institutional Review Board. All subjects provided written informed consent before participation. Between March 2016 and January 2020, 34 healthy volunteers were enrolled and underwent 18F-FDG PET/CT imaging after a cooling procedure intended to activate BAT (subject characteristics provided in Table 1). The median 18F-FDG uptake time was 61.0 min, with a range of 59.0–76.6 min. Median blood glucose, measured immediately before 18F-FDG administration, was 78 mg/dL, and the range was 58–103 mg/dL. Since younger age and lower body mass index have been shown to correlate with higher amounts of metabolically active BAT (7,29,30), healthy adult volunteers aged 18–35 with a body mass index between 18 and 25 were eligible for this study. Furthermore, as drugs targeting the sympathetic nervous system (e.g., nicotine, β-blockers, and amphetamines) can interfere with BAT activation (31), individuals with a history of consuming these agents were excluded. A complete list of inclusion and exclusion criteria can be found in Supplemental Table 1 (supplemental materials are available at http://jnm.snmjournals.org). Subjects were recruited using flyers posted at various locations on the Washington University in St. Louis medical campus.
Subject Characteristics
Subject Preparation
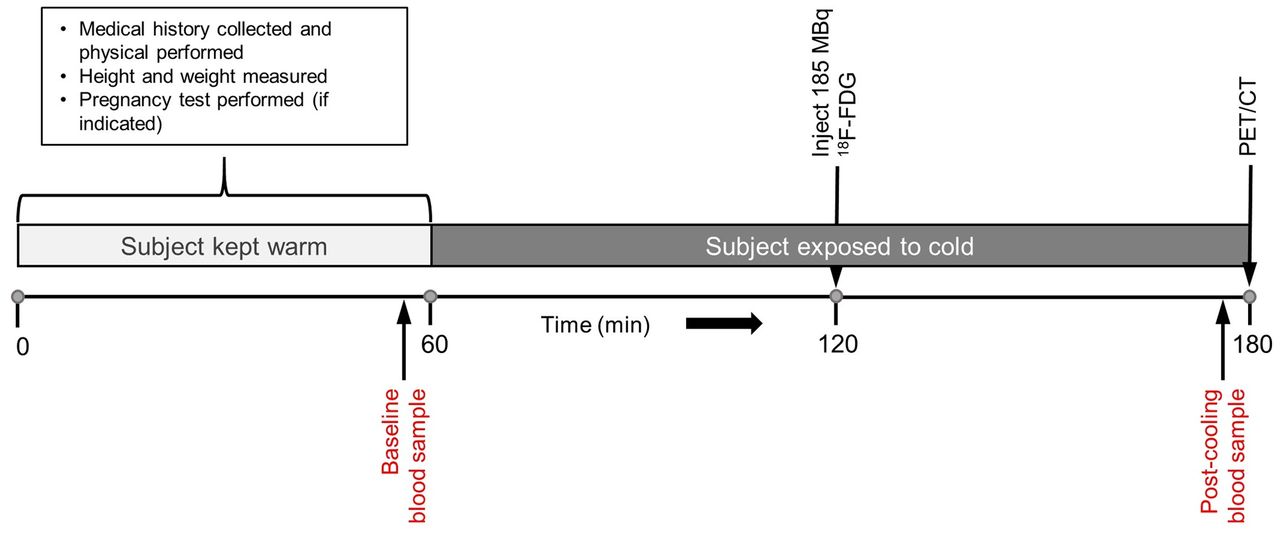
A schematic representation of the imaging visit is shown in Figure 1. All subjects were instructed to fast for at least 6 h before imaging and to avoid high-carbohydrate and high-fat foods. Subjects were also asked to avoid cold exposure and to refrain from exercise during the 24 h before the imaging sessions. To prevent premature BAT activation, subjects were kept warm for 60 min, using warmed blankets, before the start of the cold-exposure procedure. During this period, the precooling blood sample was drawn for metabolite analysis. After the preparatory phase, participants were outfitted in a cooling suit (CureWrap; MRTE Advanced Technologies) that circulates chilled water at a set temperature.

BAT activation and imaging process. After 1-h warming period, volunteers were exposed to cold for ∼2 h to activate BAT. After first hour of cooling, 185 MBq of 18F-FDG were administered intravenously. Cooling continued for a second hour, and PET/CT imaging was performed immediately afterward.
Lifestyle Interview
During the preparatory phase, subjects were asked a series of questions to assess the impact of lifestyle on BAT activity. Volunteers were asked to describe any specific diet they followed within the year before the study, to report any dietary supplements they consume regularly, and to estimate their weekly caffeine and alcohol intake. Subjects were asked to describe their normal exercise habits, if any, during the previous year. Exercise descriptions were recorded and coded as mostly aerobic, mostly anaerobic, or combination aerobic/anaerobic.
Cooling Protocol
An individualized cooling protocol was used with a goal of cooling the subject to just above the shivering point (5). Initially, the water temperature of the cooling suit was set at 10°C for all subjects. Subjects were monitored for shivering, both visibly and via electromyogram (electrodes placed over the vastus lateralis, pectoralis major, and latissimus dorsi muscles). If shivering was observed or reported, the water temperature was increased at 0.5°C increments every 60 s until shivering stopped. Oral temperature and blood pressure were measured every 5 min during the cooling procedure. A 185-MBq dose of 18F-FDG was administered intravenously after 60 min of cooling. Cooling continued during the 60-min 18F-FDG uptake phase. Immediately before 18F-FDG PET/CT imaging, subjects were removed from the cooling suit.
Imaging Protocol
Imaging and reconstruction parameters are detailed in Supplemental Table 2. All subjects were imaged on a Biograph 40 PET/CT TruePoint/TrueView scanner (Siemens AG). In humans, most active BAT depots are located in the supraclavicular and paravertebral regions, with additional foci commonly seen in the axillary, intercostal, mediastinal, and perirenal areas. Therefore, PET imaging (three 8-min list-mode acquisitions) was performed from the skull base to the umbilicus. A low-dose CT scan (using CARE Dose [Siemens] tube current modulation) was obtained immediately before the PET scan. The imaging protocol followed the standards set forth by the Uniform Protocols for Imaging in Clinical Trials for 18F-FDG PET/CT and the Radiologic Society of North America–Quantitative Imaging Biomarker Alliance’s profile for quantitative 18F-FDG PET/CT (32,33).
Image Analysis
Images were analyzed using MIM, version 6.9.3 (MIM Software). Activated BAT was segmented (Fig. 2) and quantified according to the recommendations of version 1.0 of the Brown Adipose Reporting Criteria in Imaging Studies (5). Areas known to contain BAT were qualitatively assessed, and likely BAT depots were identified. Volumes of interest were drawn on coronal 18F-FDG PET/CT images slice-by-slice, taking care not to include any adjacent normal 18F-FDG–avid tissues. Thresholds were then applied to this manual volume of interest to first remove voxels with lean body mass–adjusted SUVs (SULs) below 1.2 and then to remove voxels with Hounsfield units outside the −190 to −10 range. Thus, the final activated BAT volumes consisted of voxels with SULs above normal background levels and within the fat density range.

BAT segmentation was performed per Brown Adipose Reporting Criteria in Imaging Studies, version 1.0, guidelines. (A) Areas known to contain BAT depots were manually delineated. (B and C) On PET images, voxels with SULmax less than 1.2 were removed (B) and on CT images, voxels with Hounsfield units outside range of −190 to −10 were removed (C). (D) Boolean intersection of PET and CT images was used to obtain final volumes of interest.
The total activated BAT metabolic volume (BMV) was the sum of all segmented BAT volumes. For participants included in the test–retest study, BMV and the maximum SUL (SULmax) for each imaging session were analyzed separately. The SULmax was defined as the single voxel within all the segmented BAT depots with the greatest 18F-FDG uptake. The version of MIM used for our analyses uses the James equation for lean body mass computation (34). For subjects without visually detectable BAT, the SULmax was instead based on the background activity of the fat in the right supraclavicular fossa, using a spheric region of interest (3.0-cm radius). This region was chosen because the supraclavicular fossa most commonly contains the BAT depot with the most 18F-FDG uptake.
Biologic Assays
Methods used for blood sample analyses are provided in Supplemental Table 3. All tests were performed using either Cobas 6000 or Cobas 8000 (Roche Diagnostics). Blood samples were analyzed in the Barnes Jewish Clinical Chemistry Laboratory, which holds College of American Pathologists and Clinical Laboratory Improvement Amendments certifications. Lipid data were available for all subjects, whereas insulin, glucose, and other metabolite data were available for only a subset of participants.
Statistics
Numeric results are reported as mean and SD or as median and interquartile range. Subject characteristics were summarized descriptively via means, medians, SD, and ranges. A subset of participants was included in a test–retest repeatability study (n = 29) and underwent the cooling and imaging protocol twice on separate days. Blood samples collected during these visits were pooled with the remaining data and considered independent samples. Baseline and postcooling metabolite measurements were compared using paired t tests. Serum metabolite differences between high-BAT (BAThigh) and low-BAT (BATlow) groups were assessed using unpaired t tests or Mann–Whitney U tests, depending on group normality. Group normality was assessed using D’Agostino–Pearson tests. The Fisher exact test was used to assess differences in demographics and lifestyle assessments between subjects without versus with detectable BAT. Data were analyzed using R, version 4.0.3 (http://cran.r-project.org/), and Excel, version 2016 (Microsoft Corp.). A P value of less than 0.05 was considered significant, unless otherwise indicated. A Bonferroni adjustment for multiple comparisons was applied when necessary to control for type I errors.
RESULTS
Subject Characteristics
During cold exposure, oral temperatures varied by a mean of ±0.4°C. Systolic pressure increased during cooling by a minimum of 8 mm Hg and a maximum of 42 mm Hg. Diastolic pressure increased during cooling by a minimum of 11 mm Hg and a maximum of 39 mm Hg. Heart rate increased by 11–30 beats per minute throughout cooling.
Activated BAT was detected in 28 of 34 (82.4%) subjects. Using a median volume cutoff, PET/CT studies showing an activated BMV greater than or less than 120 cm3 were classified as BAThigh or BATlow, respectively. The mean BMV of the BATlow group (n = 17) was 36.9 ± 29.1 cm3, and the mean BMV of the BAThigh group (n = 17) was 224.3 ± 78.4 cm3. There were no substantial differences in age, height, or weight between groups. A significant difference in body mass index was found, with BAThigh subjects having a higher body mass index than BATlow subjects (P = 0.026).
Insulin and Glucose
Mean baseline insulin and glucose levels were significantly lower in the BATlow than the BAThigh group (Table 2). Between baseline and postcooling samples, mean insulin levels increased by 1.6 ± 1.2 μIU/mL in the BATlow group and decreased by 2.7 ± 1.4 μIU/mL in the BAThigh group. Baseline glucose and insulin showed significant positive correlations with both BMV and SULmax (Figs. 3 and 4). The change in glucose and insulin levels from baseline to postcooling samples showed significant negative correlations with both BMV and SULmax. Baseline insulin and glucose also significantly correlated with one another (r = 0.67; P < 0.001), as were the changes in insulin and glucose (r = 0.51; P = 0.019).
Glucose and Insulin t Test and Regression Analysis Results

Regression analysis shows correlation between BMV and baseline serum glucose (A), change in glucose from baseline to postcooling (B), baseline serum insulin (C), and change in insulin (D). Baseline values were subtracted from postcooling values.

Regression analysis shows correlation between BAT SULmax and baseline serum glucose (A), change in glucose from baseline to postcooling (B), baseline serum insulin (C), and change in insulin (D). Baseline values were subtracted from postcooling values.
Lipids
Groupwise serum lipid results are shown in Table 3. Baseline total cholesterol, triglycerides, and high-density lipoprotein were significantly higher (P = 0.002, P < 0.001, and P = 0.004, respectively) in BATlow versus BAThigh subjects. The BATlow group also showed higher baseline low-density lipoprotein and non–high-density lipoprotein levels than the BAThigh group, though not statistically different. Between baseline and postcooling blood samples, serum total cholesterol, high-density lipoprotein, non–high-density lipoprotein, and low-density lipoprotein increased significantly for both groups (all P values below 0.01). Serum triglycerides increased significantly between baseline and postcooling samples for BAThigh subjects (15.7 ± 13.2 mg/dL; P < 0.001) but did not increase significantly in the BATlow group (4.5 ± 12.2 mg/dL; P = 0.061).
Serum Lipid t Test and Regression Analysis Results
Baseline triglycerides, cholesterol, and high-density lipoprotein also significantly correlated with BMV and SULmax (Supplemental Figs. 1 and 2). The change in triglycerides from baseline to postcooling samples also significantly correlated with BMV and SULmax.
Other Metabolites
Several additional metabolites showed groupwise differences and varied significantly between baseline and postcooling blood samples (Table 4). Mean baseline thyroid-stimulating hormone (TSH) was significantly lower in the BATlow than the BAThigh group (P = 0.002). Mean baseline sodium, anion gap, urea nitrogen, albumin, and alkaline phosphatase were significantly higher in the BATlow than the BAThigh group.
Additional Baseline Serum Metabolite t Test and Regression Analysis Results
Lifestyle
Participants reported engaging in either no strict dietary regimen or adhering to a vegetarian, vegan, gluten-free, low-carbohydrate, or pescatarian diet. BATlow subjects were significantly more likely to report observing a controlled diet than BAThigh subjects (P = 0.007). Only 1 of 17 BAThigh participants reported following a specific diet (pescatarian), whereas 8 of 17 BATlow subjects reported adhering to a strict diet. The use of dietary supplements also varied between groups, with BAThigh subjects reporting either no use of dietary supplements or use of protein, melatonin, biotin, omega-6 fatty acids, or magnesium (8/17 subjects), whereas BATlow subjects reported either no diet supplementation or using only a daily multivitamin (7/17 subjects). There were no significant differences between groups with respect to self-reported weekly intake of caffeine or alcohol.
Exercise habits also differed between groups. Those who reported not regularly exercising were significantly more likely to have higher BAT volumes (7/17 BAThigh vs. 0/16 BATlow; P = 0.018). Among those who exercised regularly, the self-reported mean number of hours spent exercising per week was 3.4 in the BATlow group and 1.9 in the BAThigh group (P = 0.011). Within the BATlow group, 1 participant reported engaging in mostly anaerobic exercise, 10 in mostly aerobic exercise, and 6 in exercise that incorporated aerobic and anaerobic elements. Three BAThigh subjects reported engaging in mostly anaerobic exercise, 2 in mostly aerobic exercise, and 5 in exercise that was both aerobic and anaerobic.
DISCUSSION
BAT has emerged as a potential therapeutic target for obesity and related metabolic diseases. Using a previously described method, BAT was activated in this study using cold exposure and then imaged using 18F-FDG PET/CT. Higher baseline insulin and glucose levels correlated with higher BMV (Supplemental Fig. 3). Greater declines in insulin and glucose levels after BAT activation also correlated with higher BMV.
Glucose and Insulin Activity
Activated BAT has been shown to act as a glucose sink in both warm and cold conditions (35,36), which is consistent with the significant positive correlation seen here between BMV and decreases in glucose and insulin levels during cooling. BAT thermogenesis likely resulted in significant uptake of glucose in BAT, especially in subjects with higher amounts of BAT, consistent with previous studies. However, our results are inconsistent with studies showing increased BAT uptake of glucose during warm conditions, as baseline glucose and insulin both positively correlated with BMV in our subjects. Retrospective analyses have generally concluded that patients with active BAT are more likely to have lower fasting glucose levels and less likely to be diabetic (7,16,17,37,38). Though, as these observational studies consisted mostly of patients undergoing clinical 18F-FDG PET/CT, the populations evaluated were mostly much older than the volunteers enrolled in the current study.
Lipid Metabolism
The role of BAT in systemic lipid metabolism is supported by previous studies showing that the amount of detectable BAT correlates with cold-induced increases in WAT lipolysis and NEFA oxidation, suggesting that BAT activation plays a role in mobilization of NEFAs from WAT and their oxidative disposal in BAT (19,21). Din et al. found that in BAT regions, subjects with higher volumes of activated BAT took up more NEFAs from circulation than subjects with lower volumes of BAT (39). It has also been shown that administration of nicotinic acid, an inhibitor of triglyceride lipolysis, suppresses the cold-induced BAT metabolic rate, implying that lipolysis is central to BAT thermogenesis (40). Although it seems clear that BAT relies on lipids to fuel thermogenesis during cold exposure, most studies have not found a corresponding increase in serum or plasma lipid levels (8,14,19). One possible explanation for the significant increases we found in circulating lipid levels is that activated BMVs elicited in this study were considerably higher than in most other published work. A higher degree of activation would likely deplete intracellular fuel and require additional substrates from other sources. This type of control mechanism over triglyceride metabolism via clearance by BAT has been demonstrated in cold-exposed mice (12).
Early Metabolic Dysfunction
Orava et al. found BAT to be highly sensitive to stimulation by insulin (35). In young, healthy adults, it may be the case that higher insulin levels result in routine activation of BAT, which has been shown to increase overall BMV (15,41). Free fatty acids, derived from triglyceride lipolysis, are thought to be activators of uncoupling protein 1. We found higher thermoneutral circulating triglyceride levels in subjects with greater volumes of BAT. This may be another mechanism of routine BAT activation. Additionally, baseline plasma TSH was found to be significantly elevated in subjects with higher amounts of cold-activated BAT. TSH receptors are present in adipose tissue and have been linked to an increase in uncoupling protein 1 expression in preadipocytes (42). This may indicate that increased TSH levels stimulate BAT production. These findings, along with the strong positive correlations between BMV and thermoneutral insulin, glucose, and triglyceride levels, may suggest BAT plays a role in protecting against early stages of insulin resistance (preprediabetes) and hyperlipidemias.
Metabolic Profile
Previous studies have tended to show that activated BAT is associated with a healthier metabolic profile (i.e., lower fasting glucose, greater insulin sensitivity, and less likelihood of diabetes, obesity, and cardiometabolic diseases) (16–18,22,37). The results of our study show that within a group of young, lean, healthy adults, those with a higher BMV had a potentially poorer overall metabolic profile. Higher baseline insulin, glucose, TSH, and serum triglycerides were associated with a higher BMV. Those with less activated BAT also exercised more (about twice as much per week) and were more likely to report adhering to diets that could be considered healthier. The effect of exercise on BAT is unclear in humans, as relevant studies have produced conflicting results. However, exercise is known to cause secretion of endocrine factors that modulate BAT activity, including cardiac natriuretic peptides (induction of uncoupling protein 1 expression and mitochondrial biogenesis) (43), fibroblast growth factor 21 (increased BAT activity) (44), and interleukin 6 (improved BAT-mediated metabolic homeostasis) (13).
Dietary differences are particularly interesting, as certain diet regimens likely include foods known to contain BAT-promoting compounds (45). At least part of a vegetarian or vegan diet may contain foods rich in phytochemicals such as capsaicin (46) or curcumin (47), which have been linked to increased BAT activation. There is also accumulating evidence that eicosapentaenoic acid and docosahexaenoic acid, found abundantly in fish oils (a likely component of a pescatarian diet), may stimulate BAT thermogenesis (48) and WAT browning (49). It may be somewhat surprising, then, that all but one subject who reported adhering to a strict dietary regimen were part of the BATlow group. It may be the case that the high BMV exhibited by subjects in the BAThigh group who exercised less and consumed less healthy diets played a protective role against the early symptoms of metabolic disorders, which are driven at least in part by lifestyle choices.
Adipokines Released from BAT (BATokines)
Although BAT is hypothesized to shift caloric balance in a net-negative direction, its endocrine effects may be more potent. In animal models, BAT transplants can improve glucose tolerance, increase whole-body insulin sensitivity, and reverse type 1 diabetes (13,25,50). These improvements are unlikely the result of caloric expenditure or glucose consumption alone but appear to be caused by BAT endocrine signaling (51). BATokines are substances preferentially released by BAT versus WAT, which may have endocrine effects (52). BAT is known to release significant amounts of fibroblast growth factor 21 (53,54), which has a role in improving glucose intolerance and increasing fatty acid oxidation in the liver (55). An increase in insulinlike growth factor 1 is thought to be mostly responsible for the reversal of diabetes seen in mouse models (56). Neuregulin 4 is highly expressed in BAT and its overexpression correlates with improved glucose tolerance and decreased insulin insensitivity (57). BATokines such as these, which are potentially released routinely in people such as those in the BAThigh group, may help to mitigate the impacts of early metabolic or hormonal disturbances.
It is important to note that although significant differences in metabolite levels were found between groups with higher and lower activated BAT volumes, almost all metabolite levels detected during this study were within reference ranges. In otherwise healthy individuals, such as those studied here, who present with borderline metabolic results (e.g., upper end of the normal range of insulin or glucose) it would be useful to correlate their levels of BAT activity with clinical outcomes over time. It may also be beneficial to collect additional samples at subsequent time points to assess the short-term impact of cooling and BAT activation on lipid and other metabolite levels.
CONCLUSION
Our data, obtained under conditions that strongly activate BAT, show significant systemic differences between individuals with higher and lower volumes of active BAT. From these data, we believe that BAT may be recruited to counteract incipient preprediabetic states, potentially serving as a first-line protective mechanism against very early metabolic and hormonal variations.
DISCLOSURE
No potential conflict of interest relevant to this article was reported.
KEY POINTS
QUESTION: Is active BAT associated with a particular metabolic profile in healthy, young adults?
PERTINENT FINDINGS: In a young, otherwise healthy sample of adults, a higher volume of active BAT was found to be associated with significantly higher preactivation levels of serum glucose, insulin, TSH, and triglycerides.
IMPLICATIONS FOR PATIENT CARE: Imaging BAT using 18F-FDG PET/CT may help identify patients with very early metabolic abnormalities.
ACKNOWLEDGMENTS
The work presented here was conducted using the scanning and special services in the MIR Center for Clinical Imaging Research, located at the Washington University Medical Center. We thank Lauren Ash, Jessica Cartier, and Lisa Schmidt for assistance with data collection.
Footnotes
Published online Apr. 7, 2022.
- © 2022 by the Society of Nuclear Medicine and Molecular Imaging.
REFERENCES
- Received for publication December 4, 2021.
- Revision received March 21, 2022.


